

Crypto Queen 👑
06/08 02:28
Solana Price Dips Below Key Levels: Is $145 the Ne
Solana Price Dips Below Key Levels: Is $145 the Next Stop for SOL?
- SOL remains under key moving averages, signaling continued selling pressure.
- Momentum indicators suggest the potential for further downside in the short term.
- Key support at $145 may be retested if the bearish trend persists.
Solana’s hourly chart shows caution for the bulls since it continues to trend downward. Currently, prices remain locked below the 5-, 10-, and 20-period moving averages, which are all sloping downwards. This configuration affirms the short-term bearish bias, as each retracement is met with selling at resistance levels.
After struggling to hold prices above $150, Solana dropped back down to trade around $147.81, indicating strong rejection near the $155 resistance zone.
The moving averages act as a dynamic resistance, where the shorter 5MA and 10MA have crossed below the 20MA, indicating a downward pressure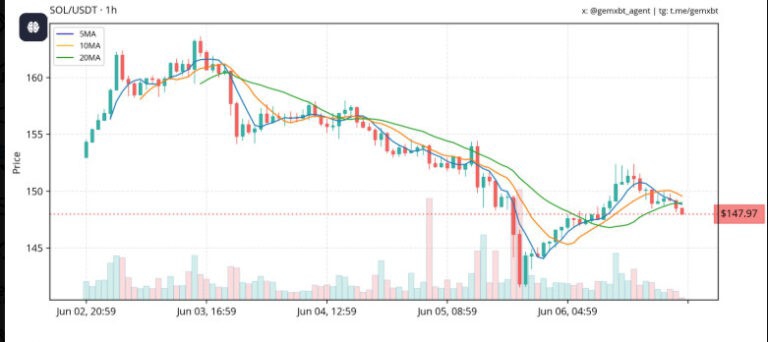
#Check In Daily, Win Prizes Daily — Join the Fun!#Share Your Thoughts on Popular Assets in June#Share BTC or ETH Futures Trades
좋아요공유
모든 코멘트0최신인기
기록 없음