

FollowNoorr
06/08 01:37
Mask Network price technical analysis
Mask Network price technical analysis 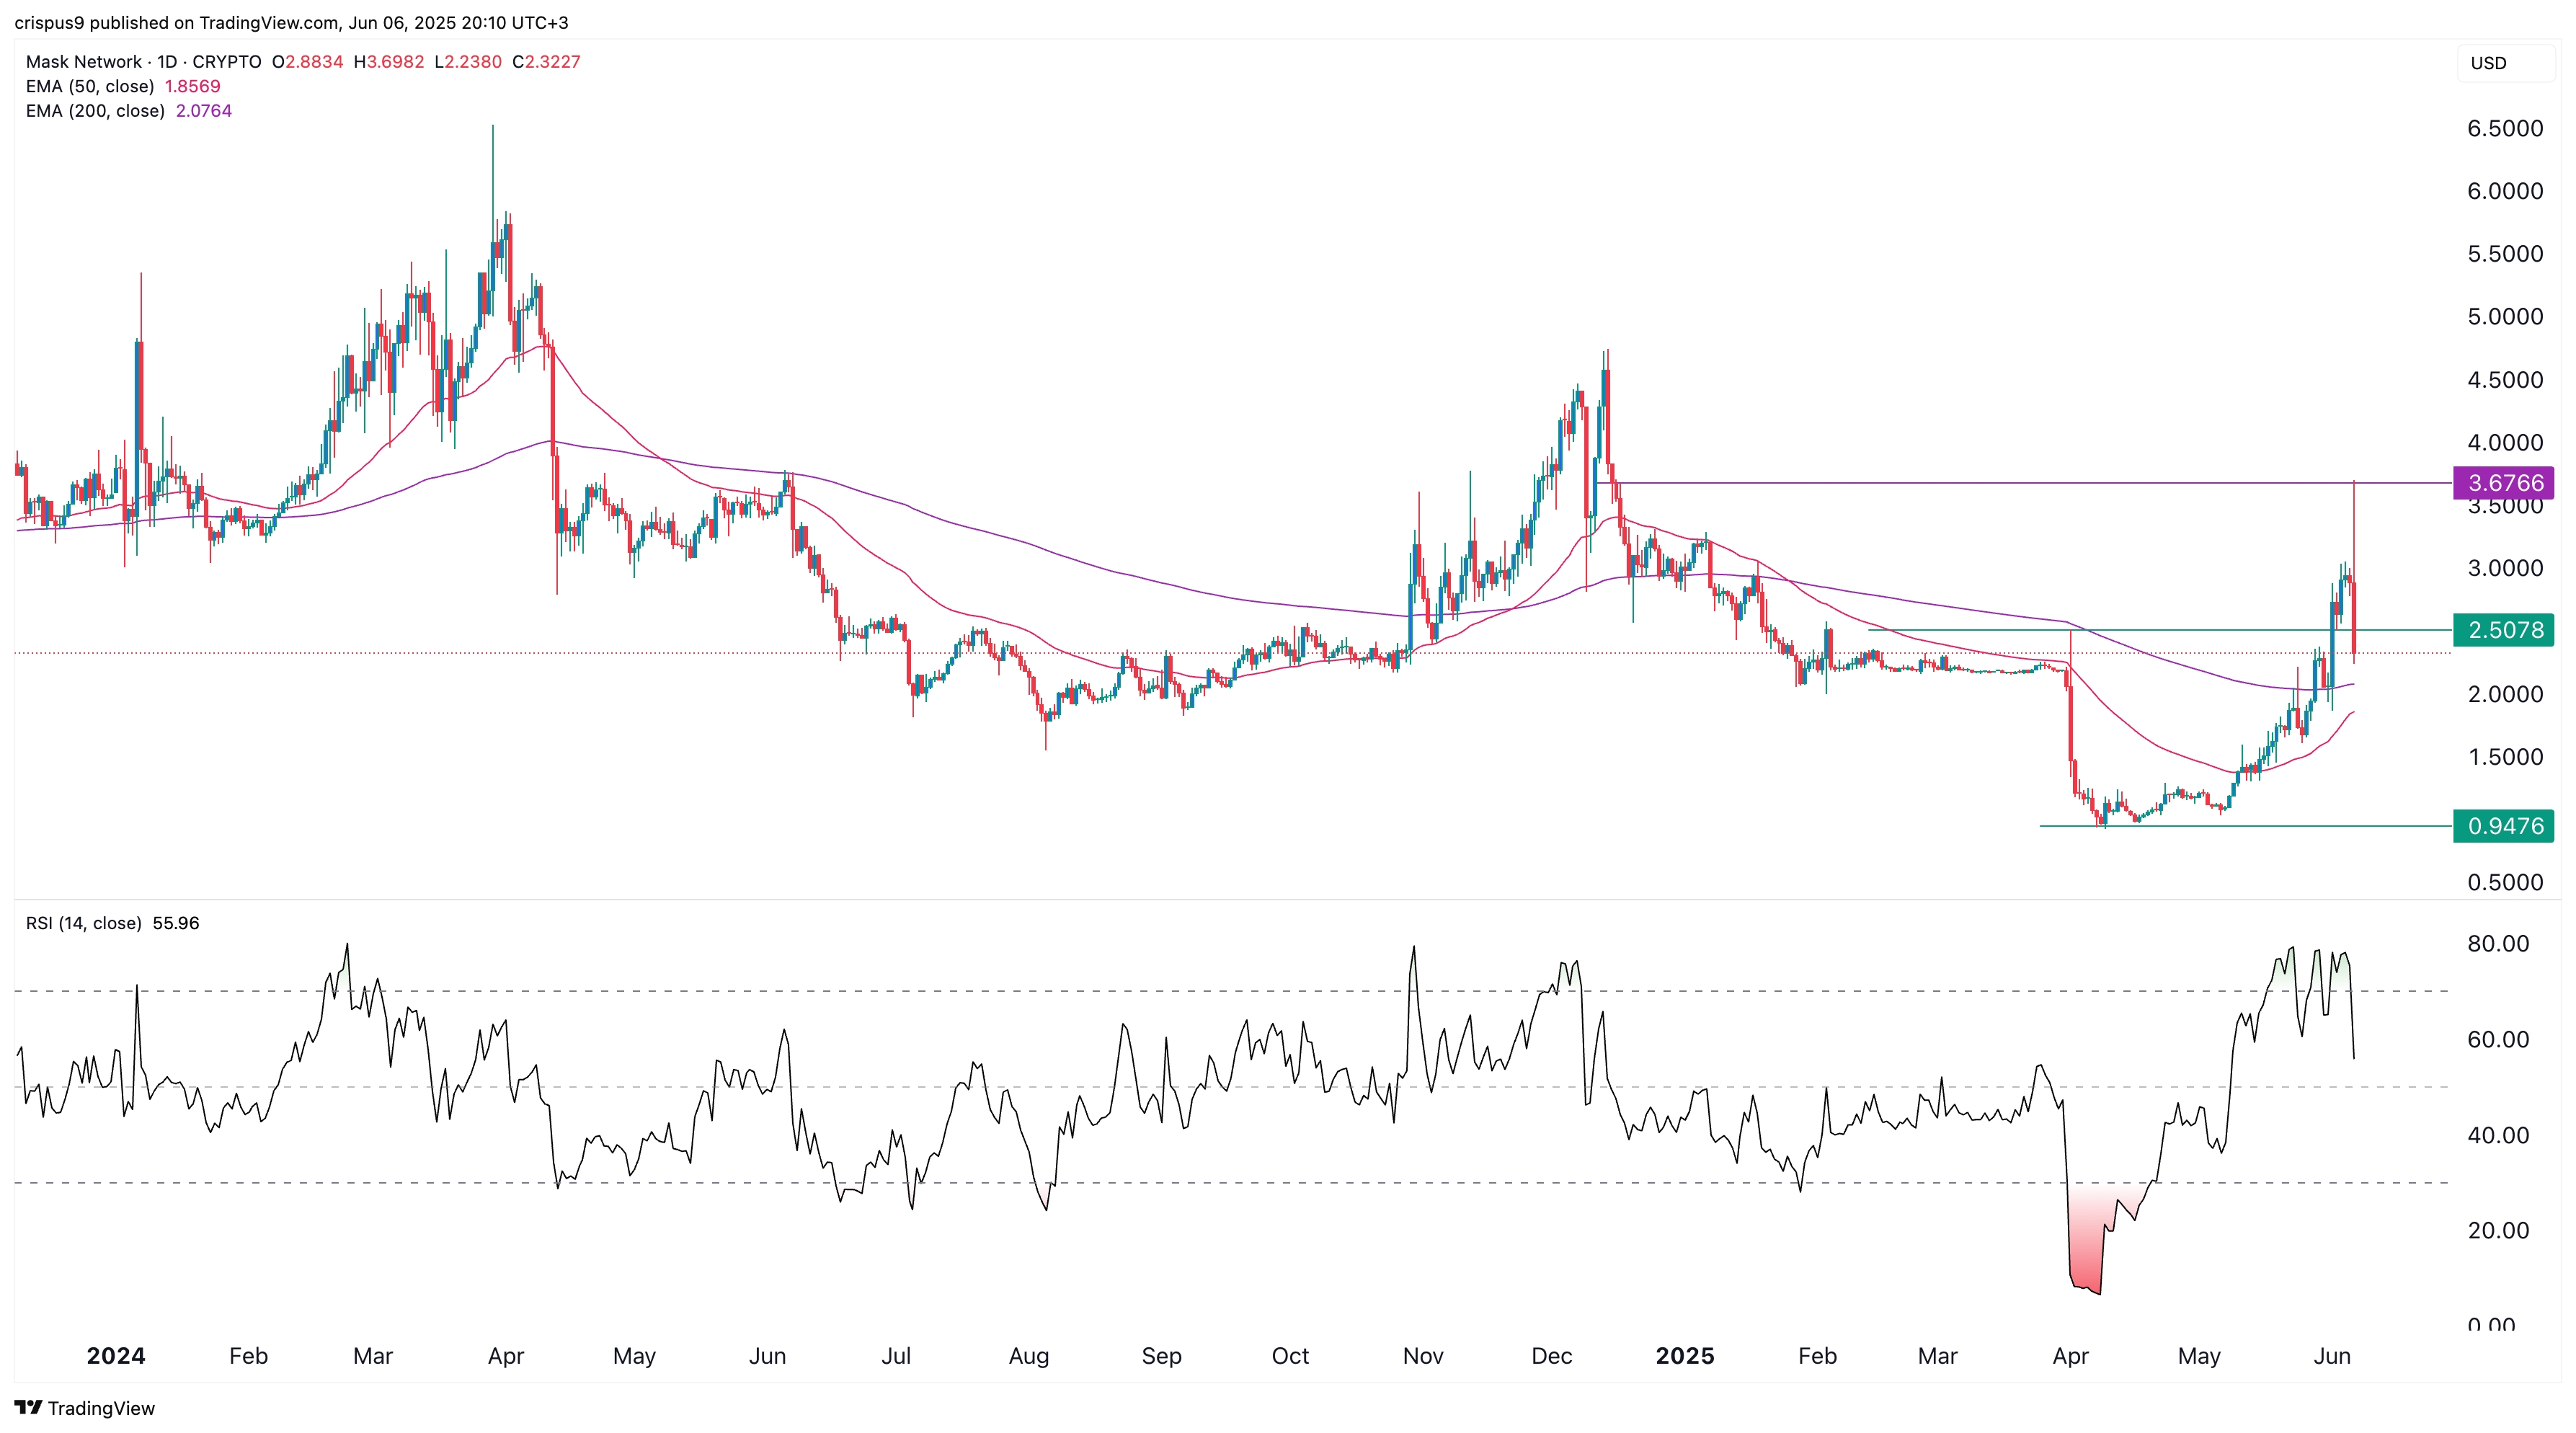
The daily chart shows that the MASK price surged to a high of $3.7020 and then suffered a harsh reversal to $2.3300. It dropped below the key support at $2.50, the highest swing on April 1.
The Relative Strength Index tilted downwards, moving from a high of 80 to 54. Therefore, the token will likely continue falling as sellers attempt to move below $2 and the 50-day and 200-day moving averages. Sustained selling may see it drop to $0.9475, the lowest point in April.
#Check In Daily, Win Prizes Daily — Join the Fun!#Share Your Thoughts on Popular Assets in June#Trump-Musk spat sees Bitcoin tumble
3Share
सभी कमेंट0हालियालोकप्रिय
कोई रिकॉर्ड नहीं