

FollowNoorr
06/08 01:25
Chart of the week: Solana indicators point north,
Chart of the week: Solana indicators point north, bulls test $165 targetSolana rallied nearly 5% on Friday, down almost 10% in the past week. The Ethereum competitor will likely rally towards its $165 target, a 13% rally within the next week. While Ethereum draws the interest of institutional investors, Solana is competing through partnerships and decentralized applications on the blockchain.
Solana price forecast
According to technical indicators on the SOL/USDT daily price chart, Solana sol0.79%Solana could soon observe a trend reversal. SOL is trading at $149.92, and the Ethereum
eth1.51%Ethereum competitor could rally 13% and test resistance at $170, the upper boundary of the FVG on the daily price chart.
Above $170, there are two key resistances: R1, which is the psychologically important price level of $200, and R2, which is the lower boundary of an FVG on the daily price chart, at $218.40.
The RSI on the SOL/USDT price chart reads 39 and slopes upwards. MACD flashes red histogram bars under the neutral line. The OBV indicator shows a bullish divergence, with the price heading downwards while the OBV indicator slopes upward. The divergence is typically a sign of a potential trend reversal.
In this case, the consolidation likely ends and SOL price changes in the coming week. 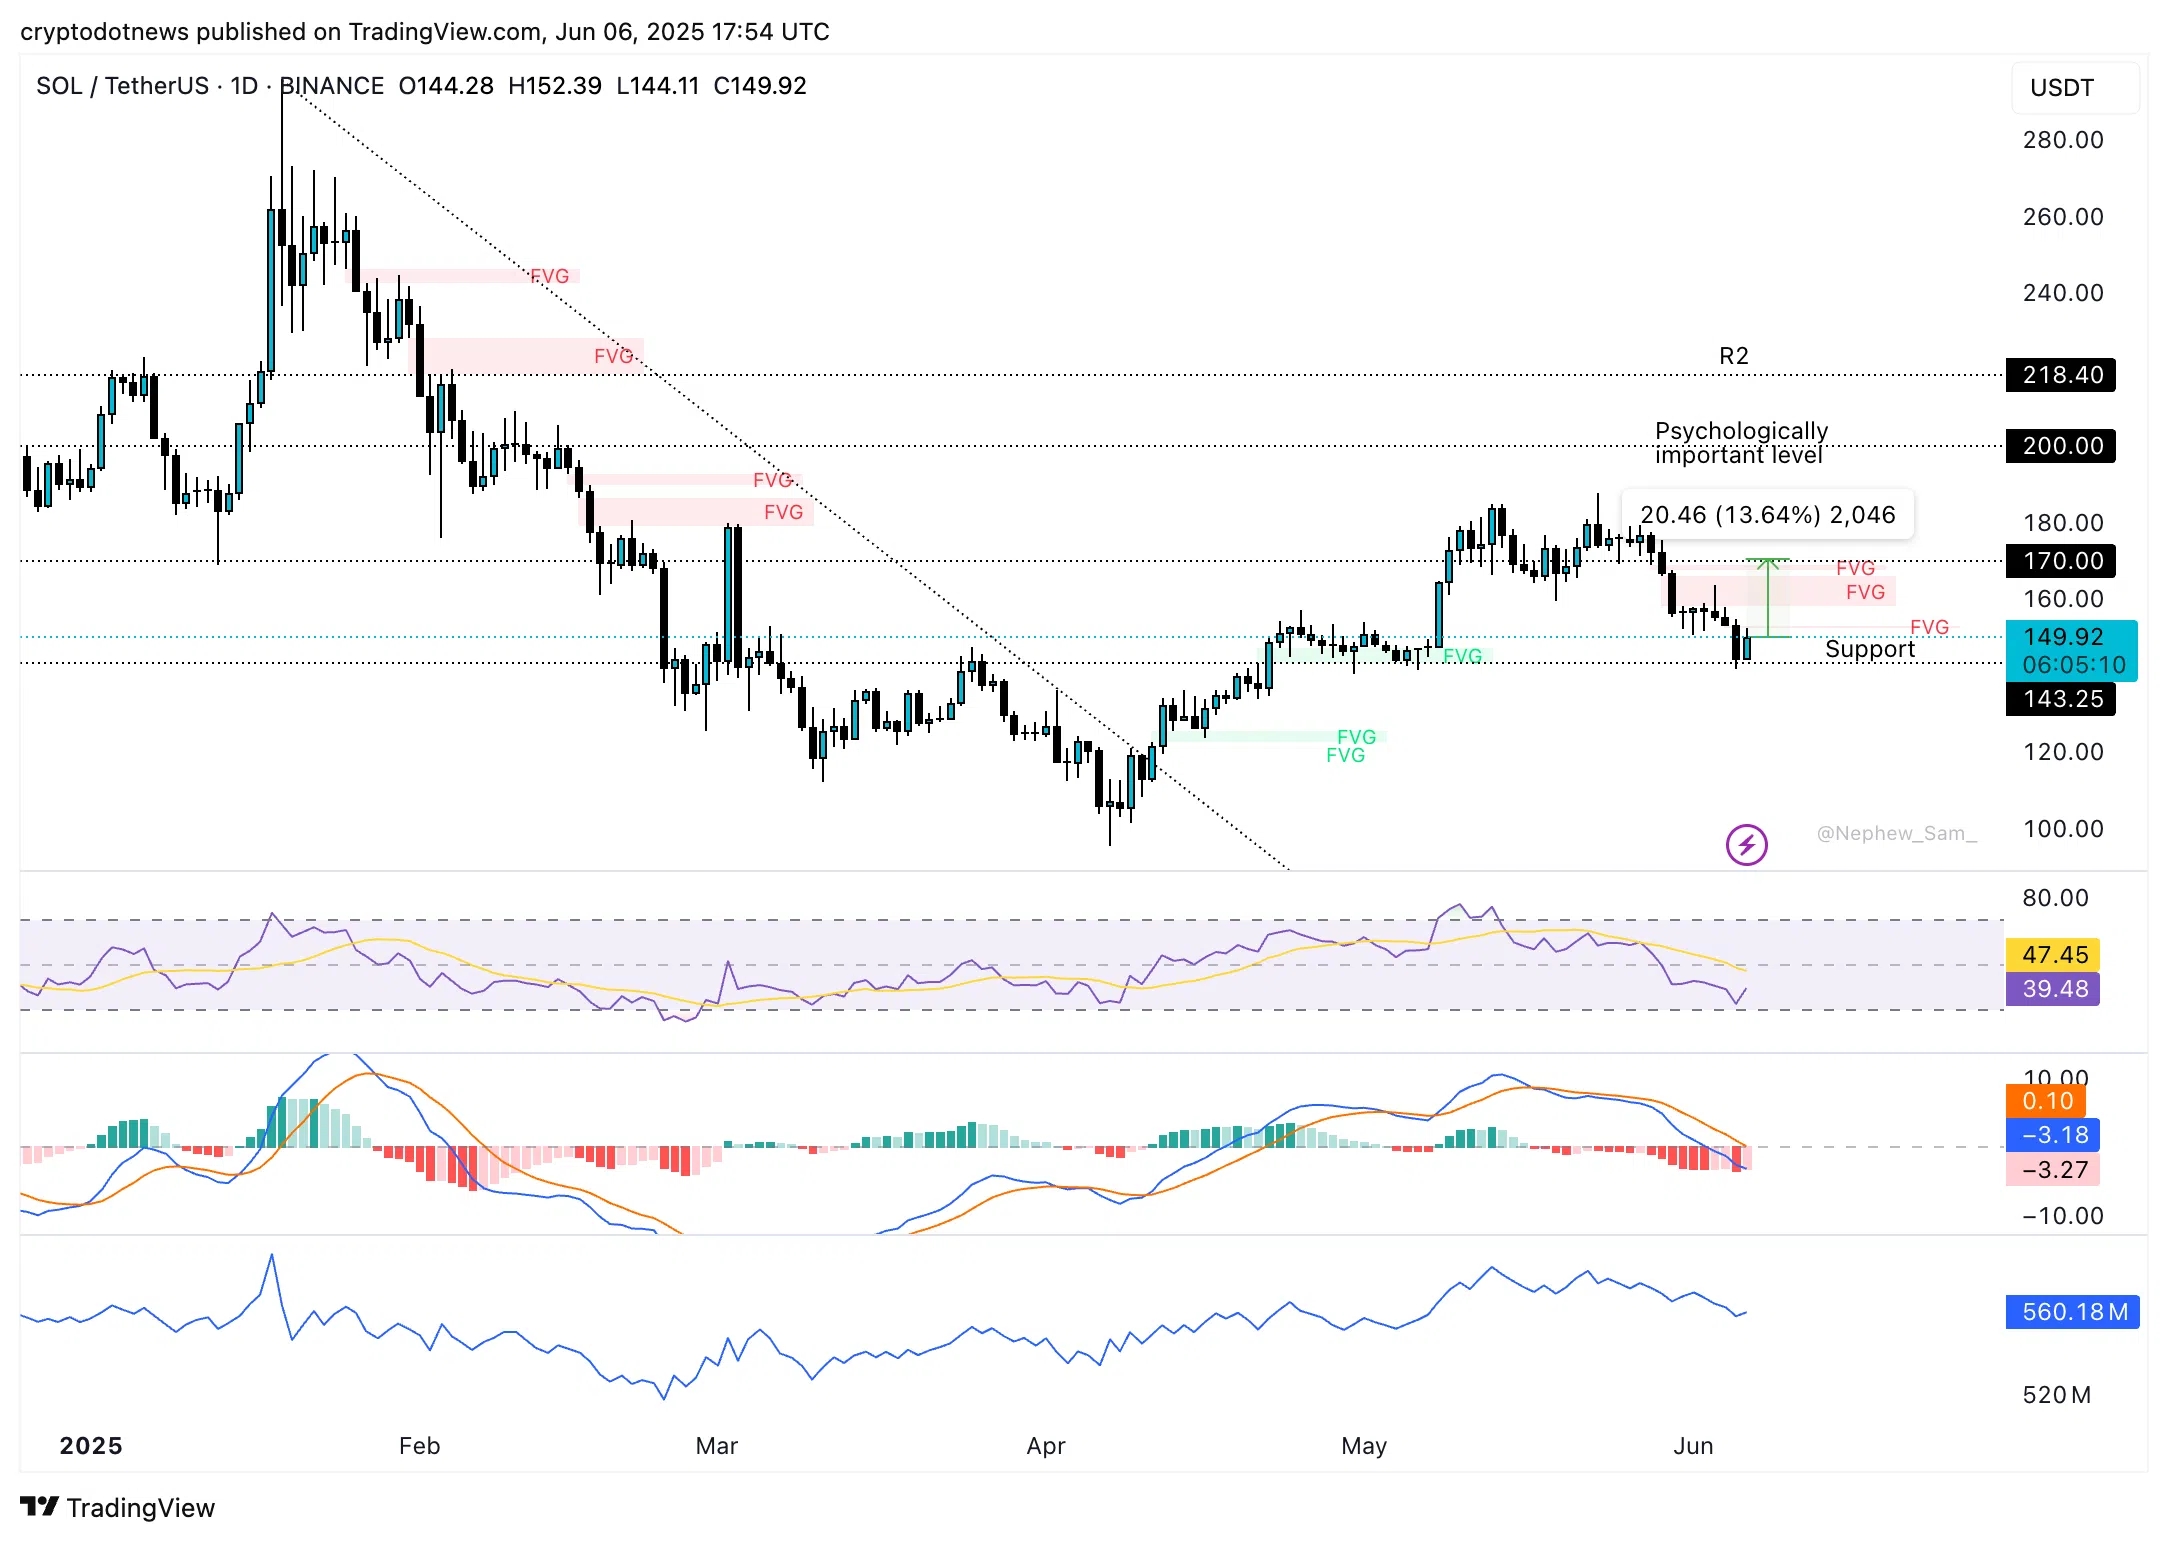
Conversely, SOL could find support at $143.25, the lower boundary of an FVG on the daily price chart.
Tutti i commenti0RecentePopolare
Nessuno storico