

Crypto Dream
06/02 07:40
Bitcoin Technical Analysis
Bitcoin Technical Analysis
BTC trades above the 50-day and the 200-day Exponential Moving Averages (EMA), reaffirming bullish momentum.
Upside Target: A breakout above $105,000 could pave the way to the record high of $111,917. A sustained move through $111,917 may bring $115,000 into play.
Downside Risk: A drop below the 50-day EMA and $100,000 could expose BTC to $95,000 and potentially the 200-day EMA.
The 14-day Relative Strength Index (RSI) at 51.1 suggests BTC has room to climb to $111,917 before entering overbought territory (RSI > 70).
Stay ahead of market trends by accessing real-time BTC price data and technical indicators here.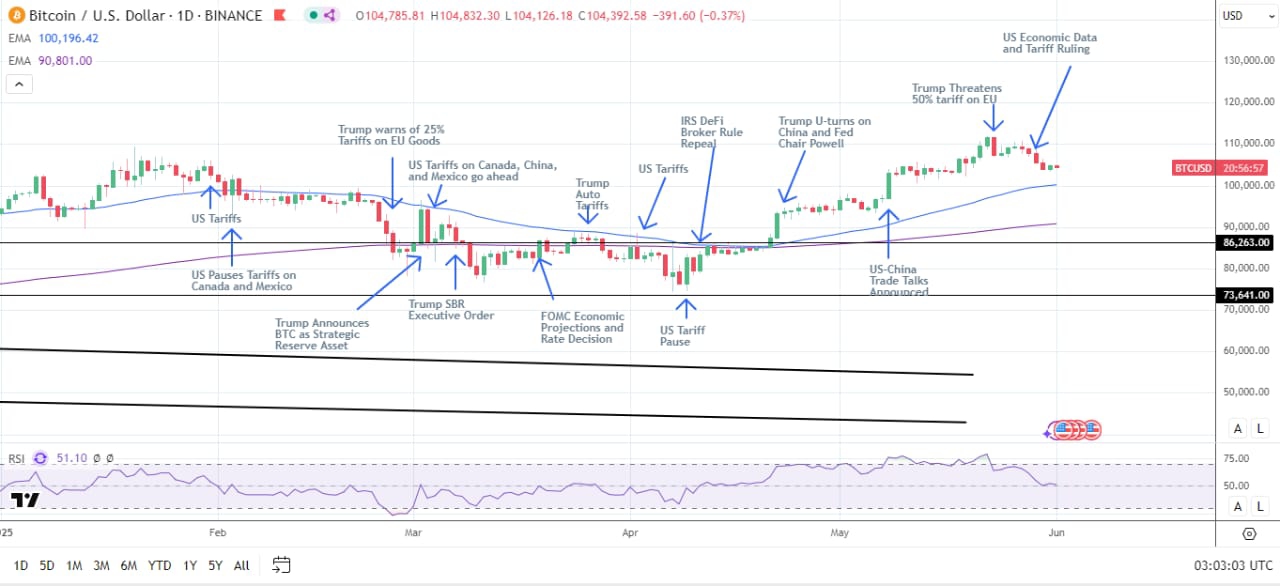
#Check In Daily, Win Prizes Daily — Join the Fun!#Picking Children's Day Token Gifts#Share Your Thoughts on Popular Assets in June
7Paylaş
Tüm Yorumlar0En yeniPopüler
Kayıt yok