Velvet [VELVET] fell 12% over the past day at press time, as mounting seller pressure forced the token lower. That decline has drained capital across the market. In the perpetual futures market, traders pulled $8.76 million, with roughly $688,940 of that tied to liquidated positions.
What comes next may not be the further slide many expect. Fractal patterns instead point to roughly two more weeks of consolidation before VELVET stages a meaningful rally or a sharper drop.
VELVET’s decline echoes a June fractal
Chart analysis shows VELVET’s recent decline mirrors a pattern that first formed between the 10th and 12th of June, when price swung sharply in both directions before settling into a 13-day consolidation.
A similar setup preceded the latest move, a rally that ran from the 26th of June to the 2nd of July, after which price entered a three-day stretch of consolidation that continues now.

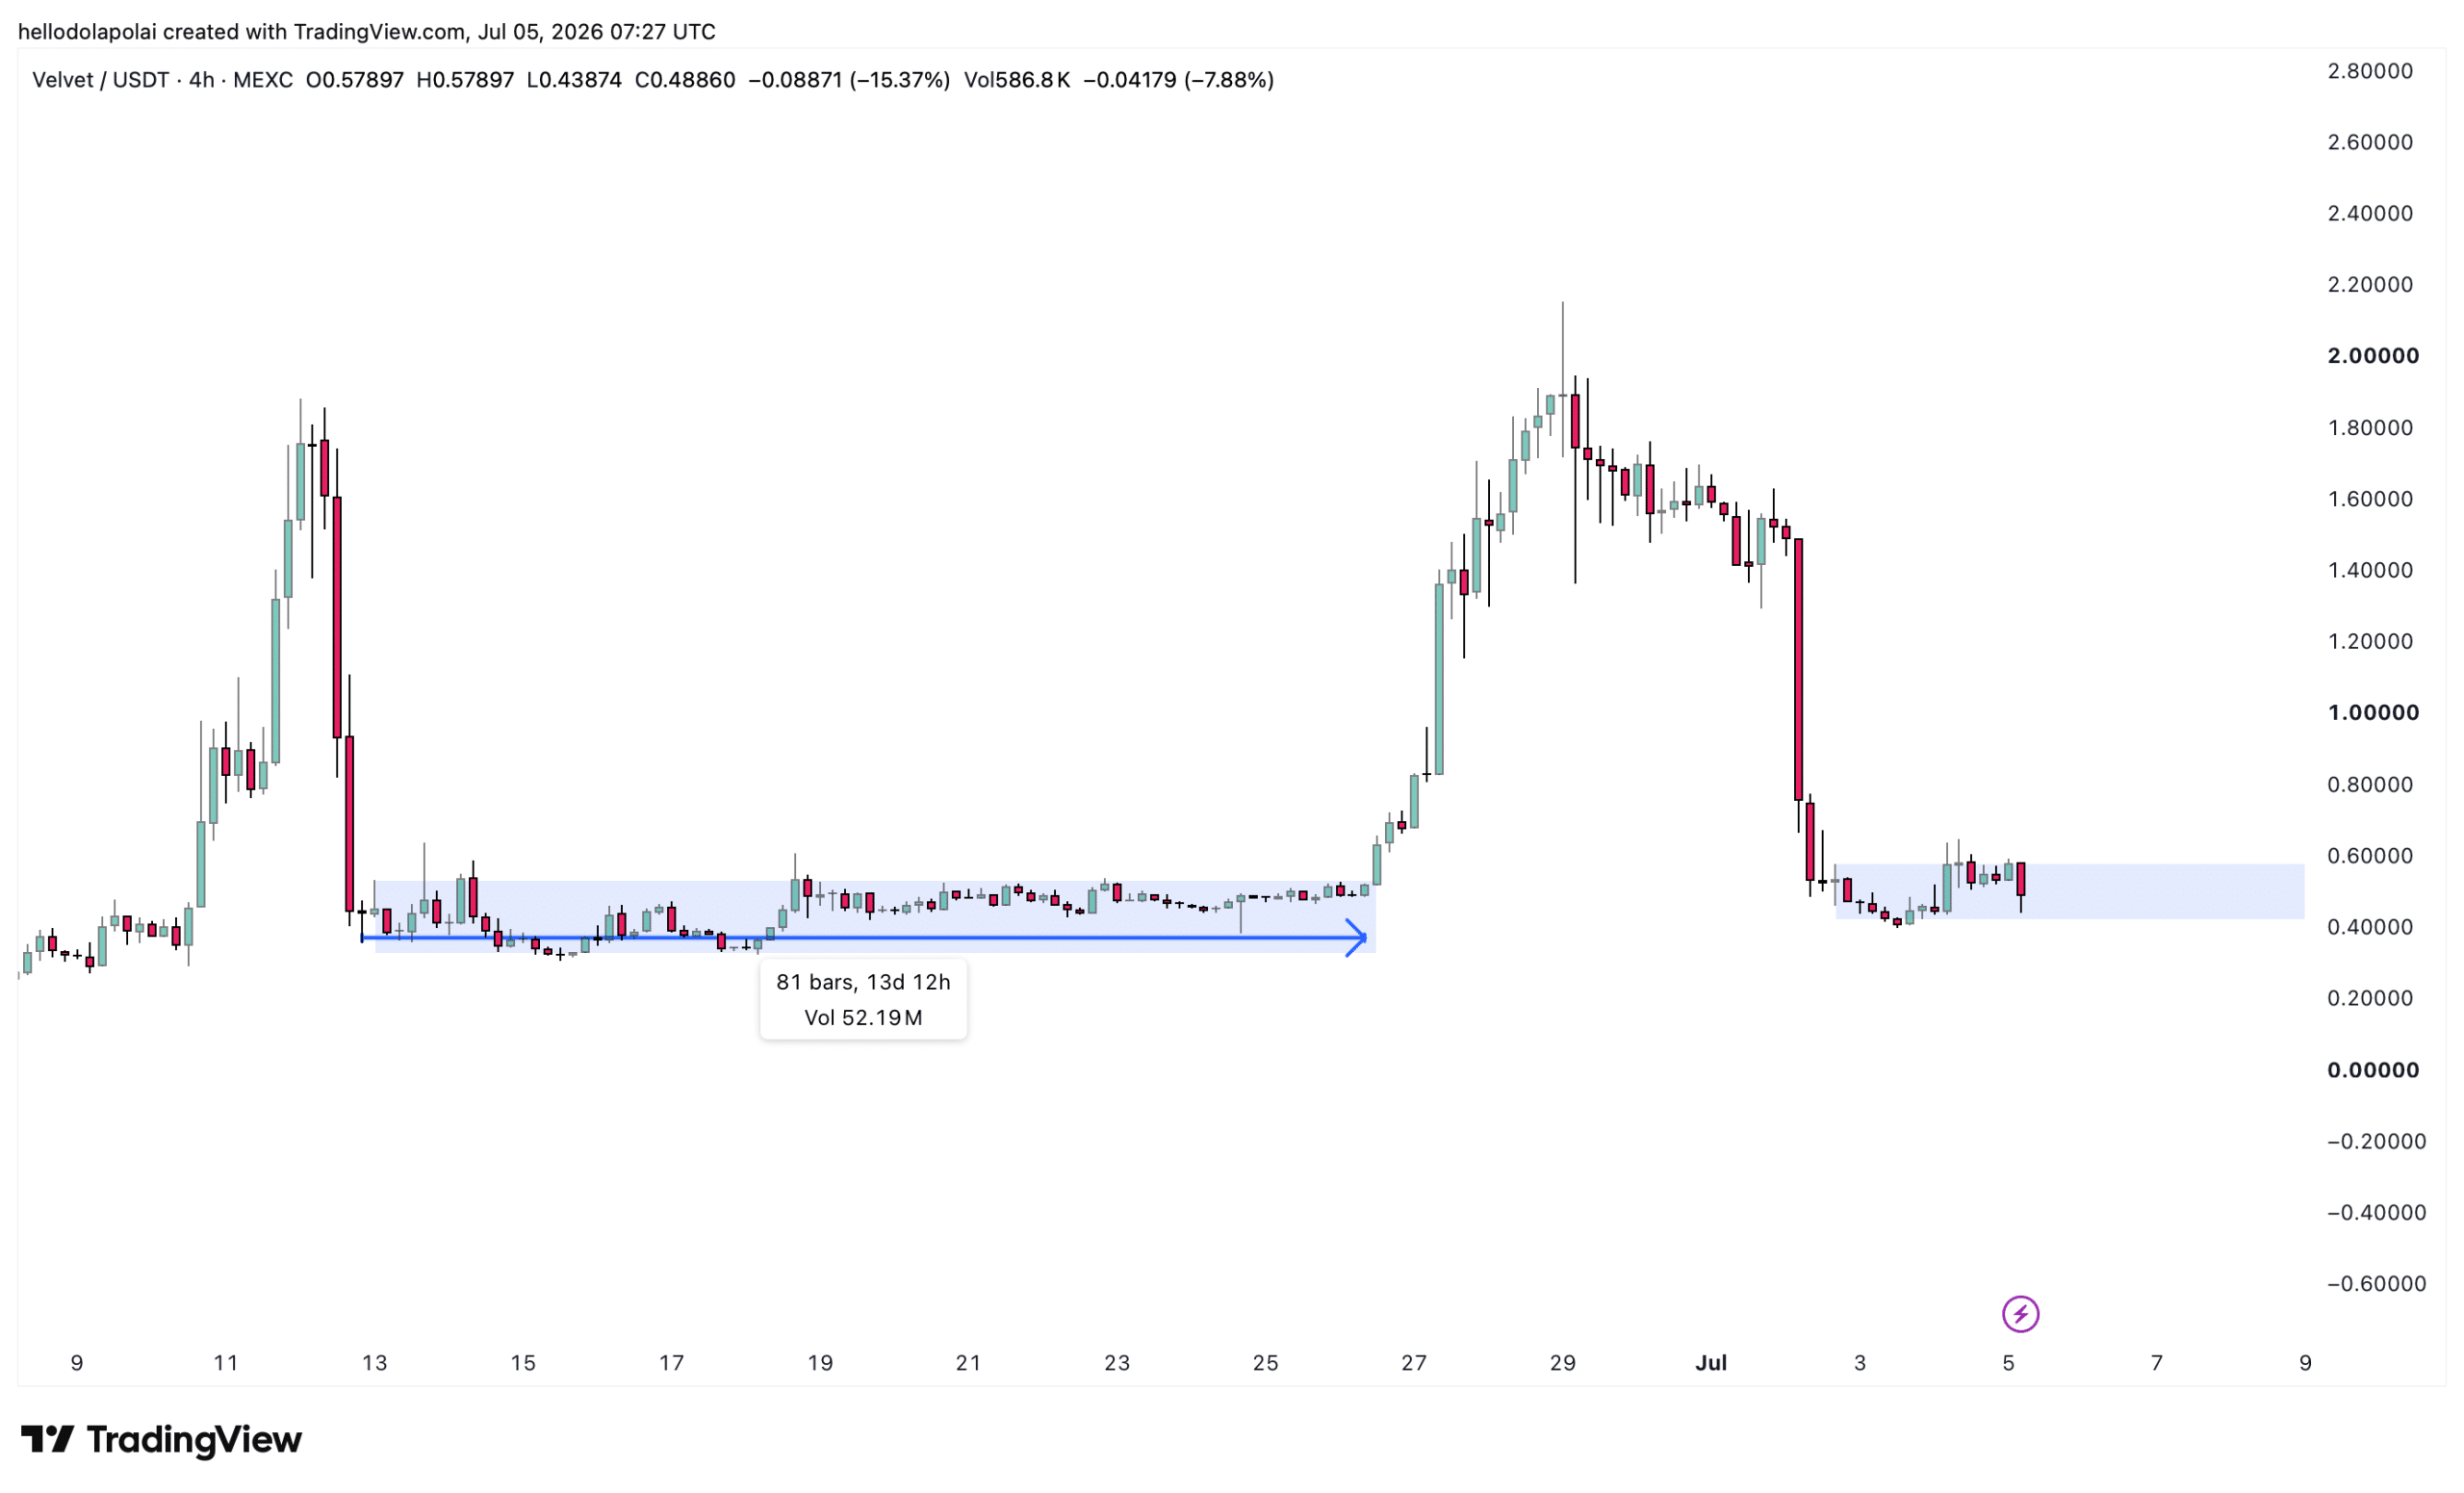
Should the pattern repeat, VELVET could keep trading inside that channel for another 11 days, a roughly two-week stretch that would pass without notable gains or losses.
Two levels frame that outlook, resistance at $0.577 above and support at $0.417 below. A decisive close above $0.577 would flip the token bullish, while a close beneath $0.417 would tip it bearish.
Indicators lean price toward a bullish break
The setup still leaves room for an extended range-bound stretch, though traders lean slightly toward a bullish run given VELVET’s current positioning.
At the time of analysis, the blue line tracking the Aroon Down kept sliding, while the orange line marking the Aroon Up climbed steadily.
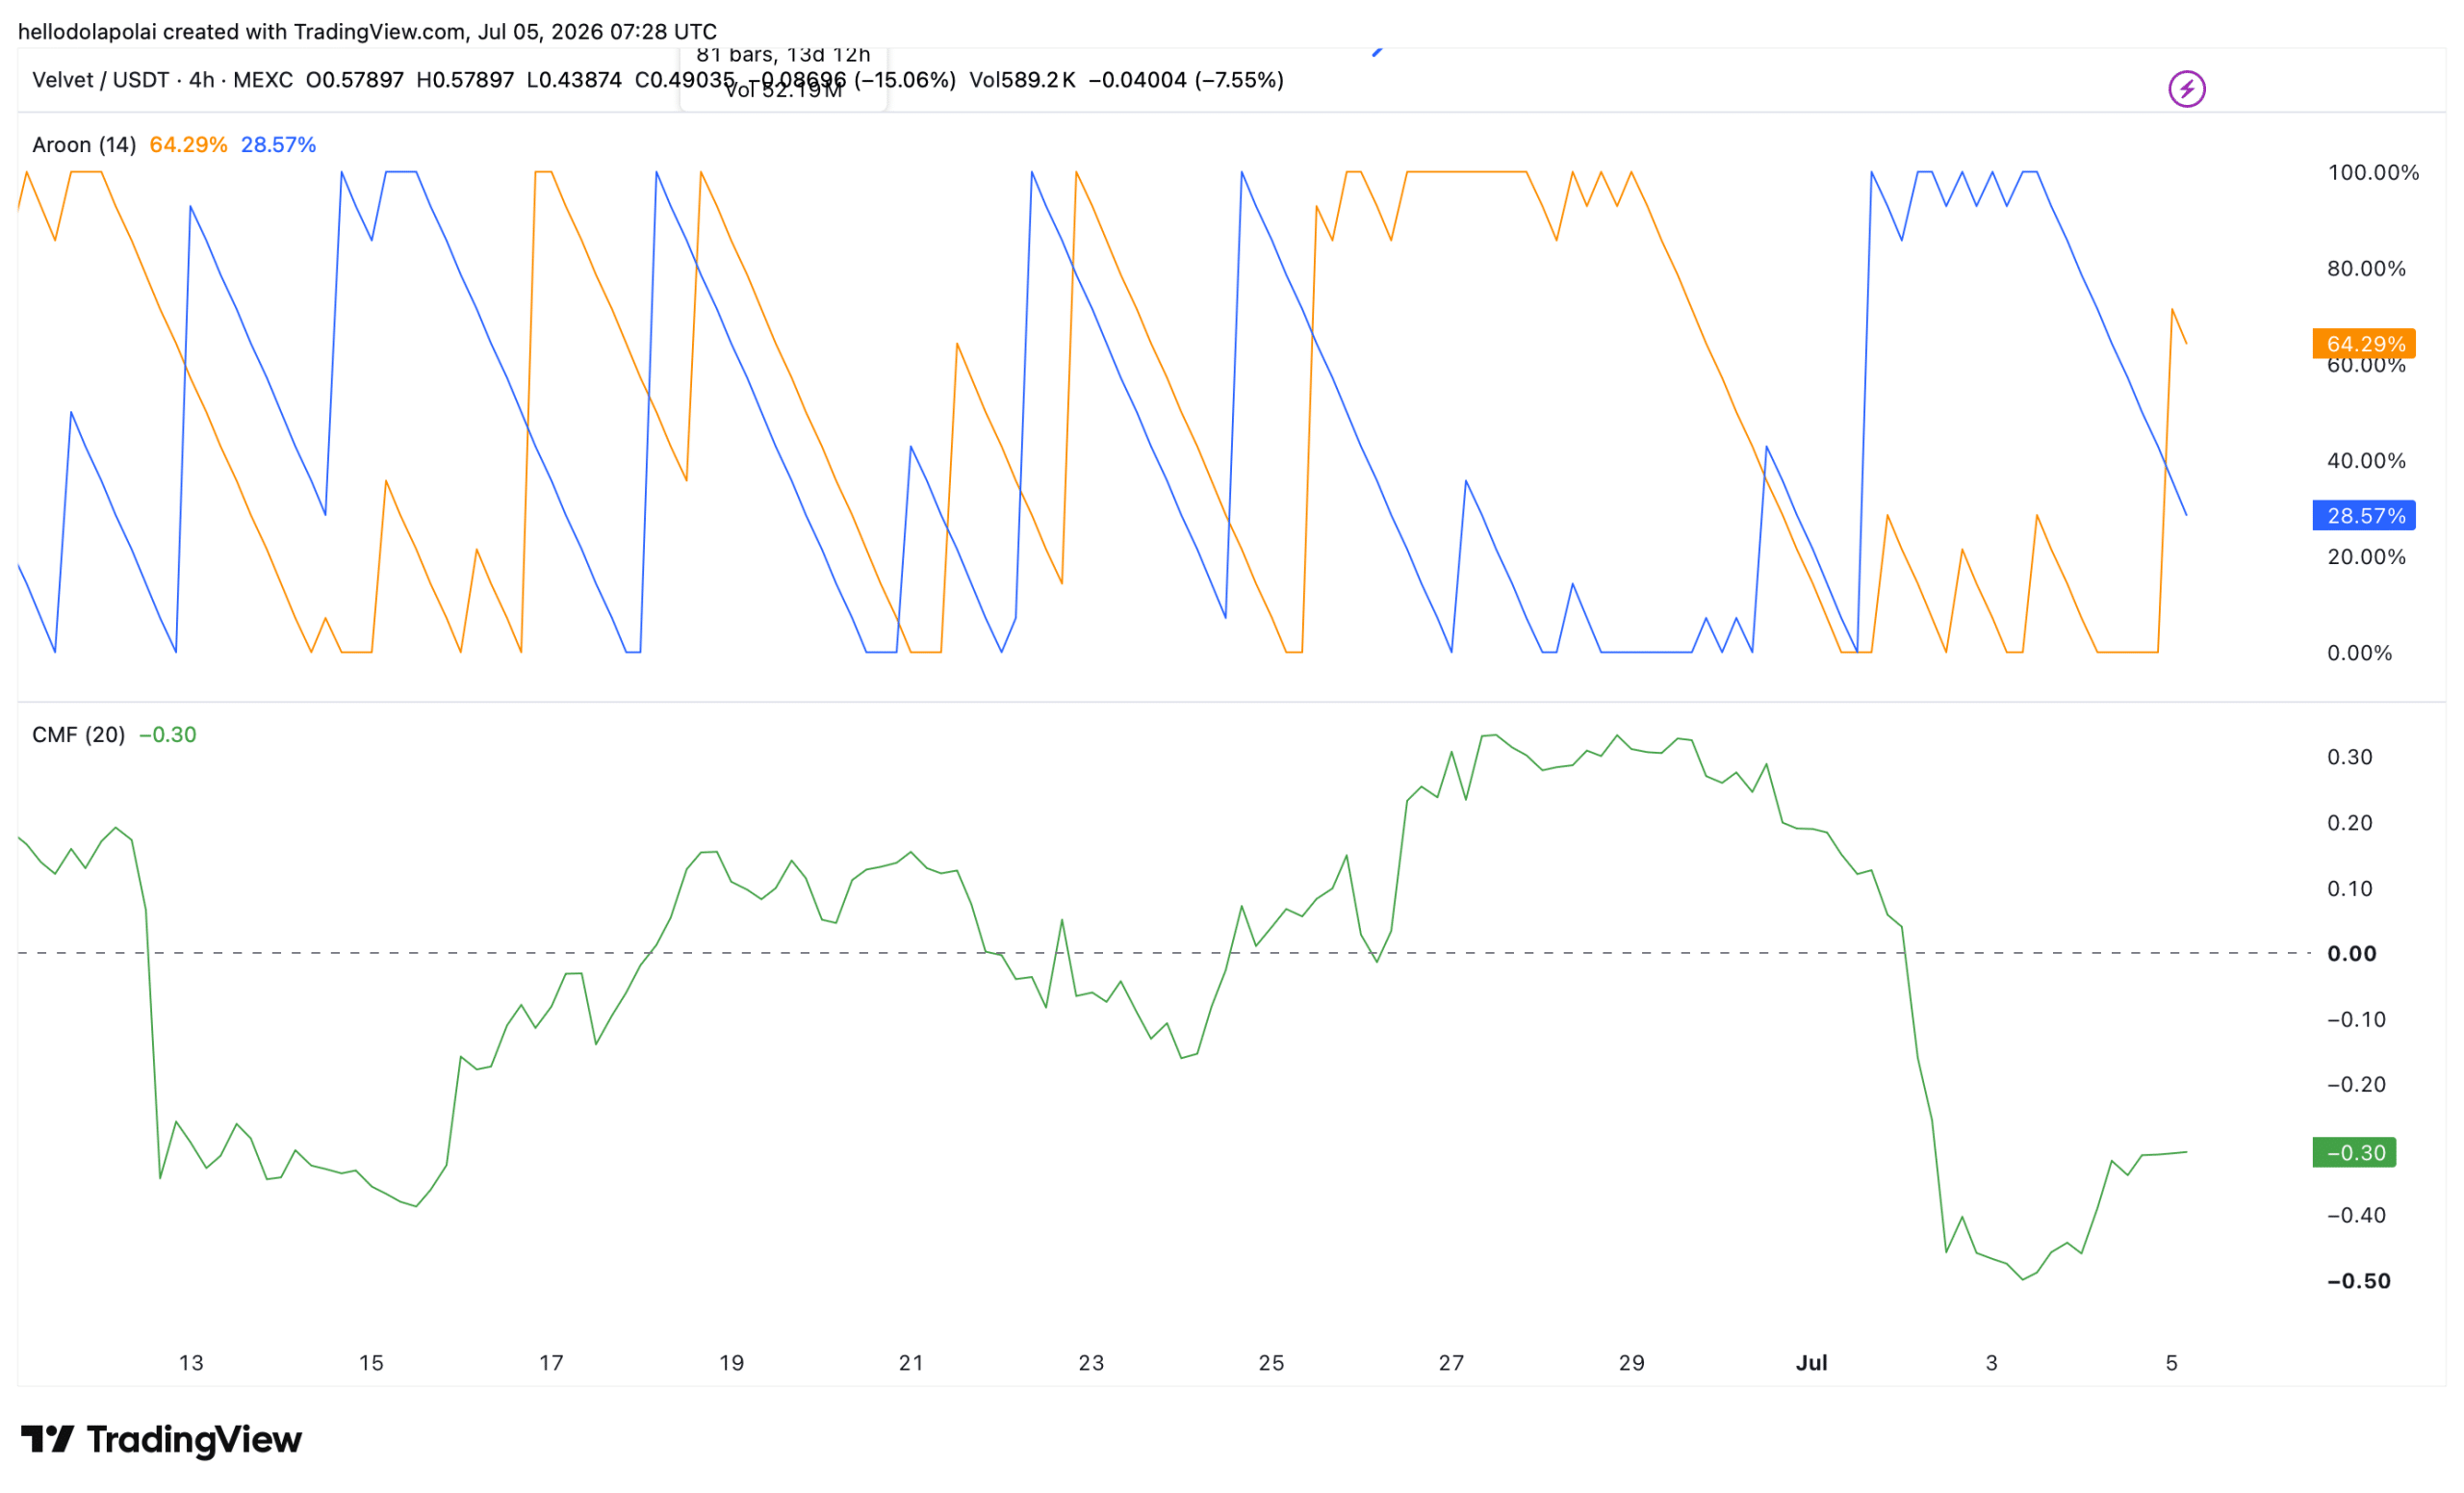

If both lines maintain their current trajectory, a bullish breakout becomes the more likely outcome. If they instead flatten and move sideways, VELVET will likely remain range‐bound.
Trading volume reinforced the trend, having tilted more toward an extended uptrend than toward consolidation or a fresh decline.
Trader sentiment holds firm
Interest in VELVET across the trading community remains elevated.
Currently, 74% of traders are voting bullish, down from the 88% peak seen in the past day. While the majority remains firmly bullish, the decline signals cooling conviction.
New traders have also entered as actual holders rather than short-term speculators. The token’s holder count on CoinMarketCap climbed to a fresh high over the past day, even as VELVET printed a new price low.
Final Summary
- VELVET fell 12% as sellers took control, draining $8.76 million from the perpetual futures market in a single day.
- Fractal patterns point to about two more weeks of consolidation, and with most traders still bullish and holder numbers at a fresh high, the slide looks more like a pause than a reversal.