USDT Supply Shrinks by $5.5 Billion While Stablecoin Turnover Hits Record High

cryptonews.ruPublicado a 2026-07-29Actualizado a 2026-07-29

Resumen

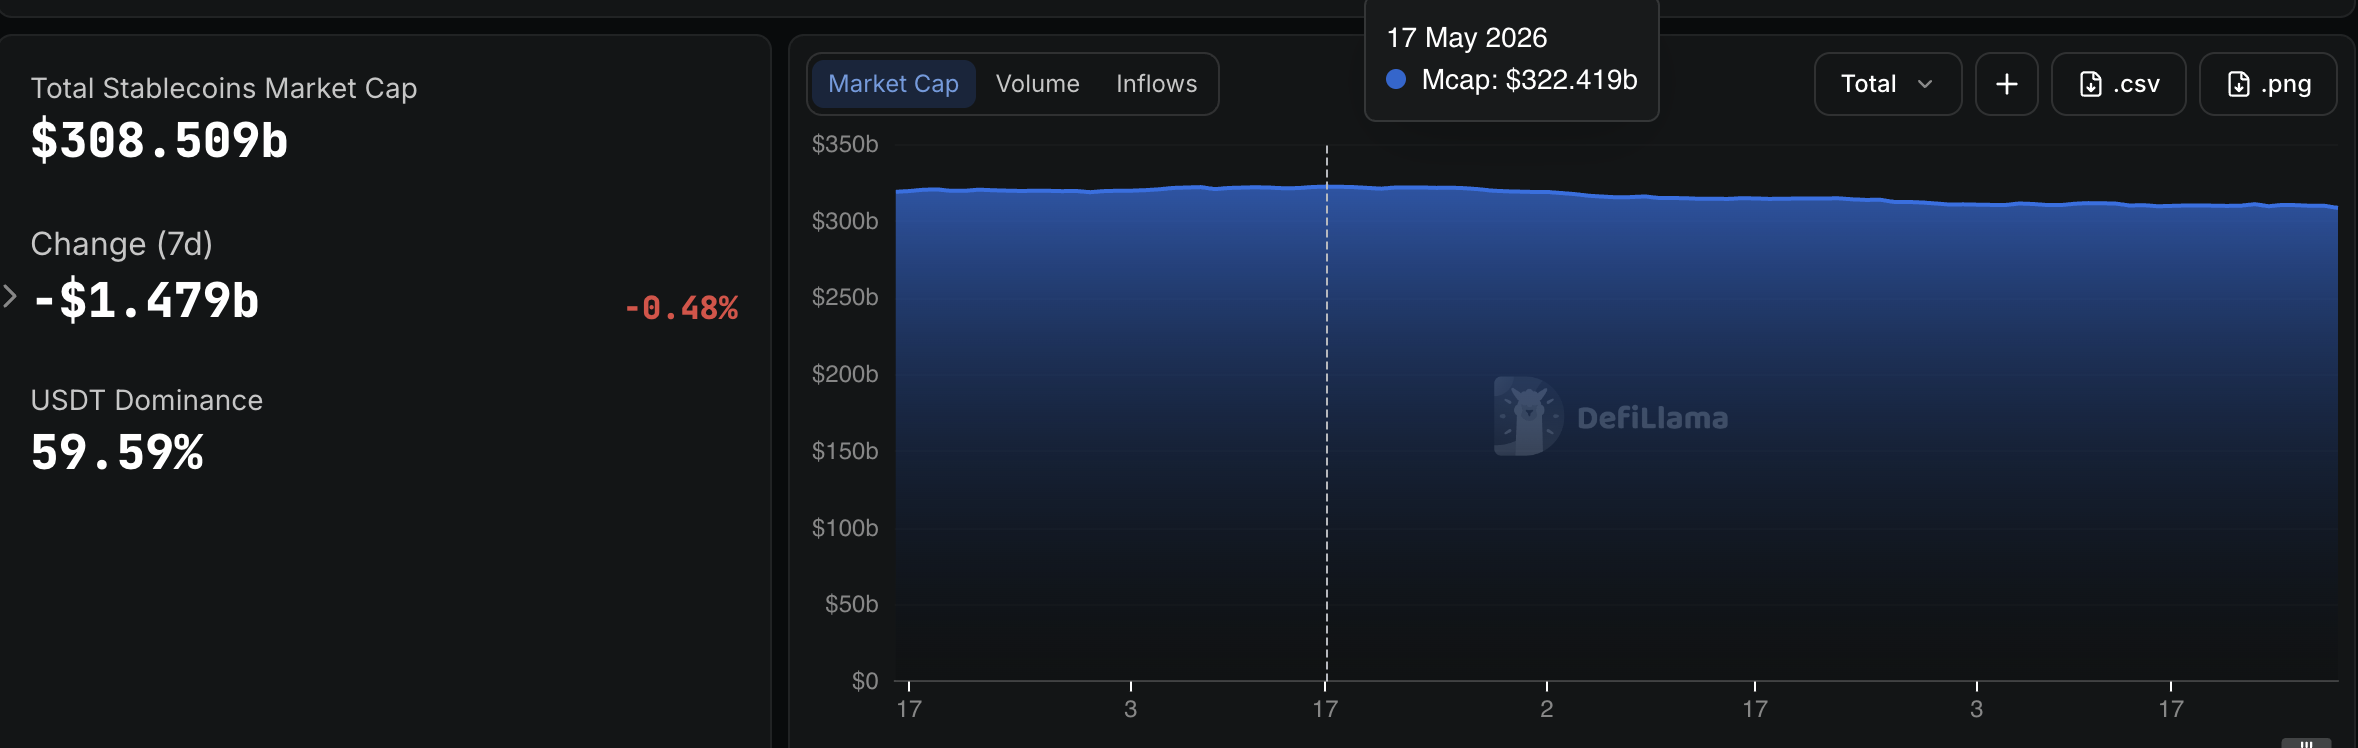
The supply of stablecoins has contracted for the first time in years, with total market capitalization falling 4.3% from its May peak to $308.5 billion. Despite this decline, June saw a record $1.83 trillion in adjusted transaction volume for stablecoins, a 60% increase from May. This divergence suggests a shift in usage patterns: less capital is sitting idle, while the remaining supply circulates more rapidly through payment and trading systems. Specifically, the supply of Tether's USDT decreased from approximately $189.54 billion to $184 billion between May 1 and July 29, while Circle's USDC supply fell from $77.27 billion to $72.41 billion. Part of this capital appears to have moved into tokenized Treasury products, a sector whose value has grown to over $16 billion, partly driven by regulations like the 2025 GENIUS Act that prohibit interest payments on payment-focused stablecoins. Transaction velocity is emerging as a key metric, with stablecoins now turning over about six times per month—double the rate from two years ago. USDC, despite having a smaller supply than USDT, processed about $1.21 trillion in adjusted volume in June, leading in settlement activity. While a significant portion of on-chain volume may not represent genuine economic payments, identifiable real-world payments have grown sharply, reaching an estimated $390 billion in 2025. The data indicates stablecoins are evolving from static collateral into active financial infrastructure.

The total supply of stablecoins has declined for the first time in years, but this decrease may not indicate as much about demand as it seems.

The overall market capitalization has fallen by approximately 4.3% from its May peak of $322.41 billion to $308.5 billion. In June alone, the drop amounted to $7.7 billion—the most significant monthly decline since the Terra crash in May 2022.
Source: Defillama

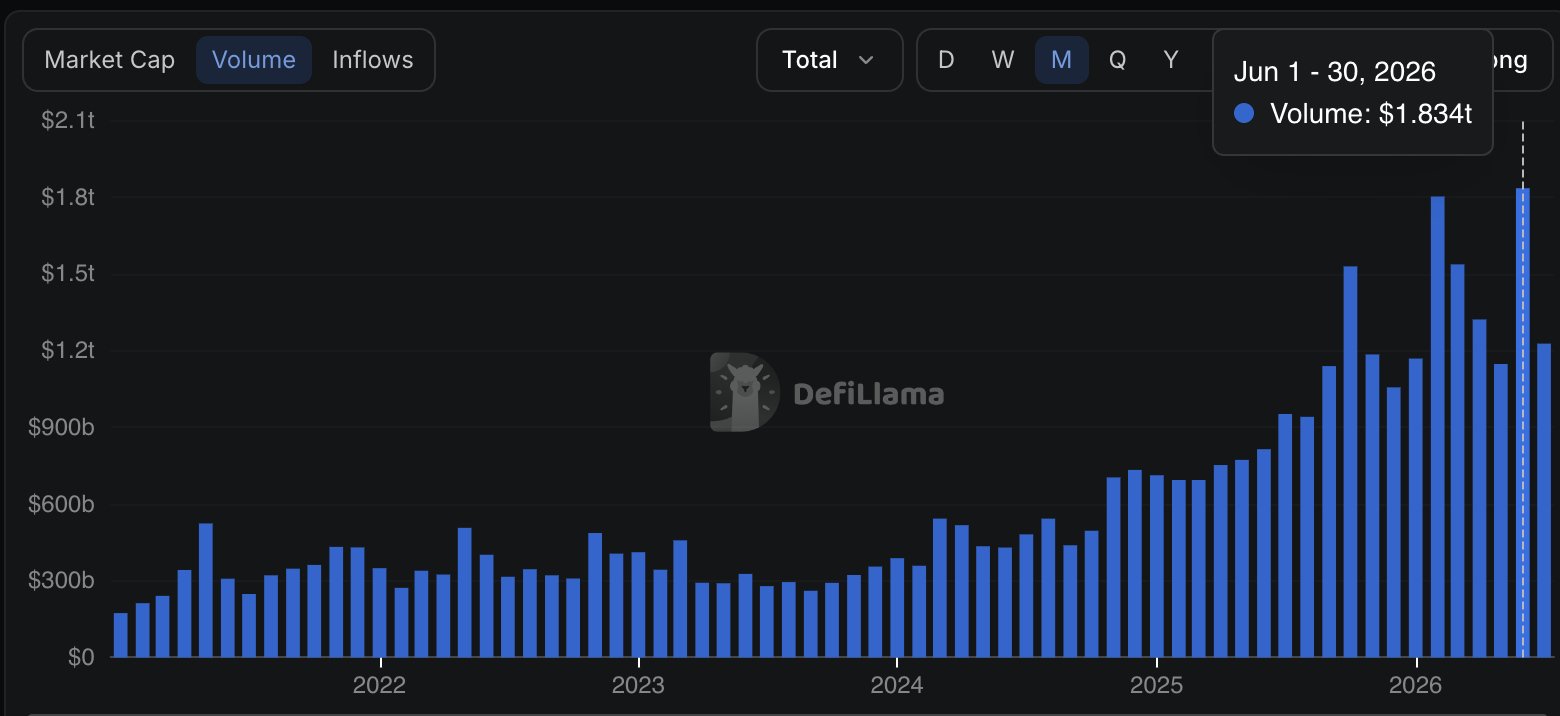
At the same time, the adjusted transaction volume for stablecoins reached a record $1.83 trillion in June. This is 60% higher than May's figure and more than double the level recorded a year ago.

This discrepancy points to a change in the nature of stablecoin usage. Fewer dollars are sitting idle, while the remaining supply is moving faster through payment, trading, and settlement systems.
Source: Defillama

Idle Balances Move to Yield-Bearing Assets

The supply of $USDT by Tether decreased from $189.54 billion as of May 1 to approximately $184 billion as of July 29. Over the same period, the supply of $USDC by Circle dropped from $77.27 billion to $72.41 billion. This reduction remains moderate compared to the market's 26% crash in 2022.

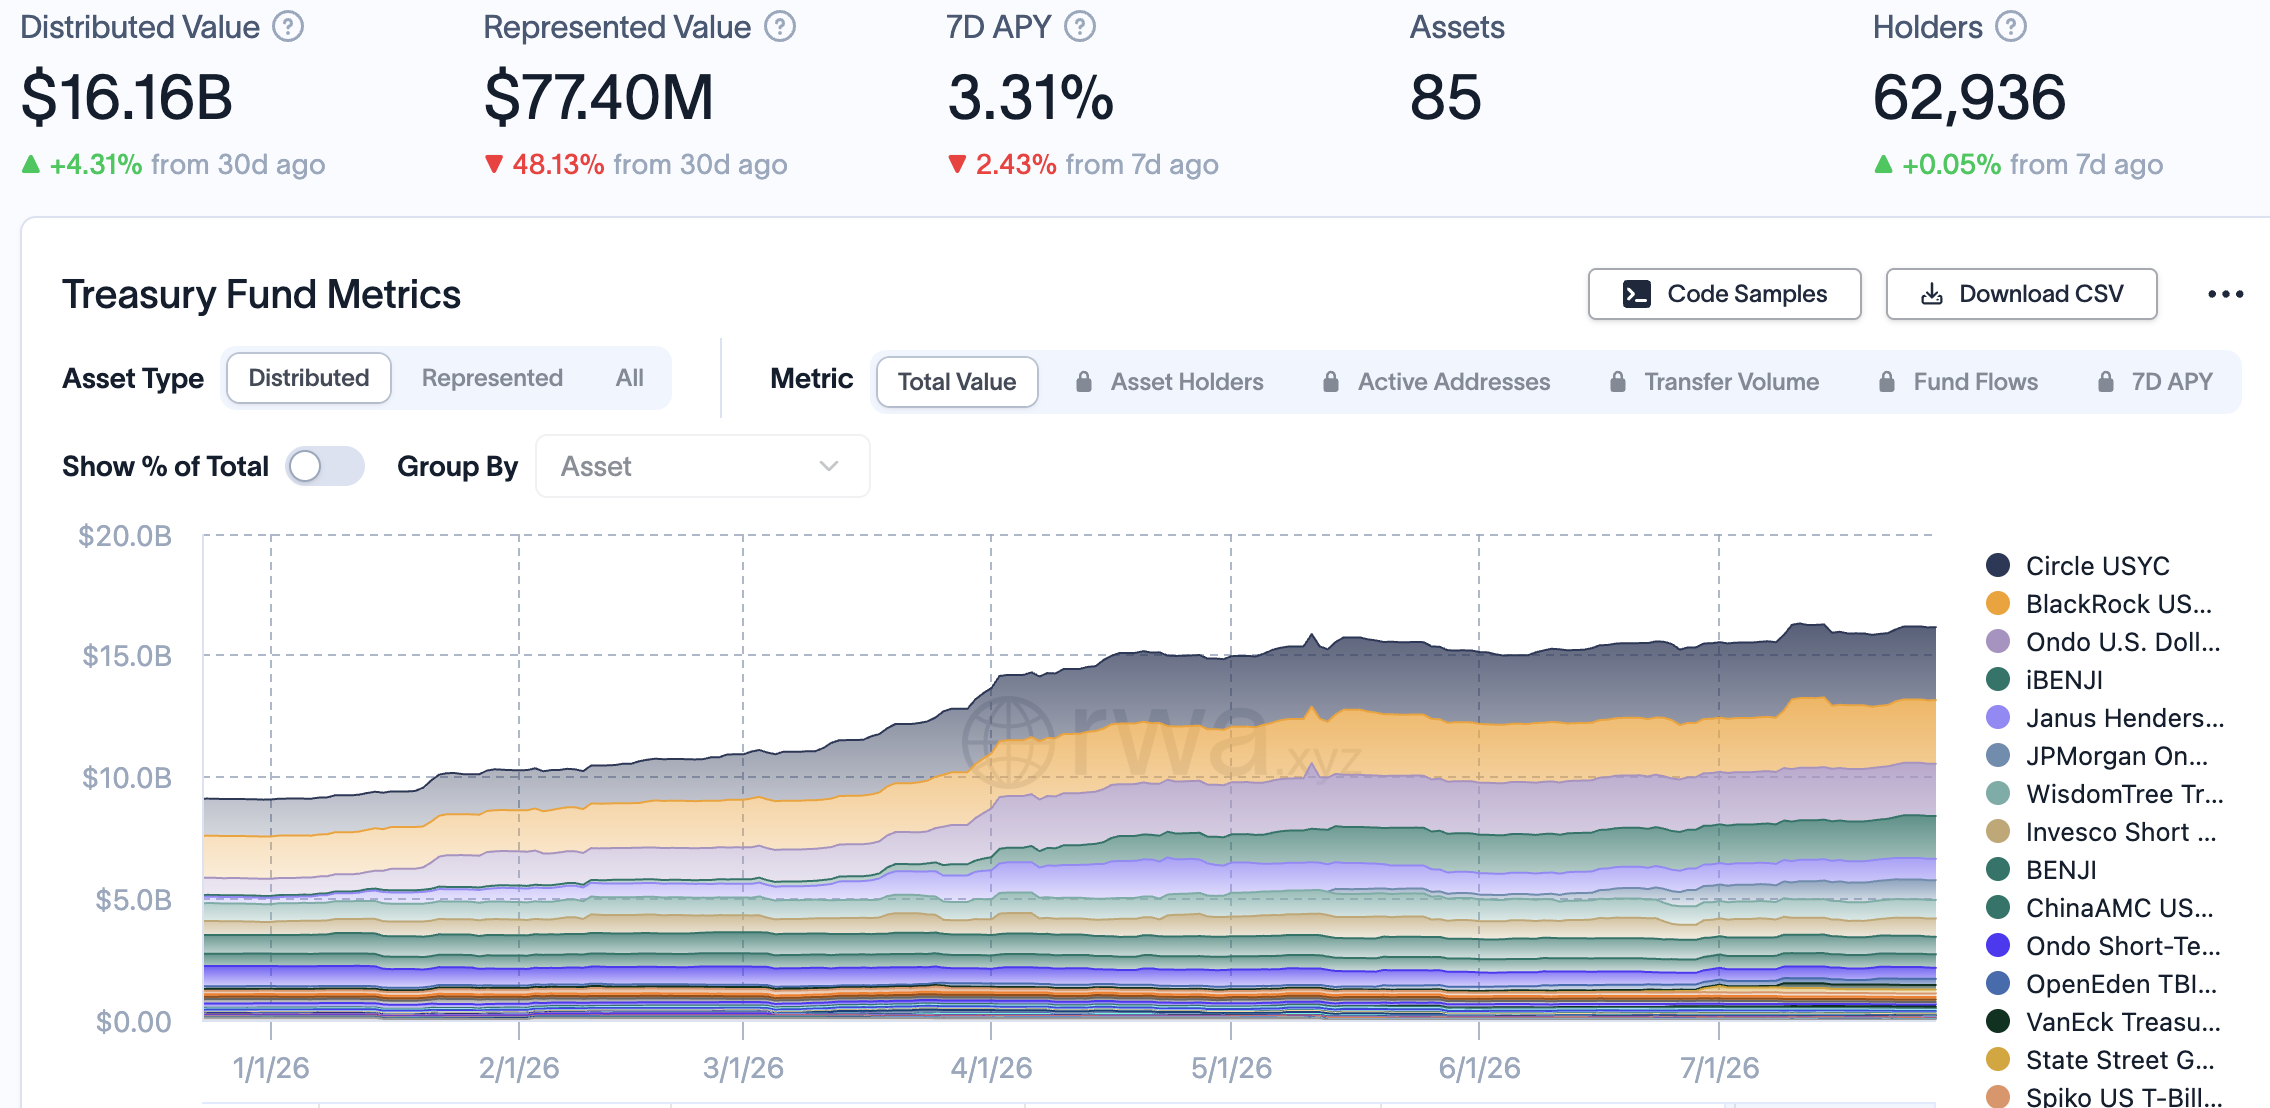
Apparently, some capital has flowed into tokenized Treasury products, which offer yields not available for payment stablecoins. According to rwa.xyz, the volume of this sector has grown to over $16 billion compared to roughly $11 billion in March.
Source: rwa.xyz

The GENIUS Act, signed in July 2025, prohibits issuers from paying interest directly on payment stablecoins. This structure encourages treasurers to keep savings in tokenized funds, holding stablecoins only when payments need to be made.

Turnover Velocity Replaces Market Cap as Key Metric

According to a Standard Chartered report from March 2026, stablecoin turnover is now about six times per month. This is roughly double the rate from two years ago. Visa data also shows that each dollar in a stablecoin moves much more frequently than a dollar stored in an ordinary U.S. bank account.

$USDC has become the leading settlement asset, despite its supply being smaller than that of $USDT. In June, it processed about $1.21 trillion in adjusted volume, compared to $576 billion for $USDT.

However, not all blockchain transfers represent real economic payments. Automated activity, exchange transfers, and wash trades can inflate the raw figures.

According to a Forbes report, estimates by McKinsey and Artemis suggest that identifiable real-world payments accounted for about $390 billion in 2025. Business-to-business transactions made up $226 billion, while payroll and remittance payments were approximately $90 billion.

The share of payments is still small but has grown sharply over two years.

Stablecoin market capitalization still matters, as issuers earn interest on reserves. However, for networks, processors, and financial platforms, transaction frequency may become a more valuable metric. June data indicates that stablecoins are transforming from 'frozen' collateral into active financial infrastructure.


Preguntas relacionadas

QAccording to the article, what is the key change in the nature of stablecoin usage indicated by the data?

AThe data indicates a change in the nature of stablecoin usage: fewer dollars are sitting idle, while the remaining volume is moving faster through payment, trading, and settlement systems. This is shown by the supply shrinking while transaction turnover hits a record high.

QWhat is one major reason suggested in the article for the migration of capital away from payment stablecoins like USDT and USDC?

AOne major reason is the flow of capital into tokenized Treasury products, which offer yields not available to payment stablecoins. This was further encouraged by the GENIUS Act signed in July 2025, which prohibits issuers from paying interest directly on payment stablecoins.

QWhy does the article suggest that transaction turnover (velocity) is becoming a more valuable metric than market capitalization for certain entities?

AFor networks, processors, and financial platforms, the frequency of transactions (turnover velocity) may become a more valuable metric than market capitalization because it reflects active usage and utility within the financial infrastructure, rather than just stored value.

QWhich stablecoin processed a higher adjusted transaction volume in June, USDT or USDC, despite having a smaller supply?

AUSDC processed a higher adjusted transaction volume in June (approximately $1.21 trillion) compared to USDT ($576 billion), even though USDC's supply is smaller than that of USDT.

QWhat does the article cite as a potential factor that can inflate raw on-chain transaction figures?

AThe article states that automated activity, exchange transfers, and wash trading can inflate the raw on-chain transaction figures, meaning not all blockchain transfers represent real economic payments.

Lecturas Relacionadas

Cardano Price Forecast for August 2026: Will ADA Triangle Breakout Happen Before or After the CLARITY Act Deadline?

Cardano (ADA) is trading at $0.1642, testing the apex of a symmetrical triangle pattern on the daily chart, which signals an impending directional move. Technical analysis identifies key resistance at the 20-day EMA ($0.1650) and the triangle's upper trendline. A breakout above could target the 50-day EMA at $0.1732, with a cup-and-handle pattern potentially forming. Support lies at the SuperTrend indicator ($0.1536) and the June low of $0.1386. Historically, August has been a weak month for ADA, with a median return of -12.8%. A weekly forecast outlines a volatile month influenced by the imminent August 8th deadline for the U.S. CLARITY Act vote, potential SEC regulatory action, and renewed geopolitical tensions following Iran's missile strike. Key bullish catalysts include the potential passage of the CLARITY Act and a major upgrade integrating Cardano's developer documentation and tools into AI coding assistants like Claude, which could significantly boost developer adoption. On-chain data also shows whale accumulation, a potential Wyckoff accumulation signal. The price forecast presents two scenarios: a bullish breakout above $0.1650 targeting $0.17-$0.1732 if the CLARITY Act passes and AI integration fuels momentum, or a bearish break below $0.1536 toward $0.1386 if the bill fails, seasonal weakness persists, and risk appetite diminishes.

cryptonews.ruHace 8 min(s)

Cardano Price Forecast for August 2026: Will ADA Triangle Breakout Happen Before or After the CLARITY Act Deadline?

cryptonews.ruHace 8 min(s)

Coinbase Vice President: The Wars Over Cryptocurrency Regulation Are Over

Coinbase's new Vice President, Ryan VanGrak, declared that regulatory wars in the cryptocurrency sector are over. Since taking office on July 9, 2026, he has shifted the company's approach from litigation and sanctions to focusing on growth and innovation. The industry can now concentrate on development rather than fighting for its right to exist. He highlighted that the Digital Asset Market Clarity Act (CLARITY Act), which aims to establish a clear federal regulatory framework dividing oversight between the SEC and CFTC, has gained significant momentum. This framework is intended to provide proper supervision, investor protection, and maintain U.S. leadership in digital assets. VanGrak's appointment marks a strategic shift from a "wartime" to a "peacetime" advisor, replacing former Chief Legal Officer Paul Grewal, who oversaw major litigation, including a dismissed 2023 SEC lawsuit. With his background at Citadel Securities and the SEC, VanGrak brings deep regulatory and institutional finance expertise as Coinbase expands beyond a simple exchange into a broader financial services provider, offering stocks, futures, prediction markets, and AI tools. For investors, bipartisan support for crypto legislation like the CLARITY Act represents a major shift from the enforcement-focused environment of 2023-2024. Lawmakers are now focused on *how* to regulate crypto, not *if* it should exist. However, risks remain, as the bill's passage is not yet guaranteed.

cryptonews.ruHace 59 min(s)

Coinbase Vice President: The Wars Over Cryptocurrency Regulation Are Over

cryptonews.ruHace 59 min(s)

Deep Dive into FWA: An Intriguing Experiment Turning NFTs into "On-Chain Gachapon"

A Deep Dive into FWA: The “On-Chain Gacha” Experiment for NFTs Fake World Assets (FWA), created by TokenWorks, introduces an innovative “NFT gacha machine” fully operating on-chain. Users can deposit eligible NFTs paired with ETH (called Backing) to create a Position, acting as a prize pool. Others can then pay a uniform Acquisition Price for a chance to win a random NFT from the pool. The core mechanism features a reverse probability system: Positions with lower Backing have a higher chance of being selected, serving as common prizes, while high-Backing Positions are rare “jackpots.” The acquisition price is calculated based on the harmonic mean of all Backings, keeping entry costs low. When a Position is won, the purchaser must choose: keep the NFT or accept the Standing Bid (85% of the Backing, claimable in ETH or $FWA tokens), returning the NFT to the original depositor. The protocol involves two main roles. Depositors provide liquidity (NFT + ETH), earning a share of fees from each draw, distributed equally per active Position, plus potential $FWA rewards. Purchasers pay to spin the gacha, receiving $FWA rewards for participation. A special “Crown” reward goes to the Position with the highest Backing. The $FWA token has a fixed supply and is initially obtainable only through protocol participation (depositing or purchasing), with external buying disabled early on to reduce sell pressure. Its value is supported by a built-in buy pressure: when purchasers opt for the $FWA settlement on a Standing Bid, the protocol uses the backing ETH to buy $FWA from the market. Revenue for the protocol comes from a 1% fee on each draw, a 1% settlement fee when an NFT is kept, and the 15% discount from Standing Bid settlements (currently allocated to the protocol). The design cleverly blends Uniswap-style liquidity provision, gacha mechanics, and tokenomics to create a novel, self-regulating marketplace for NFT liquidity and engagement.

marsbitHace 1 hora(s)

Deep Dive into FWA: An Intriguing Experiment Turning NFTs into "On-Chain Gachapon"

marsbitHace 1 hora(s)

Trading

Spot
活动图片