US Stocks Surge 16% in Two Months: Only 4 Occurrences in History, the Most Recent Was Just Before the 1987 Crash

marsbitPublicado a 2026-06-03Actualizado a 2026-06-03

Resumen

U.S. stocks have surged 16% over April and May, a gain seen only four times since WWII, according to Deutsche Bank strategist Henry Allen. Three prior instances followed recessions, but the sole non-recession precedent was in early 1987, months before the "Black Monday" crash. The current rally is underpinned by AI enthusiasm and strong data, but its speed without an economic recovery is historically unprecedented. Meanwhile, credit spreads remain near record lows despite growing consumer strain—the U.S. savings rate hit just 2.6% in April, a level last seen before the Global Financial Crisis, and consumer sentiment is at its lowest since 1952. Market risks are concentrated. While stocks and credit markets appear immune to geopolitical tensions, sovereign bonds tell a different story. Treasury yields have tracked oil prices and recently hit multi-year highs, creating a widening divergence with equities. Surprisingly stable oil prices, despite the prolonged closure of the Strait of Hormuz, have been a key pillar for risk assets. However, if the blockage persists, this support could fade, raising the risk of a stagflation shock not currently priced in.

Original Author: Zhao Ying

Original Source: Wall Street News

The recent strong rally in U.S. stocks is triggering historical alarms. The S&P 500 index has accumulated a 16% gain from April to May, a magnitude of increase that has occurred only 4 times since World War II. Three of those instances happened during recovery phases following economic recessions. The sole precedent not in a post-recession context occurred just months before the "Black Monday" crash in 1987.

Deutsche Bank macro strategist Henry Allen points out that the current rally is not taking place against a backdrop of post-recession recovery, making the historical comparison particularly stark. Meanwhile, credit spreads remain at historically low levels, but pressure signals from the consumer side are accumulating, expectations for Federal Reserve interest rate hikes are heating up, and the divergence between sovereign bond markets and stock markets continues to widen.

With multiple risk factors converging, market tail risks are becoming exceptionally concentrated. Henry Allen wrote in the report, "The tail risks in the current distribution are exceptionally prominent, both at the geopolitical level and at the market level."

Historical Precedents Are Rare, Only One Non-Recession Example Exists

The S&P 500's two-month gain of 16% from April to May has only 4 precedents since WWII.

Three of them occurred during powerful rebounds following recessions: the post-COVID-19 recovery from April to May 2020, the post-global financial crisis rebound from March to April 2009, and the recovery rally following the first oil crisis from January to February 1975.

The 4th instance was from January to February 1987. That was just months before October's "Black Monday" — the day the S&P 500 plunged 20% in a single session.
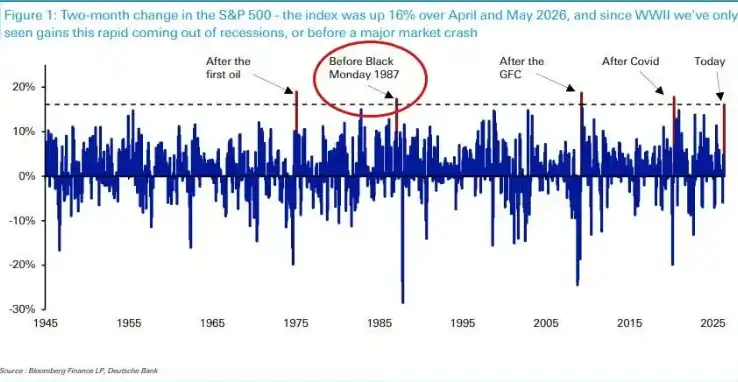
Henry Allen emphasizes that the current rally has its fundamental support, including high enthusiasm for artificial intelligence and strong economic data, but "the pace of gains itself has broken all recent precedents." In an economy not emerging from a recession, a rebound of this speed has never ended well in history.

Furthermore, the S&P 500 is on track to achieve its fourth consecutive year of double-digit gains, a record not seen since the late 1990s.

Excessive Optimism in Credit Markets, Consumer Pressure Signals Overlooked

The strength in equities has also spread to credit markets. Credit spreads in both the US and Europe are currently narrower than before the US-Iran conflict erupted, showing the market's high tolerance for risk.

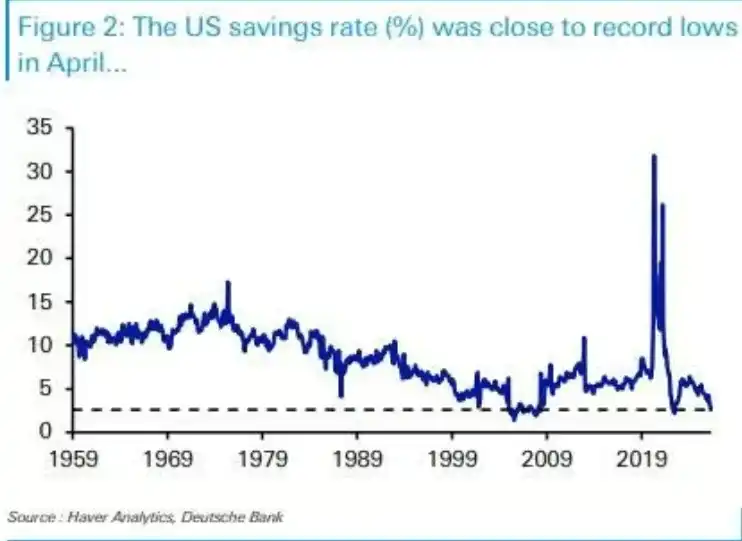
However, warning signals at the consumer level are accumulating. The US savings rate was just 2.6% in April, a similarly low level historically seen in only two other periods: a single month in 2022 (when pandemic-era excess savings were being depleted) and just before the global financial crisis erupted. Meanwhile, the University of Michigan Consumer Sentiment Index hit its all-time low in May since records began in 1952.

The monetary policy environment is also tightening. The European Central Bank is widely expected to raise interest rates this month, and market bets on Federal Reserve rate hikes in 2026 are heating up — with US PCE inflation reaching 3.8% year-on-year in April, providing support for this expectation.
Henry Allen notes that historically, hawkish stances from the Federal Reserve have often coincided with widening credit spreads, as seen in 2022, late 2018, and from 2015 to 2016. The current calm in credit markets forms a clear divergence from this historical pattern.

Bond Market Bearing Pressure Alone, Divergence with Stocks Continues to Widen

While equity and credit markets show high immunity to geopolitical risks, sovereign bond markets have charted a distinctly different course.

Over the past month, the yield on the 10-year US Treasury note has almost completely tracked oil price movements, clearly decoupling from other asset classes. In mid-May, sovereign bond yields hit multi-year highs: the 30-year US Treasury yield rose to 5.18%, the highest since 2007; the 10-year German bund yield climbed to 3.19%, the highest since 2011.

At that time, stocks were just a step away from record highs, while bond yields were already at levels not seen in over a decade. This divergence shows no signs of convergence to this day.

Henry Allen believes that bond markets more directly price in inflation and fiscal risks, hence reacting more sensitively to geopolitical shocks. The persistent divergence between stock and bond markets is itself a manifestation of current market fragility.

Unexpectedly Stable Oil Prices: A Key Pillar for Risk Assets

The blockade of the Strait of Hormuz has lasted far longer than initial market expectations, yet the reaction in oil prices has been surprisingly mild, which partly explains the resilience of risk assets.

When the US-Iran conflict erupted on February 28, the White House initially estimated the operation would last 4 to 6 weeks. However, the Strait of Hormuz remains blocked to this day. According to prediction market Polymarket data, the probability of normal navigation resuming by the end of June has plummeted from around 80% in mid-April to just 22%.
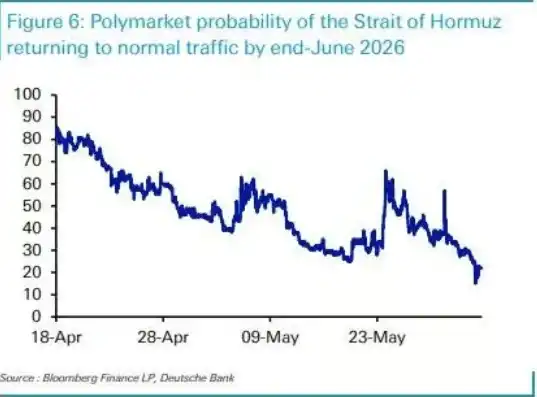
Despite this, the oil futures curve has remained relatively stable. Just two weeks after the conflict began, on March 13, the 6-month Brent crude futures contract settled at $85.66 per barrel. On June 1, the same contract was quoted around $84.88, barely moving.

Henry Allen points out that it is precisely because the oil futures curve has not shifted significantly higher that investors have not priced in serious stagflation risks, thereby avoiding larger-scale selling of risk assets. However, he warns that if the Strait of Hormuz blockade persists, whether this support can be maintained remains uncertain.


Criptos en tendencia

Preguntas relacionadas

QAccording to the article, how many times since WWII has the S&P 500 gained 16% in a two-month period, and what is the key characteristic of the only non-recessionary precedent?

AAccording to the article, the S&P 500 has gained 16% in a two-month period only 4 times since WWII. Three of these instances occurred during recoveries from recessions. The only non-recessionary precedent was in January-February 1987, which preceded the 'Black Monday' crash later that year.

QWhat consumer-related warning signs are mentioned in the article as potential risks being overlooked by the market?

AThe article mentions two key consumer-related warning signs: the U.S. savings rate was only 2.6% in April (a level historically only seen briefly in 2022 and before the global financial crisis), and the University of Michigan Consumer Sentiment Index hit its lowest recorded level since 1952 in May.

QWhat historical anomaly does the article point out regarding the current relationship between Federal Reserve policy expectations and credit spreads?

AThe article points out a historical anomaly where tightening Federal Reserve policy has typically coincided with widening credit spreads, as seen in 2022, late 2018, and 2015-2016. However, currently, despite rising expectations for Fed rate hikes, credit spreads remain at historically low levels, showing a clear divergence from this past pattern.

QHow has the sovereign bond market behaved differently from the stock and credit markets in response to recent geopolitical risks?

AWhile stock and credit markets have shown resilience, the sovereign bond market has been under significant pressure. Specifically, the 10-year U.S. Treasury yield has closely followed oil price movements, decoupling from other assets. Yields on long-term U.S. and German government bonds recently hit multi-year highs, indicating the bond market is more directly pricing in inflation and fiscal risks.

QWhy has the oil market's reaction to the prolonged closure of the Strait of Hormuz been described as a 'key pillar' for risk assets?

AThe oil market's reaction has been a 'key pillar' for risk assets because, despite the Strait of Hormuz closure lasting much longer than initially expected, oil futures prices have remained surprisingly stable. This lack of a sharp upward move in the oil futures curve has prevented investors from pricing in severe stagflation risks, thereby avoiding a larger sell-off in riskier assets like stocks.

Lecturas Relacionadas

human.tech Launches Clean SDK for Privacy-First Web3 Apps

human.tech has launched the Clean SDK, a toolkit enabling developers to build privacy-first Web3 applications with transparent accountability. Released alongside Aztec's version 5, the SDK provides components for integrating zero-knowledge identity verification, sanctions screening, and private transactions, without developers handling sensitive user data or building compliance infrastructure from scratch. It uses zero-knowledge proofs and programmable verification to allow apps to confirm user legitimacy and sanctions compliance while keeping identities confidential. The first application built on the SDK, Shield, a privacy bridge to Aztec, also launched. It allows users to transfer assets privately while proving a unique human is behind each transfer and that funds have passed sanctions checks, as verified by a May 2026 audit. The SDK offers three core verification techniques: Proof of Innocence (sanctions screening against 23 sources), Proof of Personhood (simpler verification via Human Passport), and Proof of Clean Hands (higher-assurance zero-knowledge government ID checks). This allows apps to authenticate users and transactions without exposing personal data. Designed for Aztec builders, the SDK lets developers add programmable privacy to decentralized apps, eliminating the need to create their own verification and ZK infrastructure. Shield demonstrates its practical use for private bridges, but the SDK aims to enable a wider ecosystem of private, accountable financial apps and services. The launch addresses growing demand for infrastructure that balances privacy and accountability. The SDK avoids traditional identity databases, storing encrypted data off-chain, screening at both entry and exit points, and including a gated disclosure mechanism for legal requests. human.tech's products, including the Clean SDK, focus on using zero-knowledge technology to enable verifiable personhood and privacy in digital systems.

TheNewsCryptoHace 24 min(s)

human.tech Launches Clean SDK for Privacy-First Web3 Apps

TheNewsCryptoHace 24 min(s)

Unlocking $100 Million in Liquidity? Pump.fun's New Policy Tests the 5-Minute Pump Technique

Pump.fun, a popular meme coin launchpad, has introduced a new standard mechanism called BOOST. It aims to address a significant capital efficiency issue: when a newly launched token graduates from its initial bonding curve to a liquidity pool (LP), roughly 20% of its liquidity becomes permanently locked as "dead liquidity," estimated to waste over $100 million annually. Instead of locking these funds permanently, BOOST repurposes them. Upon a token's migration, approximately 20% of the settlement funds (e.g., 17.6 SOL or ~$2516 USDC) are used to buy back the token on the open market over a 5-minute period via a Time-Weighted Average Price (TWAP) mechanism. All purchased tokens are immediately burned. This creates a brief, systematic buy pressure immediately after migration, potentially generating a short-term price surge ("pump") while permanently reducing the token's circulating supply. The goal is to enhance the immediate post-launch trading experience, potentially increasing trader retention and sustainable protocol revenue, which funds ongoing token buybacks. However, concerns exist that this artificial 5-minute boost could lower the barrier for launching low-quality tokens and lead to steeper price crashes once the buy pressure stops, if followed by large sell-offs. The feature automatically applies to tokens migrating after July 21, 2024, but not to previously migrated tokens or those launched via the Mayhem AI Agent lab.

marsbitHace 31 min(s)

Unlocking $100 Million in Liquidity? Pump.fun's New Policy Tests the 5-Minute Pump Technique

marsbitHace 31 min(s)

Podcast Notes | Conversation with GSR Asset Management Head: To Determine if This Crypto Rally is Real, Just Watch the Lending Rates on Aave

Podcast Summary: Dialogue with GSR's Head of Asset Management: To Determine if This Crypto Rally is Real, Just Check Lending Rates on Aave Andy Baehr, Managing Director of Asset Management at GSR, discusses the current crypto market, characterizing it as stuck in a state of "ambivalence" with short-lived, unsustainable rallies. He outlines a simple framework: the market moves between "ambivalence" and "conviction" (sustained upward momentum). Currently, every rally resembles a single-stage rocket booster that quickly fizzles out. Baehr identifies three key signals to watch: 1) DeFi lending rates, 2) the potential passage of the CLARITY Act, and 3) the market forming a consensus on the "Fed hawkish peak." He emphasizes that the most immediate indicator for the sustainability of the recent CPI-triggered rally is the USDC borrowing rate on Aave, currently around 3.75%—close to U.S. Treasury yields. The absence of a credit spread indicates low leverage demand and a lack of market energy. He explains that a healthy, sustained rally requires layered buying pressure. Last year's rally progressed from an ETH short squeeze to crypto-native trader influx and finally to ETF inflows. Currently, this structure is missing. Other potential structural buyers like Digital Asset Treasury (DAT) companies are absent, and ETF flows have proven transient. Baehr notes that while small-cap crypto tokens outperformed large caps in Q2—a potential sign of capitation in major assets—capital is also flowing to more exciting opportunities like AI stocks and tech IPOs, leaving crypto sidelined. Regarding DeFi, he highlights that platforms like Aave provide a clear, real-time signal of leverage demand through their supply/demand-driven interest rates. A significant, sustained rate increase would signal genuine market conviction. He also observes the quiet emergence of fixed-income-like products and vaults in DeFi. On regulation, the probability of the CLARITY Act passing before the August 7th deadline has dropped linearly from 75% to below 40% on Polymarket. Baehr suggests its passage would be treated as a bullish surprise, a potent driver for price movement. However, political hurdles, including ethical clause debates and disclosures about the First Family's crypto profits, remain significant obstacles. Ultimately, the market awaits clarity on the Fed's terminal rate under Chair Warsh. Until the "Fed Solstice"—the point where the market collectively understands the peak of hawkish policy—sustained conviction will be difficult to achieve.

marsbitHace 1 hora(s)

Podcast Notes | Conversation with GSR Asset Management Head: To Determine if This Crypto Rally is Real, Just Watch the Lending Rates on Aave

marsbitHace 1 hora(s)

Trading

Spot

Artículos destacados

Cómo comprar 4

¡Bienvenido a HTX.com! Hemos hecho que comprar 4 (4) sea simple y conveniente. Sigue nuestra guía paso a paso para iniciar tu viaje de criptos.Paso 1: crea tu cuenta HTXUtiliza tu correo electrónico o número de teléfono para registrarte y obtener una cuenta gratuita en HTX. Experimenta un proceso de registro sin complicaciones y desbloquea todas las funciones.Obtener mi cuentaPaso 2: ve a Comprar cripto y elige tu método de pagoTarjeta de crédito/débito: usa tu Visa o Mastercard para comprar 4 (4) al instante.Saldo: utiliza fondos del saldo de tu cuenta HTX para tradear sin problemas.Terceros: hemos agregado métodos de pago populares como Google Pay y Apple Pay para mejorar la comodidad.P2P: tradear directamente con otros usuarios en HTX.Over-the-Counter (OTC): ofrecemos servicios personalizados y tipos de cambio competitivos para los traders.Paso 3: guarda tu 4 (4)Después de comprar tu 4 (4), guárdalo en tu cuenta HTX. Alternativamente, puedes enviarlo a otro lugar mediante transferencia blockchain o utilizarlo para tradear otras criptomonedas.Paso 4: tradear 4 (4)Tradear fácilmente con 4 (4) en HTX's mercado spot. Simplemente accede a tu cuenta, selecciona tu par de trading, ejecuta tus trades y monitorea en tiempo real. Ofrecemos una experiencia fácil de usar tanto para principiantes como para traders experimentados.

797 Vistas totalesPublicado en 2025.10.20Actualizado en 2026.06.02

Cómo comprar 4

Discusiones

Bienvenido a la comunidad de HTX. Aquí puedes mantenerte informado sobre los últimos desarrollos de la plataforma y acceder a análisis profesionales del mercado. A continuación se presentan las opiniones de los usuarios sobre el precio de 4 (4).

活动图片