Trader's Practical Guide: Avoiding 'Catching Falling Knives' - A Bottom-Fishing Methodology Integrating Fundamentals, Technicals, and Sentiment

marsbitPublicado a 2026-01-23Actualizado a 2026-01-23

Resumen

This guide outlines a systematic framework for buying stocks at their bottom, integrating fundamental, technical, and sentiment analysis to avoid premature buying ("catching a falling knife"). The process begins by identifying the catalyst for a stock's decline and assessing whether it's a temporary issue or a fundamental break in the investment thesis. A thorough fundamental review using the "4M" framework (Business Model, Moat, Management, Margin of Safety) and conservative DCF valuation is essential. Technically, patience is key; wait for signs of seller exhaustion. Strategies include buying on the right side of a V-shaped reversal, after a 5-day EMA crosses above the 20-day EMA, near long-term support levels, or after a base forms at least 5% above 52-week lows. Riskier "waterfall decline" entries require careful scaling-in. Sentiment analysis acts as a contrarian indicator. Extreme pessimism, such as drastically lowered price targets or widespread capitulation from retail investors, can signal a potential bottom. Combining these elements creates a disciplined approach to identify high-probability entry points with a margin of safety.

Author: SixSigmaCapital

Compiled by: Yuliya, PANews

This article aims to summarize a set of procedures for buying at stock price bottoms, detailing practical experiences and lessons learned, and establishing a sustainable framework for identification and execution. It is recommended that investors combine this strategy with other investment philosophies to gain a more comprehensive understanding of the market.

Initial Analysis and Catalyst Tracking

When a stock an investor is interested in begins to decline, close attention should be paid. Identify any upcoming catalysts, whether positive or negative. If there are no clear catalysts, it usually means the investor has more time for analysis.

At this point, the key is to figure out the reason for the stock's decline: is it a company-specific issue or an industry-wide problem? Is the price decline reasonable, or is the market over-penalizing? Is this a temporary problem, or one that fundamentally alters the original investment thesis? If the reason for the decline does not break the initial investment logic, then you can move to the next steps for a more thorough consideration of this investment opportunity.

Fundamental Due Diligence

It is essential to complete fundamental research as early as possible. The classic "4M Framework" is an effective tool, consisting of four dimensions:

  • Business Model (Meaning): What business the company is specifically in.

  • Moat: What competitive advantages the company possesses.

  • Management: The capability and integrity of the management team.

  • Margin of Safety: Whether the current stock price provides a sufficient margin of safety.

It is recommended that investors carefully review the company's financial filings and familiarize themselves with its three main financial statements (Income Statement, Balance Sheet, Cash Flow Statement). Attention should also be paid to earnings call transcripts. If using a DCF (Discounted Cash Flow) model for valuation, be sure to use conservative estimates to determine the stock's intrinsic value. This ensures that when the time comes, the investor knows clearly they are buying at a significant discount.

Incorporating Technical Analysis

Do not bottom-fish too early; patience is key. Ideally, an investor should aim to be among the last to buy the bottom. This is crucial because it allows time to study prior price action and wait for selling pressure to gradually exhaust itself. It is recommended to study charts across multiple timeframes; daily and weekly charts are good starting points.

Here are several technical analysis methods that can be used individually or in combination:

  • Buying on the "right side" of a V-shaped reversal

  • Waiting for the 5-period EMA (Exponential Moving Average) to cross above the 20-period EMA

  • Buying at long-established support levels

  • Waiting for the stock to base build after holding at least 5% above the 52-week low before initiating a tentative buy

  • Buying during a "waterfall decline" (this method is higher risk)

The application of these methods is illustrated below with some case studies.

1. Buying on the "Right Side" of a V-Shaped Reversal

This is a relatively simple strategy: first, determine an ideal price you are willing to pay, then patiently wait for the stock to stop falling. When the price rebounds and rises back to that level, you can execute the trade. This is a higher-probability entry method and allows you to place a stop-loss near the recent low to protect the position.

2. Exponential Moving Average Crossover

Waiting for the 5-period EMA to cross above the 20-period EMA is a straightforward strategy. The core idea is to wait for a potential trend reversal confirmation signal before committing any capital.

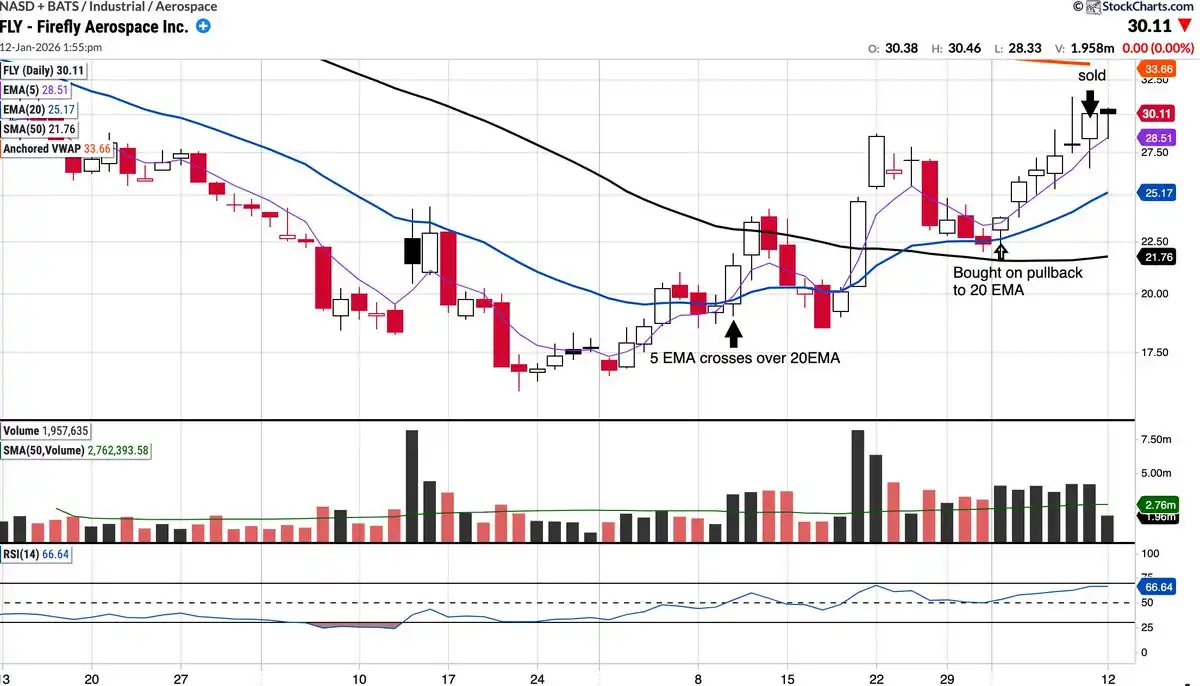
Take the recent FLY trade as an example. The stock had initially caught the investor's attention, but a buy was initiated only after waiting for the 5-day EMA to cross above and hold above the 20-day EMA, entering on a pullback to test the 20-day EMA. This trade ultimately proved successful, yielding a gain of about 35% to 36% over approximately six trading days.
3. Base Building (Basing)

Waiting for a stock to hold and start building a base above its 52-week low (e.g., at least 5% above the low) is another recommended strategy. The reason is simple: investors need to see evidence that the price is likely to hold the previous low and that a trend change might be occurring.

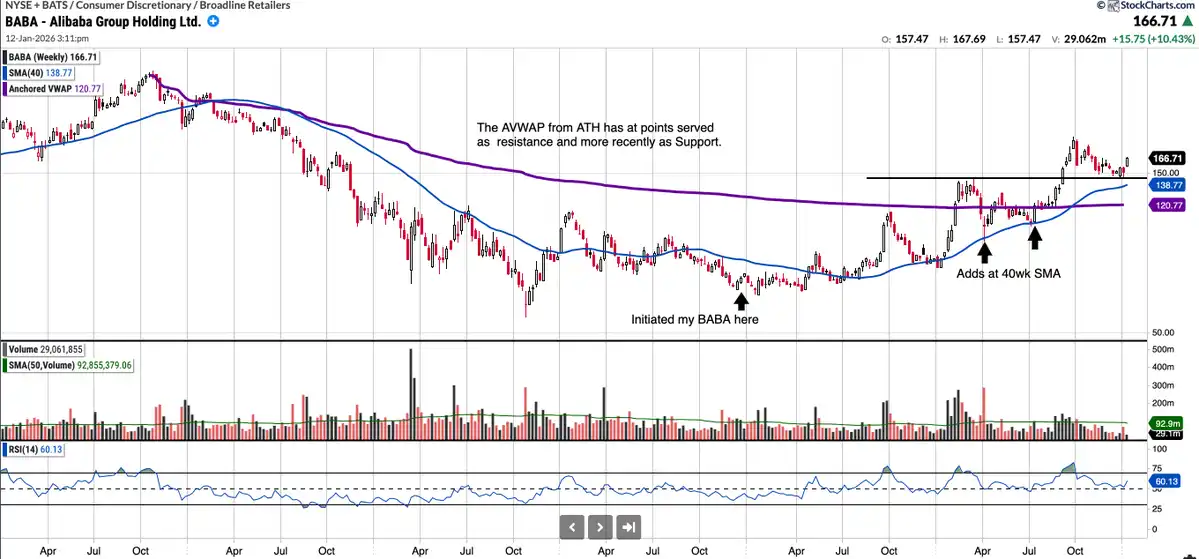
Looking back to 2023, BABA is a good example. Although the stock had bottomed at $55 per share the previous year, an investor chose to enter in December 2023 when the price was between $68 and $70. At that time, the stock was basing, and there was a significant dislocation between price and value, with a P/E ratio of only 7. Later, the investor added to the position when the price pulled back to test the 40-week SMA (Simple Moving Average) and still holds these shares to this day.
4. Waterfall Decline

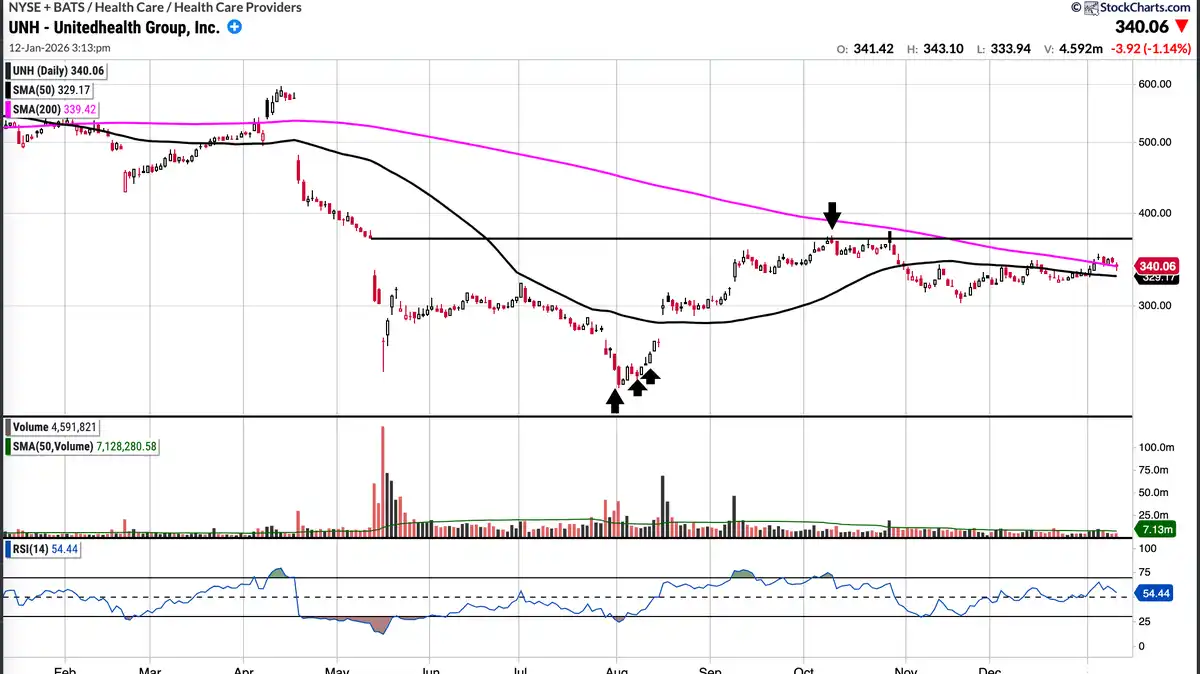
UNH is a case study for trading a "waterfall decline." This is a higher-risk setup, but the risk can be managed by combining the principle of "delayed buying" (waiting for sellers to diminish) and adding on the "right side" of the V-shaped reversal.

When UNH's stock price first declined in mid-May, it entered the investor's watchlist but was not bought immediately. The massive selling volume at the time was enough to cause hesitation. However, after completing fundamental analysis, $240 was marked from a valuation perspective as a level worth considering for a buy. When the price began to fall rapidly in August, buying operations commenced. Buys were made in batches as the price began to recover, in the range of the $230s to $240s. Finally, the position was closed out after the gap was filled in mid-October.
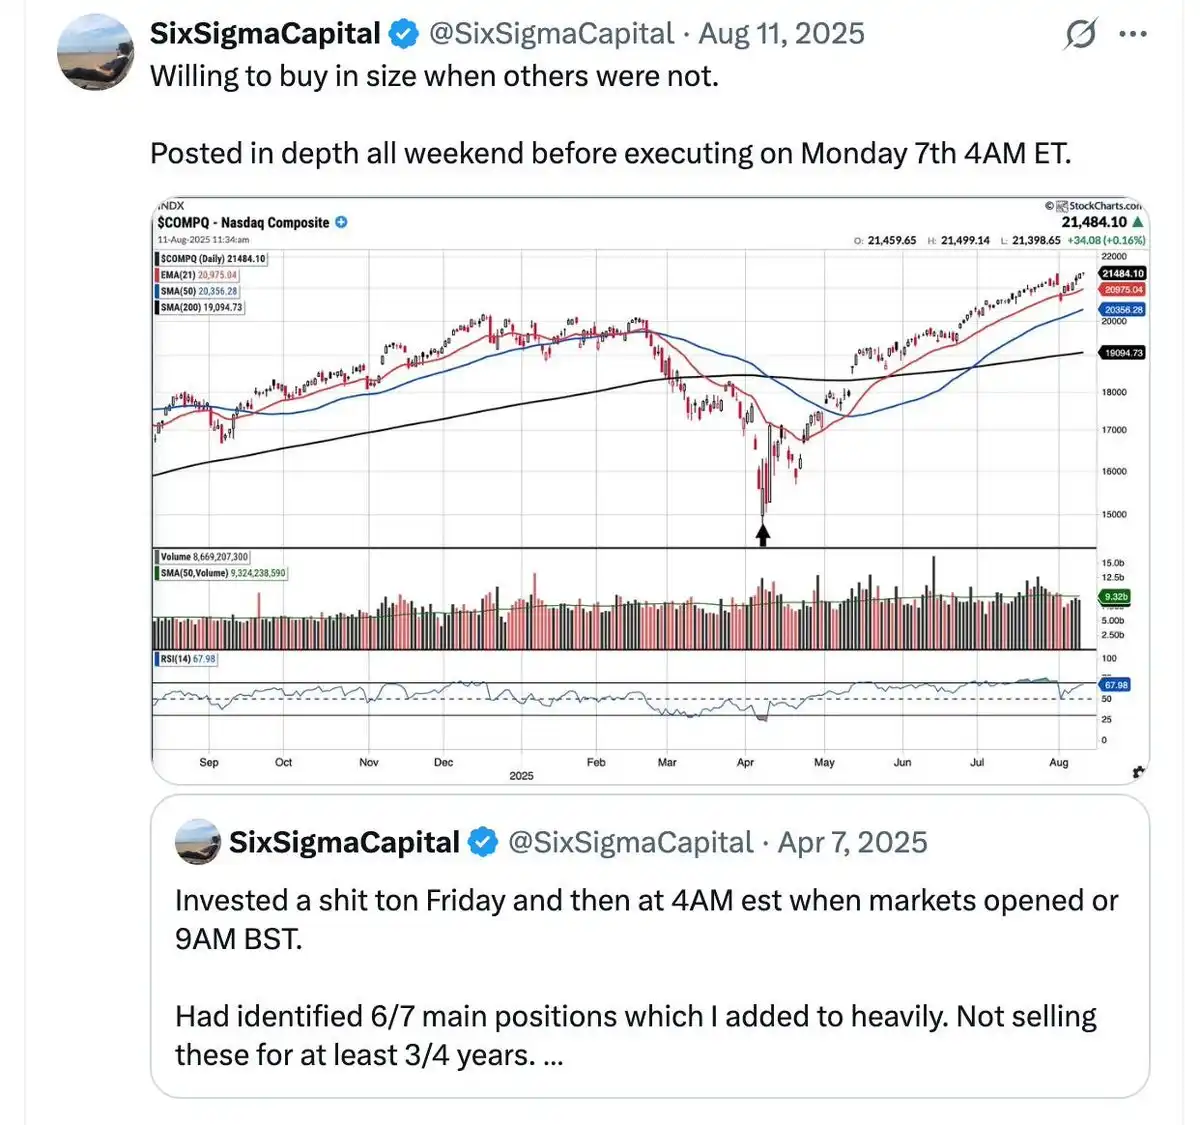
Another successful case of buying a waterfall decline was catching the bottom on April 7, 2025. Deep analysis was conducted throughout the weekend before executing the trade at 4 AM ET that Monday morning.
Sentiment Analysis

Tracking market sentiment is another crucial piece of the decision-making puzzle. Although it is not an exact science, there are several specific methods to incorporate it into the analysis process.

As mentioned before, it is not advisable to buy when the general public is bottom-fishing. Instead, one should look for entry points when early buyers have become frustrated and finally capitulated. An important signal is when extremely pessimistic price targets start circulating in the market, or when investors who are "all-in" on a single stock sell their positions out of despair. Typical examples include the crash Tesla experienced when its stock fell to $150 in April 2024, and the widespread belief at the time that Google was "destined to fail" in artificial intelligence.

Furthermore, waiting for analysts to lower their expectations and price targets is also an effective strategy. This process often reduces risk; once market expectations are lowered, the company only needs to achieve a small beat to potentially trigger a positive stock reaction.

Finally, if you have a following on social media, you can use them to gauge current market sentiment. For example, you can test sentiment by posting something like: "I bought UNH at $237, am I screwed?" If the post gets unusually high engagement and the replies are overwhelmingly bearish, even with some calling for prices below $100, such extreme pessimism can be seen as a good contrarian indicator.


Preguntas relacionadas

QWhat is the four-dimensional framework mentioned for fundamental due diligence?

AThe four-dimensional framework is the '4M Framework', which includes: 1. Meaning (What business the company is in), 2. Moat (The company's competitive advantages), 3. Management (The capability and integrity of the management team), and 4. Margin of Safety (Whether the current stock price provides a sufficient margin of safety).

QAccording to the article, what is a key technical analysis strategy for entering a position after a 'V-shaped reversal'?

AThe key strategy is to buy on the 'right side' of the V-shaped reversal. This involves first identifying an ideal price you are willing to pay, then waiting for the stock to stop falling. When the price rebounds and rises back to that level, you can execute the trade, allowing you to set a stop-loss near the recent low.

QHow does the article suggest using market sentiment as a contrarian indicator?

AThe article suggests looking for extreme pessimism as a contrarian indicator. This includes when extremely bearish price targets are circulating, when 'all-in' investors sell out of desperation, or when analyst expectations and price targets are downgraded. It also mentions gauging sentiment through social media, where a high volume of bearish replies to a post about a purchase can signal a potential buying opportunity.

QWhat is the recommended approach for buying during a 'waterfall decline' to manage risk?

AThe recommended approach for a 'waterfall decline' is to manage risk by combining the principle of 'delayed buying' (waiting for selling pressure to subside) with adding to the position on the 'right side' of a V-shaped rebound. This avoids buying into the initial, high-volume selloff and instead focuses on entering as the price begins to recover.

QWhy does the article emphasize the importance of identifying the catalyst for a stock's decline?

AIdentifying the catalyst is crucial to determine if the price drop is due to a company-specific issue or a broader industry problem, and to assess whether it is a temporary setback or a fundamental change that breaks the original investment thesis. This analysis helps investors decide if the sell-off is an overreaction and if the opportunity warrants further investigation.

Lecturas Relacionadas

Only 153 Venture Capital Firms Invested in July: Is the Crypto VC Industry Experiencing a 'Mass Extinction'?

In July 2026, only 153 unique venture capital firms participated in disclosed crypto funding rounds, marking the lowest monthly count since November 2020. This figure represents an 87% decline from the peak of 1,177 firms in 2022. Overall, the first seven months of 2026 saw crypto projects raise approximately $11.78 billion across 481 rounds. This crypto VC contraction contrasts sharply with the broader venture capital landscape, where global VC investment reached a record $560.4 billion in H1 2026, heavily fueled by major AI company financings. This shift in capital allocation has drawn funds away from the crypto sector. Within crypto, funding is highly concentrated. Trading platforms, prediction markets, and payment sectors absorbed 53% of the total capital. While early-stage deals remain frequent, the largest sums flow to a few late-stage rounds and mergers & acquisitions, which surged to $7.23 billion in Q2 2026. The market is consolidating around top funds like a16z crypto and Dragonfly, which successfully raised new multi-billion dollar funds, while many smaller firms have retreated. Analysts describe this as a "great extinction" for crypto VCs, where capital is becoming more selective, favoring proven business models and assets over early-stage speculation. This raises the bar for project quality, funding efficiency, and viable exit paths.

marsbitHace 15 min(s)

Only 153 Venture Capital Firms Invested in July: Is the Crypto VC Industry Experiencing a 'Mass Extinction'?

marsbitHace 15 min(s)

Strategy's Loss in the Second Quarter Reaches $8.22 Billion Amid Bitcoin Decline

Strategy, the largest corporate holder of Bitcoin, reported a net loss of $8.22 billion for the second quarter. This loss was primarily driven by an $8.32 billion unrealized loss on its Bitcoin holdings due to a decline in the asset's price during the period. Despite these paper losses, the company increased its Bitcoin holdings to 843,775 BTC, a 25% growth since the start of the year. As part of a new monetization strategy, Strategy sold approximately $218.4 million worth of Bitcoin, mainly to fund dividends for preferred shareholders, with $216 million of that sold after Q2 ended. The company also built a $3.75 billion cash reserve, which it claims is sufficient to cover over two years of dividend and interest payments, aiming to insulate itself from Bitcoin's volatility while meeting obligations. Following the earnings release, Strategy's stock (MSTR) rose 4.7% in regular trading but corrected slightly after-hours. This pattern reflects how the company's accounting results are heavily tied to Bitcoin's price swings, even as its long-term strategy remains unchanged. The report indicates that Strategy is maintaining its core strategy of accumulating Bitcoin while building a financial buffer. This quarterly loss follows a recognizable pattern, with the company posting significant unrealized losses in previous quarters (e.g., $12.4 billion in Q4 2025 and ~$12.5 billion in Q1 2026) due to fair-value accounting. A key technical shift is its new monetization program, which introduces periodic selling pressure on the market, transitioning Strategy from a pure accumulator to a participant that occasionally adds supply. A critical question remains: how long can the cash reserve cover dividend obligations if a Bitcoin price downturn persists beyond two years?

cryptonews.ruHace 35 min(s)

Strategy's Loss in the Second Quarter Reaches $8.22 Billion Amid Bitcoin Decline

cryptonews.ruHace 35 min(s)

Will Terrorist Durov Ban Russian Officials?

Telegram founder Pavel Durov publicly reacted to being labeled a "terrorist" by Russian authorities, stating the designation came after he refused demands for mass surveillance and censorship on the platform. In a Telegram post, he highlighted that this status formally bans him from "publishing information online." Durov concluded with a statement widely circulated: Russian officials "clearly don't understand who can ban whom on the internet." This remark suggests Durov could potentially restrict official Russian government and officials' channels on Telegram, which continue to operate on the platform despite its formal blocking in Russia. The situation parallels previous, slow-moving state directives, like switching officials to domestic cars, contrasted with the current push to migrate all government communication to the Russian-made messenger MAX by 2030. However, reports indicate many officials still use Telegram via workarounds, fearing surveillance on MAX, while alternatives like BiP and KakaoTalk recently became inaccessible in Russia without a VPN. Durov has not specified any immediate actions against state channels. His statement is an initial response, with further developments depending on the authorities' reaction. The dynamic differs from 2020 when Russian regulators lifted a block on Telegram; now, Durov implies control from within the platform itself over the official accounts that persisted through that earlier blockade.

cryptonews.ruHace 35 min(s)

Will Terrorist Durov Ban Russian Officials?

cryptonews.ruHace 35 min(s)

DeepSeek V4 Official Version Arrives, New Capabilities Emerge, Value-for-Money King Enters the Fray

On July 31st, DeepSeek officially launched the public API beta for its DeepSeek-V4-Flash model. A key highlight is its performance on multiple Agent benchmark tests, reportedly nearing or even surpassing the level of the V4-Pro preview version from three months ago. Notably, the Flash model achieves this with significantly smaller scale (130B active parameters vs. Pro's 490B), suggesting that post-training optimization and data quality may be as crucial as raw model size. DeepSeek emphasized that the V4-Flash-0731 uses the same model architecture and size as its preview version, with improvements attributed solely to "re-trained post-training." The update also marks the official debut of DeepSeek's self-developed Agent framework, "Harness." The move signals DeepSeek's strategic push to position its cost-effective Flash model as a competitive base for Agent applications—scenarios requiring autonomous planning, tool usage, and complex task execution—where inference speed and cost are critical. By natively supporting OpenAI's Responses API format and adapting for code-generation scenarios, DeepSeek aims not just to be a cheaper alternative but to establish its own ecosystem in the Agent era. This release follows DeepSeek's record-breaking ~$50 billion fundraising round roughly two months prior, underscoring market confidence in its technology and commercialization prospects. The company is reportedly preparing for another funding round at a valuation of approximately $71 billion. The Flash model's advancement represents a step in fulfilling the high expectations that come with this valuation, setting the stage for the impending release of the V4-Pro official version and intensifying competition in the global Agent landscape.

marsbitHace 39 min(s)

DeepSeek V4 Official Version Arrives, New Capabilities Emerge, Value-for-Money King Enters the Fray

marsbitHace 39 min(s)

Trading

Spot
活动图片