Telegram’s Lighter integration fuels HYPE – Breakout toward $42 IF…

ambcryptoPublicado a 2026-04-07Actualizado a 2026-04-07

Resumen

Telegram's integration with Lighter brought attention to Hyperliquid (HYPE), but a significant whale moved against the trend by selling 12.2K HYPE ($449.1K) and placing an additional 10.4K HYPE sell order ($386K), while withdrawing $1.26M in USDC. This activity, following the whale's exit from large long positions, created a divergence between the bullish narrative and capital flow. HYPE maintained a bullish flag pattern, trading between support at $35.37 and resistance at $38. While the structure remained intact with buyers stepping in at lower levels, failure to break $38 indicated hesitation. A breakout toward $42.10 was possible if resistance was overcome. The RSI showed weakening buying pressure, stabilizing near 49.18. Short liquidations dominated recent activity ($26.58K vs. $4.14K long liquidations), supporting upward pressure and short squeezes. However, the funding rate, though positive at 0.0008%, was declining, signaling reduced conviction among longs. This aligned with whale distribution, suggesting weakened confidence. The overall setup remained constructive but faced headwinds near resistance, leaving a breakout uncertain.

Telegram’s Lighter integration drew attention to Hyperliquid. However, a large whale moved in the opposite direction immediately.

Source: Onchain Lens

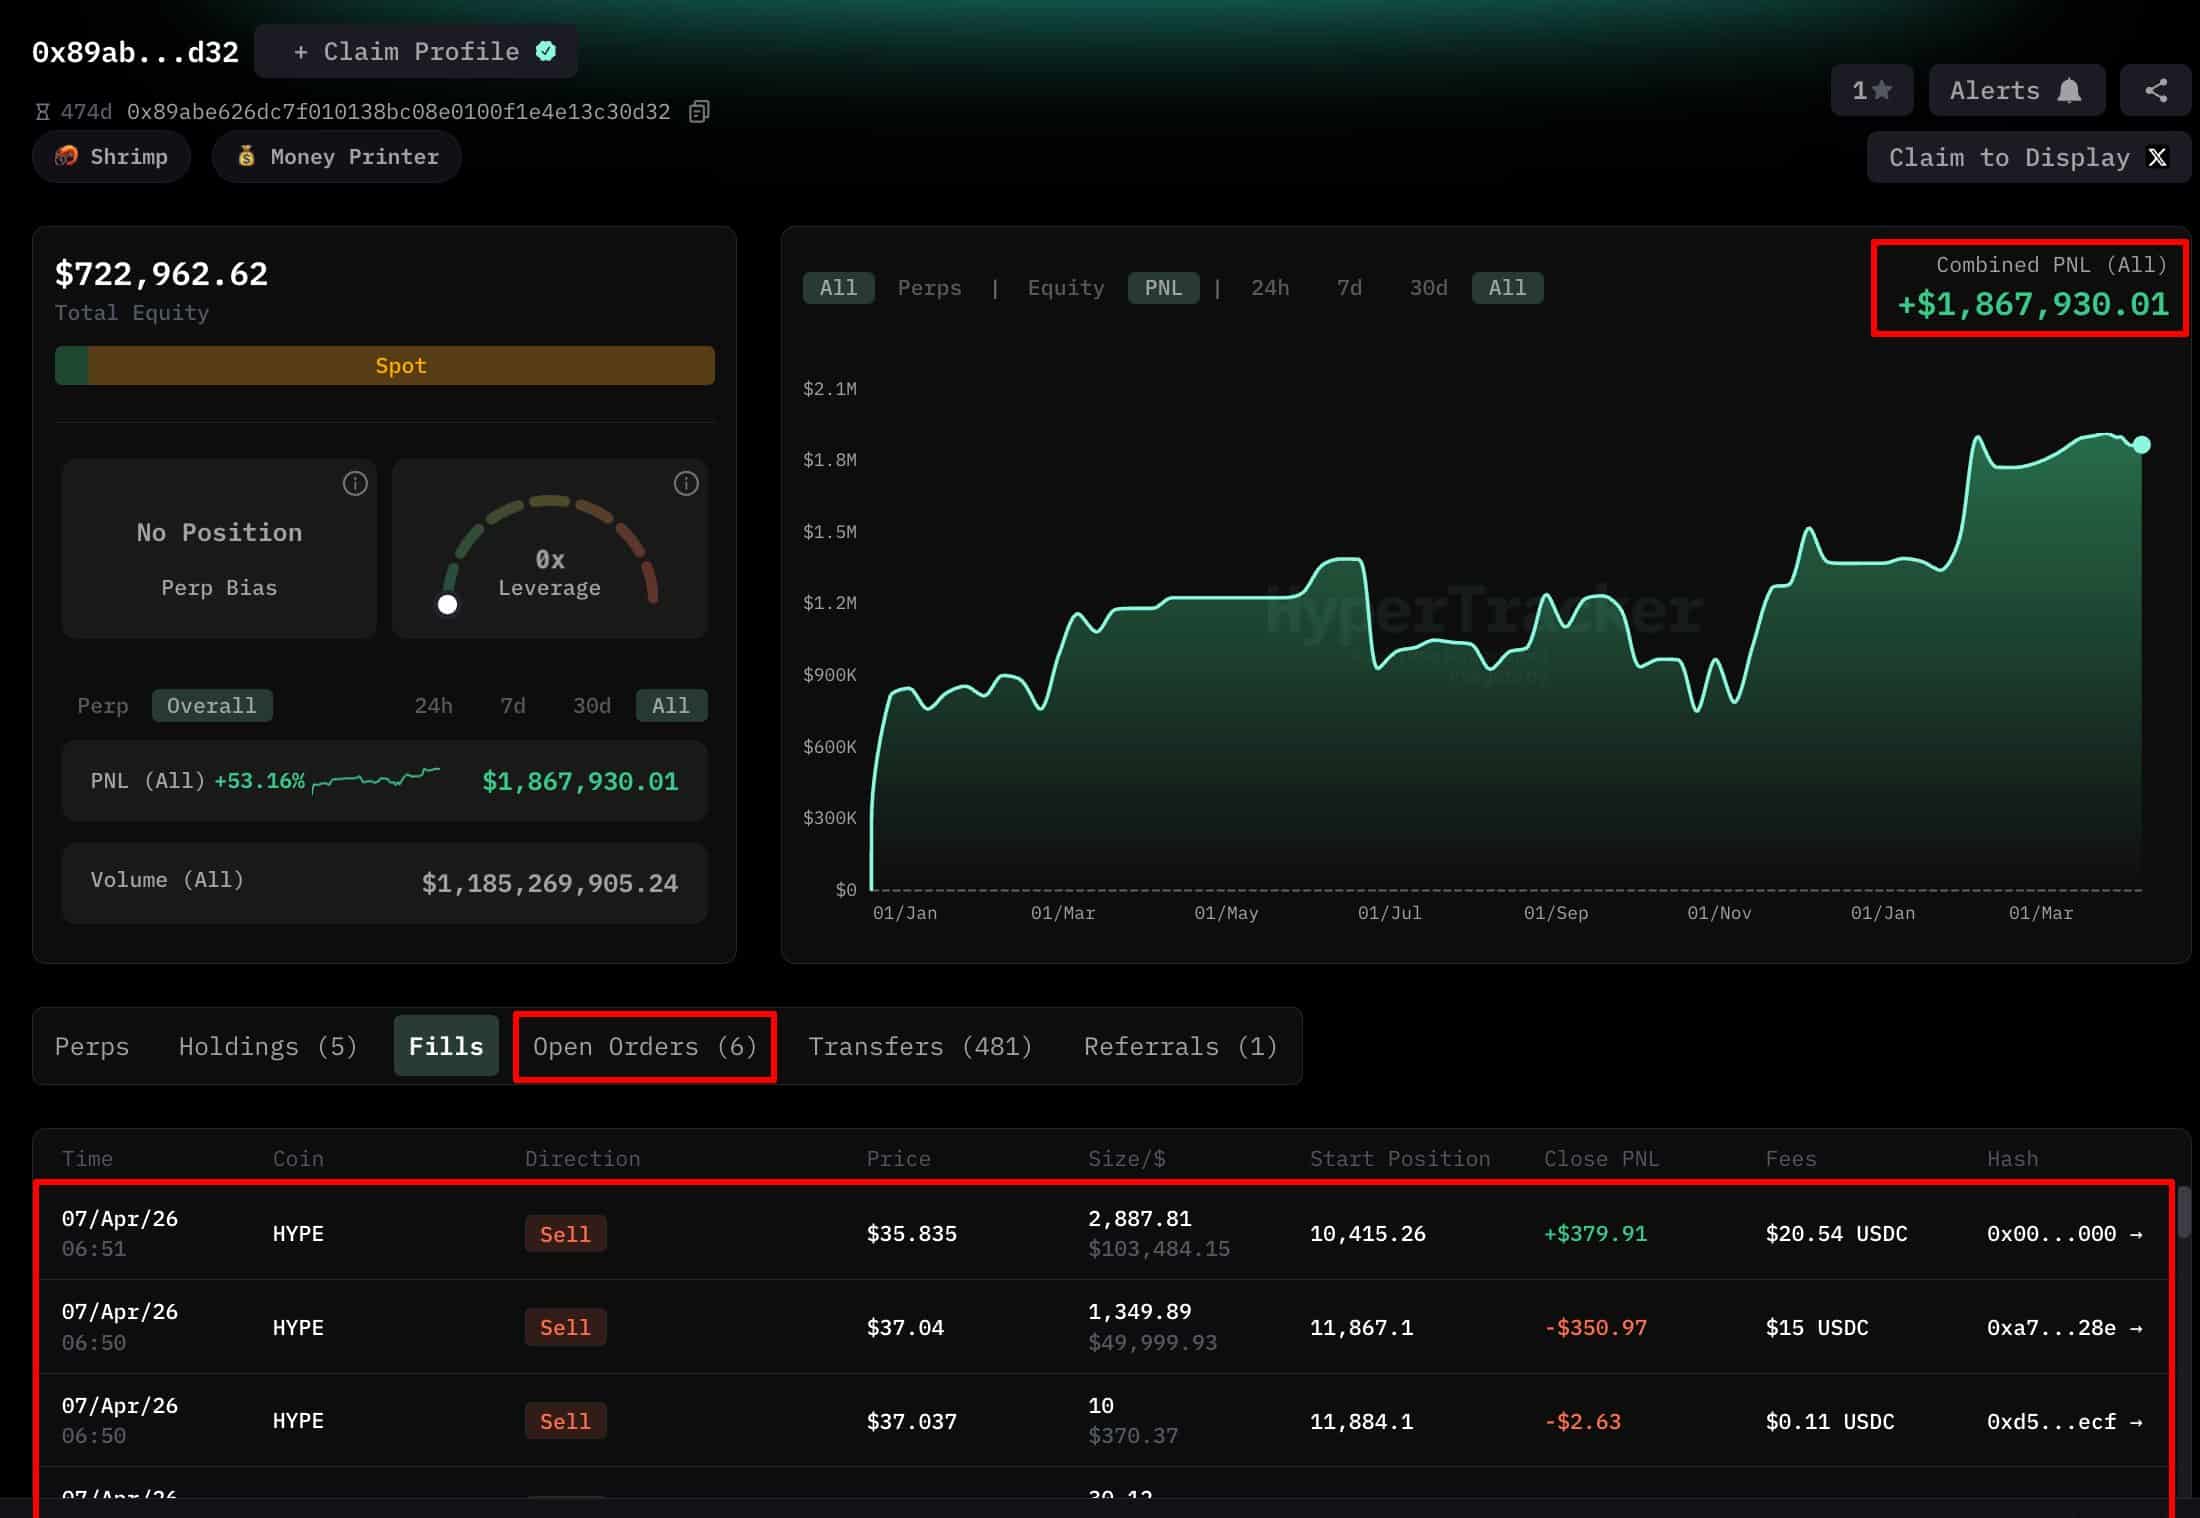
The whale dumped 12.2K HYPE worth $449.1K and placed another 10.4K HYPE sell order worth $386K. He also withdrew $1.26M in USDC, reducing exposure.

That move followed his exit from multi-million dollar HYPE longs after the 3rd of April. His $1.72M+ lifetime PnL suggested calculated positioning.

However, this created a divergence between the bullish narrative and capital flow. That shift raised concerns about distribution in strength.

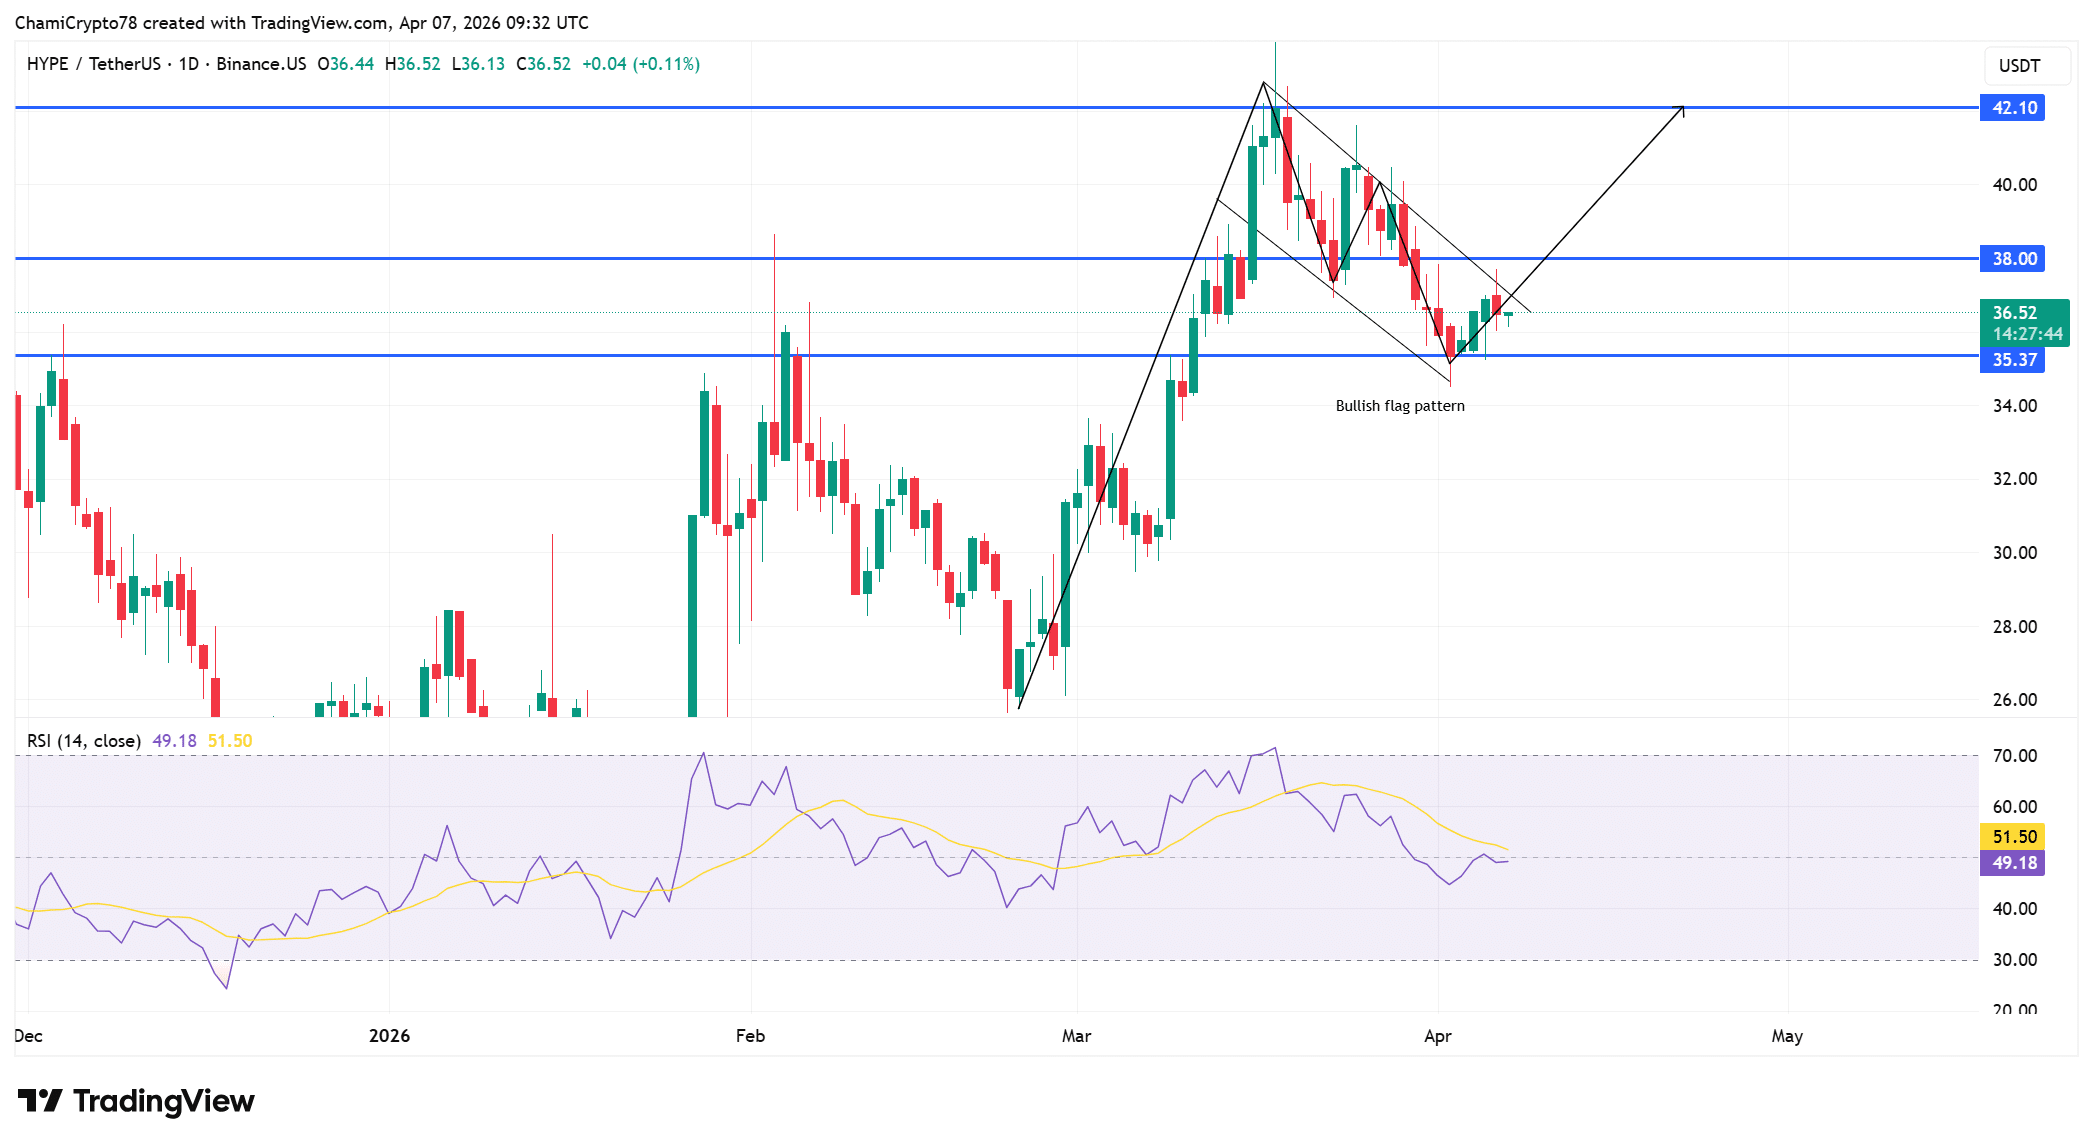
Bullish flag holds as HYPE compresses

HYPE maintained a bullish flag after rallying toward $42.10. Price pulled back into a descending channel, forming the structure.

The asset traded between $35.37 support and $38 resistance, showing controlled consolidation. Each lower-bound retest attracted buyers, preserving structure.

However, Hyperliquid [HYPE] failed to reclaim $38 decisively, signaling hesitation near resistance. This left the market waiting for a breakout.

A move toward $42.10 remained likely if resistance broke.

RSI stabilized near 49.18, with its moving average near 51.50. The indicator cooled after nearing overbought levels around 70.

Lower highs on RSI suggested weakening buying pressure.

Source: TradingView

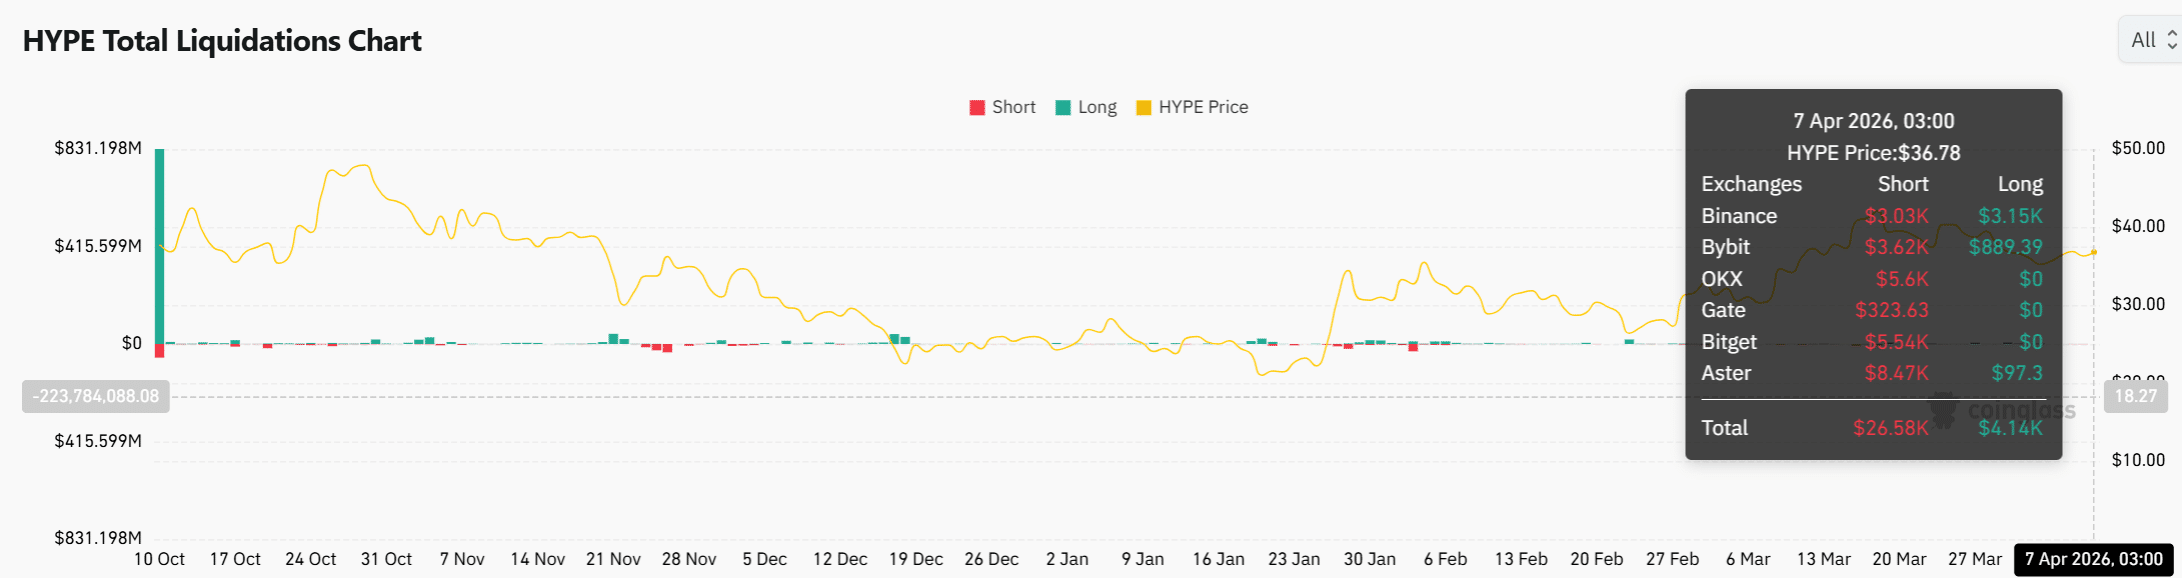
HYPE short liquidations dominate recent activity

The Liquidation chart had shown that short liquidations had outweighed long liquidations, reinforcing upward pressure in the market.

Recent figures had recorded $26.58K in short liquidations compared to $4.14K in long liquidations.

This imbalance had indicated that bearish positions had been forced out as the price held above key levels.

As a result, the market had experienced localized short squeezes, which had supported price stability within the flag.

However, the absence of large liquidation spikes had suggested controlled volatility rather than aggressive expansion.

Liquidity had continued to build around the $35.37 support and $38 resistance zones, leaving the market positioned for a decisive move.

Source: CoinGlass

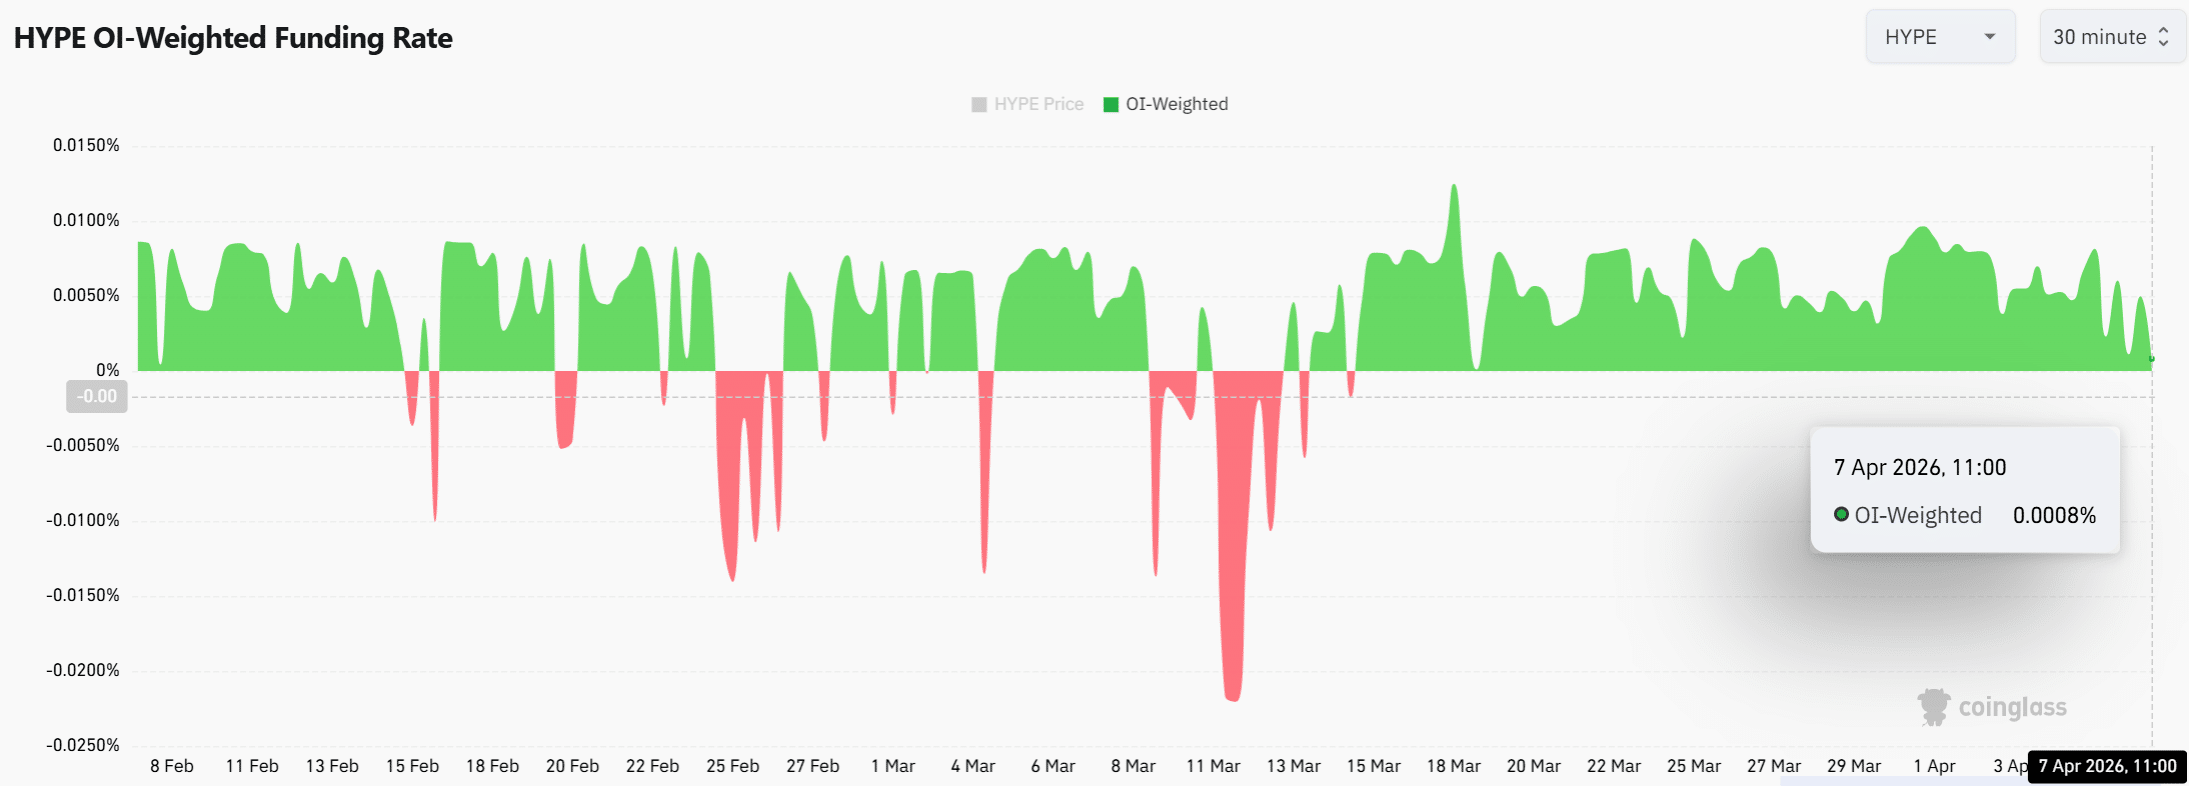
Funding stays positive but weakens

The OI-Weighted Funding Rate remained positive at 0.0008% on the 7th of April, confirming long dominance.

However, Funding Rates trended downward, signaling weakening conviction among longs.

Traders showed less willingness to pay premiums, reflecting caution near resistance.

That decline contrasted with a bullish price structure and short liquidations. It also aligned with whale-selling activity.

This suggested confidence had not fully backed further upside.

Source: CoinGlass

Can HYPE sustain a breakout?

HYPE had retained a bullish structure, supported by short liquidations and stable price action. However, declining funding rates and whale distribution had introduced clear hesitation.

The setup had remained constructive, yet conviction had weakened near resistance.

A breakout had remained possible, though underlying signals had suggested that upside strength might face immediate pressure.


Final Summary

  • HYPE held a bullish flag between $35.37 support and $38 resistance, showing controlled consolidation rather than a breakdown.
  • Repeated rejection near $38 indicated hesitation, with buyers unable to confirm a breakout yet.

Preguntas relacionadas

QWhat was the impact of Telegram's Lighter integration on Hyperliquid (HYPE)?

ATelegram's Lighter integration drew significant attention to Hyperliquid (HYPE), creating a bullish narrative for the asset.

QWhat significant trading activity did a large whale perform that contradicted the bullish sentiment?

AA large whale dumped 12.2K HYPE worth $449.1K, placed a 10.4K HYPE sell order worth $386K, and withdrew $1.26M in USDC, reducing their exposure and moving in the opposite direction of the bullish trend.

QWhat is the key price range HYPE was trading within, and what does it signify?

AHYPE was trading between the $35.37 support level and the $38 resistance level, which signifies a period of controlled consolidation within a bullish flag pattern.

QWhat did the liquidation data reveal about market pressure for HYPE?

AThe liquidation data showed that short liquidations ($26.58K) significantly outweighed long liquidations ($4.14K), indicating upward pressure as bearish positions were being forced out, supporting price stability.

QWhat was the trend of the Funding Rate, and what does it suggest about trader sentiment?

AThe OI-Weighted Funding Rate remained positive but was trending downward, signaling that while long positions were still dominant, conviction among longs was weakening and traders were showing caution near the resistance level.

Lecturas Relacionadas

Will the Next Crypto Bull Run Start with On-Chain Trading of SpaceX?

This article presents a scenario-based forecast for the crypto industry from 2026 to 2029, arguing that the next major cycle will be driven not by technological narratives but by legal access to real-world assets. The author predicts that by mid-2026, pre-IPO perpetual contracts for top private companies like SpaceX, OpenAI, and Anthropic on platforms like Hyperliquid will become the primary gateway for accessing quality assets, as most crypto-native tokens fail to capture real value. The much-hyped AI x Crypto intersection largely fails except for prediction markets, which thrive on betting on AI model supremacy. By 2027, public blockchain foundations are forced to choose between catering to retail speculation or building compliant infrastructure for institutions, with many opting for the latter. Growth in stablecoins and tokenized private credit/equity hits a "triple ceiling" due to regulatory and political uncertainty rather than market demand. The pivotal shift is forecast for 2028. A major liquidation event in pre-IPO perpetuals exposes the structural flaw of synthetic markets lacking a real underlying asset anchor. In response, regulatory changes finally allow the public solicitation of private securities resales to verified accredited investors. This creates a legitimate secondary market for real company equity, which then becomes the core asset class of the new bull market, relegating synthetic perps to a niche role. By 2029, the industry becomes "boring" but foundational. Tokens without claims on real cash flows or assets cease trading. Stablecoin growth is steady but politically capped. Crypto infrastructure fades from view as it gets absorbed into traditional finance backends. The article's central thesis is that the key bottleneck for crypto's next phase is legal and regulatory channels for real asset ownership, not technology.

marsbitHace 1 hora(s)

Will the Next Crypto Bull Run Start with On-Chain Trading of SpaceX?

marsbitHace 1 hora(s)

The Value Distribution of Stablecoins

**Summary: The Value Distribution of Stablecoins** The article argues that stablecoins are evolving from mere trading tools into broader channels for dollar access. It divides the stablecoin ecosystem into four layers to analyze how value is distributed: 1. **Issuance Layer:** Mints stablecoins, holds reserve assets, and captures the spread between reserve yield and user costs (e.g., Tether, Circle). This layer currently earns the largest profit margin. 2. **Infrastructure Layer:** Connects stablecoins to the traditional financial system, handling fiat on/off-ramps, banking integration, compliance (KYC/AML), and asset management (e.g., Bridge, BVNK). This is the "unglamorous" but critical work, building the essential bridges between crypto and real-world finance. 3. **Acquiring/Distribution Layer:** Integrates stablecoins into merchant systems, manages payment flows, and provides enterprise financial software (e.g., Stripe, Coinbase). They act as the access point for businesses. 4. **Application Layer:** The end-users and businesses that ultimately use stablecoins for payments, settlements, or as a store of value. They benefit from convenience but have little pricing power. The core thesis is that while the issuance layer currently dominates profits, the often-overlooked **infrastructure layer holds significant long-term potential**. The real challenge and barrier to mass adoption is not the on-chain transfer of stablecoins (which is simple), but the complex "last mile" integration into existing business workflows, banking systems, and regulatory frameworks across different countries. Companies in this layer are currently in a "land grab" phase, investing heavily to build networks, secure bank partnerships, and establish compliance pathways. While their position is currently pressured by the profitable issuers above and distribution platforms below, the article suggests that if stablecoins become a default financial rail for businesses, the infrastructure providers who have done the hard work of integration will ultimately gain strong pricing power and become entrenched, essential players.

marsbitHace 7 hora(s)

The Value Distribution of Stablecoins

marsbitHace 7 hora(s)

The Value Distribution of Stablecoins

The Value Distribution of Stablecoins The article argues that stablecoins are evolving from a mere trading tool into a broad "dollar channel." It analyzes the industry's value chain through four layers: 1. **Issuance Layer (e.g., Tether, Circle):** The top layer that mints stablecoins, holds reserve assets, and captures the thickest interest rate spread. 2. **Infrastructure Layer (e.g., Bridge, BVNK):** Connects stablecoins to the traditional financial system, handling critical but complex "dirty work" like fiat on/off-ramps, banking integration, compliance (KYC/AML), and cross-border settlement. 3. **Acquiring/Distribution Layer (e.g., Stripe, Coinbase):** Embeds stablecoins into merchant systems, manages payment flows, and integrates with enterprise software. 4. **Application Layer:** End-users and businesses that ultimately use stablecoins for payments, settlement, or storing value. The author posits that while the issuance layer currently captures the most profit, the most overlooked and potentially critical layer is infrastructure. The core challenge for stablecoin adoption isn't the on-chain transfer (which is simple), but bridging the gap between blockchain and the real-world financial system. This involves solving practical problems for businesses: fiat conversion, reconciliation, tax handling, and user onboarding. Infrastructure companies are currently in a difficult "land-grab" phase—building networks, securing banking relationships, and achieving compliance country-by-country. They face pressure from both the profitable issuance layer above and distribution platforms below. However, the author suggests this layer is building a crucial moat. Once stablecoins become a default business rail, the infrastructure players who have done the hard work of integration may gain significant, durable value and pricing power.

链捕手Hace 8 hora(s)

The Value Distribution of Stablecoins

链捕手Hace 8 hora(s)

Trading

Spot
Futuros

Artículos destacados

Cómo comprar TON

¡Bienvenido a HTX.com! Hemos hecho que comprar The Open Network (TON) sea simple y conveniente. Sigue nuestra guía paso a paso para iniciar tu viaje de criptos.Paso 1: crea tu cuenta HTXUtiliza tu correo electrónico o número de teléfono para registrarte y obtener una cuenta gratuita en HTX. Experimenta un proceso de registro sin complicaciones y desbloquea todas las funciones.Obtener mi cuentaPaso 2: ve a Comprar cripto y elige tu método de pagoTarjeta de crédito/débito: usa tu Visa o Mastercard para comprar The Open Network (TON) al instante.Saldo: utiliza fondos del saldo de tu cuenta HTX para tradear sin problemas.Terceros: hemos agregado métodos de pago populares como Google Pay y Apple Pay para mejorar la comodidad.P2P: tradear directamente con otros usuarios en HTX.Over-the-Counter (OTC): ofrecemos servicios personalizados y tipos de cambio competitivos para los traders.Paso 3: guarda tu The Open Network (TON)Después de comprar tu The Open Network (TON), guárdalo en tu cuenta HTX. Alternativamente, puedes enviarlo a otro lugar mediante transferencia blockchain o utilizarlo para tradear otras criptomonedas.Paso 4: tradear The Open Network (TON)Tradear fácilmente con The Open Network (TON) en HTX's mercado spot. Simplemente accede a tu cuenta, selecciona tu par de trading, ejecuta tus trades y monitorea en tiempo real. Ofrecemos una experiencia fácil de usar tanto para principiantes como para traders experimentados.

537 Vistas totalesPublicado en 2024.12.10Actualizado en 2026.06.02

Cómo comprar TON

Discusiones

Bienvenido a la comunidad de HTX. Aquí puedes mantenerte informado sobre los últimos desarrollos de la plataforma y acceder a análisis profesionales del mercado. A continuación se presentan las opiniones de los usuarios sobre el precio de TON (TON).

活动图片