Perspective: Tokens on alt.fun are double-layered leverage

marsbitPublicado a 2026-05-18Actualizado a 2026-05-18

Resumen

**Title:** Tokens on alt.fun are Double-Layered Leverage **Summary:** Tokens on alt.fun (like ALT) are not simple 5x leveraged bets on HYPE. Instead, they represent a **double layer of leverage**. The core mechanism involves HyperSwap V2 pools. After "graduation," these tokens are paired not with USDC, but with **HYPE5L**—a 5x long leverage token (LT) issued by BounceTech that tracks HYPE. Therefore, an alt.fun token's price in USDC is determined by multiplying two independent factors: 1. **AMM Exchange Rate:** The pool's ratio between the alt token and HYPE5L, driven by trading activity on alt.fun. 2. **LT Net Asset Value (NAV):** HYPE5L's value, which moves at approximately 5x the daily return of HYPE. This creates a compounding effect: * If HYPE rises 1%, HYPE5L's NAV rises ~5%. Profit-taking HYPE5L holders may then buy alt tokens, increasing demand and pushing the AMM exchange rate higher. The alt token's total gain thus exceeds 5%, potentially reaching 8-15%. * Conversely, if HYPE falls, losses are amplified beyond 5x due to combined NAV decline and AMM selling pressure. During crashes, large sell orders may fail due to non-atomic redemption paths, potentially trapping later sellers. In contrast, platforms like pump.fun pair tokens with stable assets like SOL, applying only the AMM amplifier to a 1x underlying asset. Alt.fun's use of a pre-leveraged quote asset (HYPE5L) fundamentally shifts the risk profile, creating a **second-order product with floating, of...

Author:798.eth

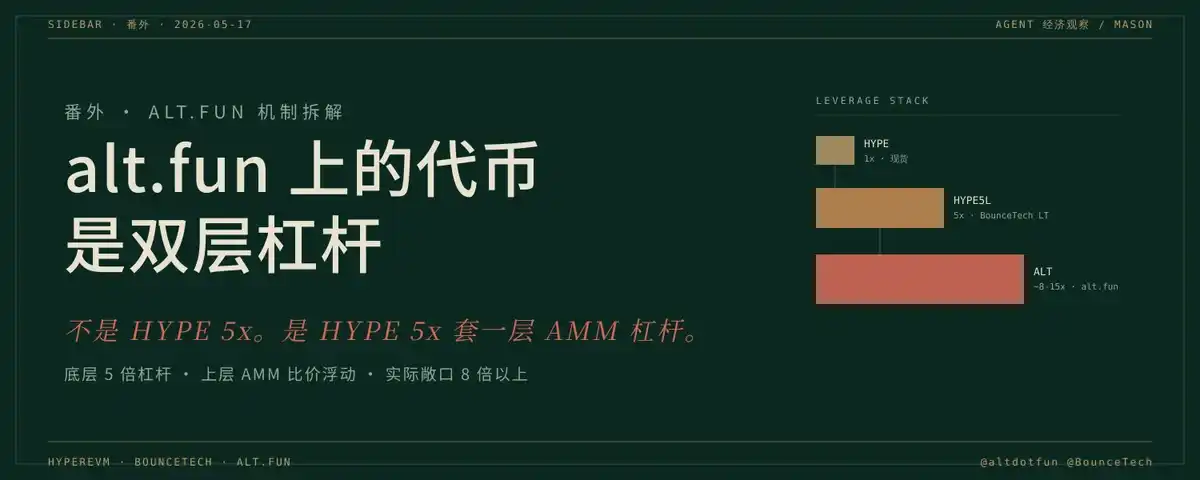
The alt tokens on alt.fun are not 5x leverage on HYPE. They are 5x leverage on HYPE with an additional layer of AMM leverage stacked on top.

This isn't obvious intuitively. You'll understand after reviewing the mechanism. First, let's look at current data for reference.

HYPE spot price is 42.84 USDC.

HYPE5L (the HYPE 5x long leverage token LT issued by BounceTech) has a current NAV of 0.870 USDC, which is a 13% decay from its issue price of 1 USDC.

In the HyperSwap V2 pool for the alt.fun flagship token ALT, there are 18.58 million ALT tokens and 129,400 HYPE5L tokens. 1 ALT equals 0.00697 HYPE5L. Converted to USDC price, that's 0.00606. The USDC price of ALT is the product of two things.

Note: After graduation, the pool contains no USDC; the paired asset is HYPE5L LT. This is the starting point for all understanding.

ALT's USDC price = The exchange rate of ALT to HYPE5L in the pool multiplied by HYPE5L's current NAV.

The first factor is the AMM price ratio. The fewer ALT and more HYPE5L in the pool, the higher the ratio, meaning ALT is more expensive. The opposite makes it cheaper. This factor is determined by buy/sell pressure and is unrelated to the HYPE price.

The second factor is the LT's Net Asset Value. When HYPE rises 1%, HYPE5L's NAV rises approximately 5%, and vice versa. This factor is determined by BounceTech's actual perp position on Hyperliquid and is unrelated to trading activity on alt.fun.

These two factors are independent. Multiply them together to get ALT's final USDC price.

Why this constitutes double-layered leverage.

HYPE rises 1%.

The second layer (LT) amplifies it to 5%. HYPE5L NAV rises 5%.

The first layer (AMM) will amplify further. When HYPE5L rises, holders who are making money may go to alt.fun to buy more alt tokens (leveraged exposure plus alt narrative exposure). This buying increases HYPE5L in the pool and decreases ALT, causing the AMM price ratio to rise. The same 1% HYPE increase is amplified once more in the AMM layer.

Ultimately, ALT's USDC price increase will likely be between 8% and 15%, depending on AMM pool depth and buying intensity. But it will always be greater than 5%.

The same logic applies in reverse when the price falls. If HYPE falls 1%, HYPE5L falls 5%, alt holders see amplified losses, and some start selling ALT for HYPE5L to redeem. Selling pressure pushes down the AMM price ratio, likely causing ALT's USDC price to fall between 8% and 15%.

When falling, there's also an asymmetric effect. The alt.fun docs themselves warn that large sell orders may revert due to the path not being atomic (the path from alt to HYPE5L to USDC redemption; if the order is large, the LT redemption on BounceTech's side can't handle it). This means when the pool is thin, retail investors wanting to stop losses can't. The first ones out sell at high prices, later ones at lower prices, and those after get stuck in the contract.

The five alt tokens backed by HYPE5L—ALT, HBULL, HYPE Life, BALD, HLC—are now all graduated. Every trade they make on HyperSwap V2 moves the AMM price ratio. Simultaneously, the HYPE price moves the HYPE5L NAV. The two layers stack.

HYPE5L is an LT issued by BounceTech. Theoretically 5x exposure, but due to frequent rebalancing, it suffers from volatility decay. In ranging markets, actual exposure is less than 5x; in trending markets, it's more than 5x.

So when you open the alt.fun UI and see an alt token labeled "HYPE 5x Long," the USDC price displayed in the UI is the result of the HYPE price being amplified by BounceTech's 5x leverage, then amplified again by the HyperSwap V2 AMM. You think you're buying 5x exposure to HYPE, but you're actually buying a floating exposure of 8x to 15x.

This floating exposure makes you earn much more than 5x when prices rise, and lose much more than 5x when prices fall. This is the full meaning of double-layered leverage.

Comparing with pump.fun makes it clearer.

Tokens on pump.fun are paired with SOL. SOL is a 1x exposure spot asset. If SOL falls 10%, a pump.fun token's USDC price falls 10% plus the AMM selling pressure, roughly 15% to 25%. The AMM is an amplifier, but the underlying asset has no leverage.

Tokens on alt.fun are paired with HYPE5L. HYPE5L is already a 5x exposure derivative. If HYPE falls 10%, HYPE5L falls 50%, and an alt token's USDC price falls 50% plus the AMM selling pressure, roughly 60% to 80%. The AMM is an amplifier, but the underlying asset itself already carries 5x leverage.

Both are launchpads, both use AMM pairing, but alt.fun, by changing the quote asset, pulls the overall risk curve to a completely different magnitude. This is not prominently highlighted anywhere on the alt.fun UI.

A final word for retail investors.

You open alt.fun, see a token labeled "HYPE 5x Long," and intuitively think this is 5x leveraged exposure to HYPE. That intuition is wrong.

The underlying leverage is 5x. The AMM layer adds another 1x to 2x of floating exposure. In trending markets, you outperform 5x by a lot. In ranging markets, volatility decay eats away at you. During a crash, large sells won't go through; early sellers exit at high prices, later ones get stuck in the contract.

This is not HYPE 5x long. It's a second-order product: HYPE 5x long wrapped in a layer of AMM leverage.

Not investment advice, just trying to figure things out clearly.

Preguntas relacionadas

QAccording to the author, why is the alt token on alt.fun considered a double-layer leverage?

AThe author explains that the alt token is backed by HYPE5L (a 5x leveraged token) in its liquidity pool. This creates a two-layer effect: First, HYPE5L provides ~5x exposure to HYPE's price movements. Second, buying and selling pressure on the alt.fun AMM further amplifies the alt token's price relative to HYPE5L's NAV. This results in a total leverage that fluctuates, often between 8x to 15x, rather than a fixed 5x.

QWhat are the two independent factors that determine the USDC price of an alt token like ALT on alt.fun?

A1) The AMM exchange rate: The ratio between the alt token (e.g., ALT) and its paired asset (HYPE5L) in the HyperSwap V2 pool. This rate changes based on trading activity on alt.fun. 2) The NAV (Net Asset Value) of HYPE5L: The underlying value of the 5x leveraged token from BounceTech, which moves based on HYPE's price on Hyperliquid. The final USDC price is the product of these two factors.

QHow does the risk profile of an alt.fun token differ from a pump.fun token, according to the article?

AThe article states that pump.fun tokens are paired with SOL, which has 1x spot exposure. A drop in SOL leads to a drop in the token's USDC price plus AMM selling pressure. In contrast, alt.fun tokens are paired with HYPE5L, a 5x leveraged derivative. Therefore, a drop in HYPE leads to a magnified drop in HYPE5L's NAV (e.g., -50% for a -10% HYPE move), which is then further amplified by AMM selling pressure on alt.fun. This results in a significantly higher risk profile for alt.fun tokens.

QWhat potential issue does the article highlight for users trying to sell their alt tokens during a market downturn?

AThe article points out an asymmetric risk during downturns. Large sell orders may fail (revert) because the exit path is not atomic: selling alt for HYPE5L and then redeeming HYPE5L for USDC. If the sell pressure is high, BounceTech's redemption mechanism for the leveraged token (LT) might not be able to handle it. This means early sellers get out at a higher price, later sellers at a lower price, and some users may get stuck in the contract, unable to sell at all.

QWhat misconception does the author warn retail users about regarding the 'HYPE 5x Long' label on alt.fun?

AThe author warns that the intuitive understanding of a 'HYPE 5x Long' token is incorrect. It is not simply a 5x leveraged exposure to HYPE. Instead, it is a second-order product: a 5x leveraged token (HYPE5L) wrapped with an additional layer of variable leverage from the alt.fun AMM dynamics. The actual leverage fluctuates, often exceeding 5x, which is not clearly communicated on the platform's user interface.

Lecturas Relacionadas

STRC Breaks Below $95: Why Does It Continue to Depeg? Is There Default Risk?

"STRC Falls Below $95: Why the Persistent Depegging and Is There Default Risk?" The article discusses the recent decline in the price of STRC, a perpetual preferred stock issued by Strategy (MSTR) designed to trade around a $100 par value. As of publication, STRC traded at $94.65, raising market concerns. STRC is described as a high-yield cash flow product, offering an 11.50% annual dividend paid monthly. Its "preferred" status grants it priority over common stock for dividends and in liquidation. Key reasons cited for the price depegging include: 1. **Bitcoin's Price Drop:** MSTR's assets are heavily tied to Bitcoin (BTC), which fell over 21% from its recent high, pressuring all Strategy-related products. 2. **Competitive Pressure:** Rival Strive Asset Management's similar product, SATA, offers daily dividends and has maintained its $100 par value with a ~13% yield. In response, Strategy has proposed changing STRC's dividend frequency from monthly to bi-weekly, pending shareholder vote. 3. **Technical Selling:** A break below $100 may have triggered algorithmic selling and stop-losses, exacerbating the decline. Regarding default risk, the analysis suggests it is currently low. Strategy founder Michael Saylor confirmed the June 2026 dividend rate remains at 11.50% with no cuts or suspensions. The company's massive reserve of 843,706 BTC provides a significant backstop for its obligations. Industry opinions are mixed. Some analysts view the BTC holdings as reliable support for dividends, while critics like Peter Schiff warn of potential dividend cuts leading to price crashes and lawsuits. Others highlight inflation risk and the company's ability to reduce dividends without a formal default. In summary, STRC's drop is attributed to BTC volatility, competition, and technical factors. While immediate default risk appears contained, the product faces challenges from market conditions and competitive dynamics.

marsbitHace 29 min(s)

STRC Breaks Below $95: Why Does It Continue to Depeg? Is There Default Risk?

marsbitHace 29 min(s)

AI Trading Cools, South Korean Stocks Plunge 1.8%, Spot Gold Rises 1%, Bitcoin Dives

A sell-off in AI-related stocks, triggered by Broadcom's disappointing earnings forecast, sent shockwaves through global markets. South Korea's KOSPI led Asia's decline, plunging 1.8% as the risks from concentrated chip stock gains and surging leveraged investments came to the fore. The tech-heavy Nasdaq 100 futures fell 0.5% following Broadcom's 14% after-hours plunge, which signaled a slower-than-expected transition to AI clients. This pullback extended Wall Street's weakness, halting the S&P 500's nine-day rally amid hawkish Fed signals and renewed Middle East tensions. South Korean authorities convened an emergency meeting, pledging "immediate measures" against market volatility and warning of record-high stock margin debt. The adjustment rippled across assets: Bitcoin fell to around $64,000, its lowest since February, while safe-haven gold rose 1% on bargain hunting. Oil prices dipped on Middle East ceasefire news. Market analysts noted the sell-off was driven by profit-taking after massive gains, particularly in chip stocks like Samsung and SK Hynix, which now dominate the KOSPI. Wall Street banks are divided on Korea's outlook, with Goldman Sachs raising its target while Citigroup and others warn of overvaluation and a potential bubble. Bridgewater's Ray Dalio noted that great technological shifts often create bubbles. Meanwhile, Fed officials' hints at potential future rate hikes added to the cautious mood ahead of key U.S. jobs data.

华尔街日报Hace 55 min(s)

AI Trading Cools, South Korean Stocks Plunge 1.8%, Spot Gold Rises 1%, Bitcoin Dives

华尔街日报Hace 55 min(s)

Seeking Alpha's Hot Article: Why Might the U.S. Stock Market Crash in June?

In a recent Seeking Alpha article, financial professor and analyst Damir Tokic argues that the US stock market may be poised for a significant crash in June 2026. The core thesis centers on a "mega-bubble" in equities, particularly within the technology sector, which has driven the S&P 500 to near-record valuations, with a Shiller P/E ratio exceeding 40—a level comparable to the 2000 dot-com bubble. Tokic identifies two primary catalysts for a potential collapse. First, he points to unsustainable market exuberance fueled by what he terms the "Trump Stimulus"—massive AI capital expenditure by tech giants, which he believes is politically driven and cannot last. Second, and more urgently, he highlights the escalating Iran war as a critical threat. The ongoing closure of the Strait of Hormuz has created a severe global energy supply crunch. Strategic petroleum reserves are projected to hit critically low operational levels by June, potentially causing oil prices to spike above $200 per barrel and triggering a severe, supply-driven inflationary shock. This scenario, Tokic warns, would force the Federal Reserve's hand. Despite currently maintaining a dovish bias, the Fed would likely be compelled to officially pivot to a hawkish stance at its June FOMC meeting to combat soaring inflation and bond yields. He contends that such a shift—or even a failure to act, which would destroy Fed credibility—could be the trigger that punctures the market bubble. The resulting downturn, he concludes, could rival the bear markets of 2000 and 2008, advising investors to prepare for a major correction.

marsbitHace 1 hora(s)

Seeking Alpha's Hot Article: Why Might the U.S. Stock Market Crash in June?

marsbitHace 1 hora(s)

Trading

Spot
Futuros

Artículos destacados

Cómo comprar HYPE

¡Bienvenido a HTX.com! Hemos hecho que comprar Hyperliquid (HYPE) sea simple y conveniente. Sigue nuestra guía paso a paso para iniciar tu viaje de criptos.Paso 1: crea tu cuenta HTXUtiliza tu correo electrónico o número de teléfono para registrarte y obtener una cuenta gratuita en HTX. Experimenta un proceso de registro sin complicaciones y desbloquea todas las funciones.Obtener mi cuentaPaso 2: ve a Comprar cripto y elige tu método de pagoTarjeta de crédito/débito: usa tu Visa o Mastercard para comprar Hyperliquid (HYPE) al instante.Saldo: utiliza fondos del saldo de tu cuenta HTX para tradear sin problemas.Terceros: hemos agregado métodos de pago populares como Google Pay y Apple Pay para mejorar la comodidad.P2P: tradear directamente con otros usuarios en HTX.Over-the-Counter (OTC): ofrecemos servicios personalizados y tipos de cambio competitivos para los traders.Paso 3: guarda tu Hyperliquid (HYPE)Después de comprar tu Hyperliquid (HYPE), guárdalo en tu cuenta HTX. Alternativamente, puedes enviarlo a otro lugar mediante transferencia blockchain o utilizarlo para tradear otras criptomonedas.Paso 4: tradear Hyperliquid (HYPE)Tradear fácilmente con Hyperliquid (HYPE) en HTX's mercado spot. Simplemente accede a tu cuenta, selecciona tu par de trading, ejecuta tus trades y monitorea en tiempo real. Ofrecemos una experiencia fácil de usar tanto para principiantes como para traders experimentados.

194 Vistas totalesPublicado en 2024.12.11Actualizado en 2026.06.02

Cómo comprar HYPE

Discusiones

Bienvenido a la comunidad de HTX. Aquí puedes mantenerte informado sobre los últimos desarrollos de la plataforma y acceder a análisis profesionales del mercado. A continuación se presentan las opiniones de los usuarios sobre el precio de HYPE (HYPE).

活动图片