If U.S. Treasury Yields Soar Above 5%, Will Bitcoin Fall Below $50,000?

marsbitPublicado a 2026-03-25Actualizado a 2026-03-25

Resumen

An article explores the potential impact of rising U.S. Treasury yields above 5% on Bitcoin's price, suggesting it could fall below $50,000. The analysis is prompted by the recent U.S.-Israel conflict with Iran, which has driven oil prices higher and fueled inflation fears, pushing bond yields up. Historically, prolonged oil-related conflicts lead to sustained yield increases and pressure on risk assets like stocks. Given Bitcoin's high correlation with the S&P 500, similar downward pressure is expected. Technical analysis indicates a bearish flag pattern for Bitcoin, with a break below it potentially leading to a drop to $50,000 or lower. Prediction markets also show a high probability of Bitcoin falling below $55,000 in 2026. However, BitMEX co-founder Arthur Hayes notes that prolonged conflict might force the Fed to print more money, which could ultimately benefit Bitcoin.

Written by: Cointelegraph

Compiled by: AiddiaoJP, Foresight News

During the war between the U.S. and Iran, Bitcoin has been one of the strongest performing assets. However, as the bond market shows signs of being 'out of control,' Bitcoin's upward momentum is beginning to show signs of exhaustion.

Key Points:

  • If the U.S.-Iran war prolongs, the benchmark U.S. Treasury yield could rise by 200 basis points.
  • Historical experience suggests that oil-related conflicts tend to push up inflation and suppress risk appetite. Based on this, it is speculated that Bitcoin's price could fall below $50,000 in 2026.

Oil Supply Shock Could Push U.S. Treasury Yields Above 5%

Since the U.S. and Israel launched attacks on Iran on February 28, the benchmark 10-year U.S. Treasury yield has climbed to about 4.42%, hitting a nine-month high.

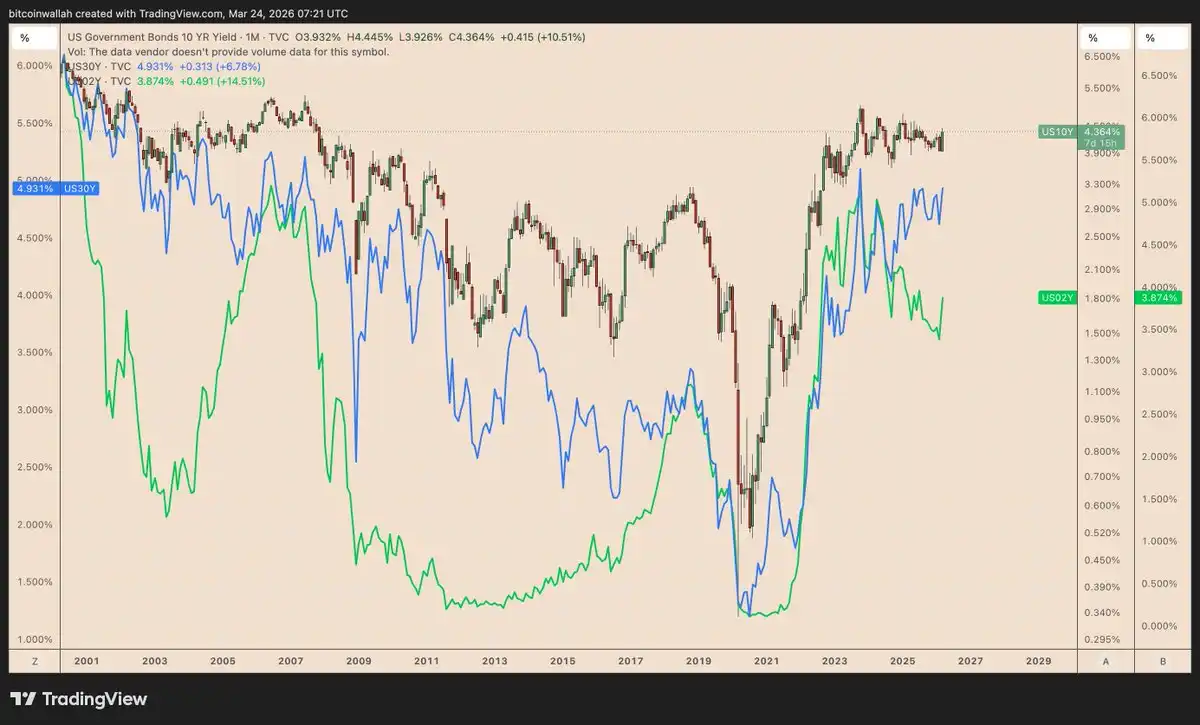
Monthly performance of U.S. 2-year, 10-year, and 30-year Treasury yields. Source: TradingView

Among them, the 30-year Treasury yield rose to about 4.97%, and the 2-year Treasury yield also increased to the range of 3.95% to 3.98%.

Affected by the war, oil prices have surged, exacerbating market concerns about rising inflation, thereby pushing Treasury yields higher. Against this backdrop, the market widely expects no rate cuts within 2026.

U.S. President Donald Trump announced a five-day suspension of operations, temporarily alleviating immediate concerns about strikes on Iranian energy facilities. However, as Iran denies any negotiations and cross-border attacks continue as of Tuesday, the conflict situation remains effectively uncontrolled.
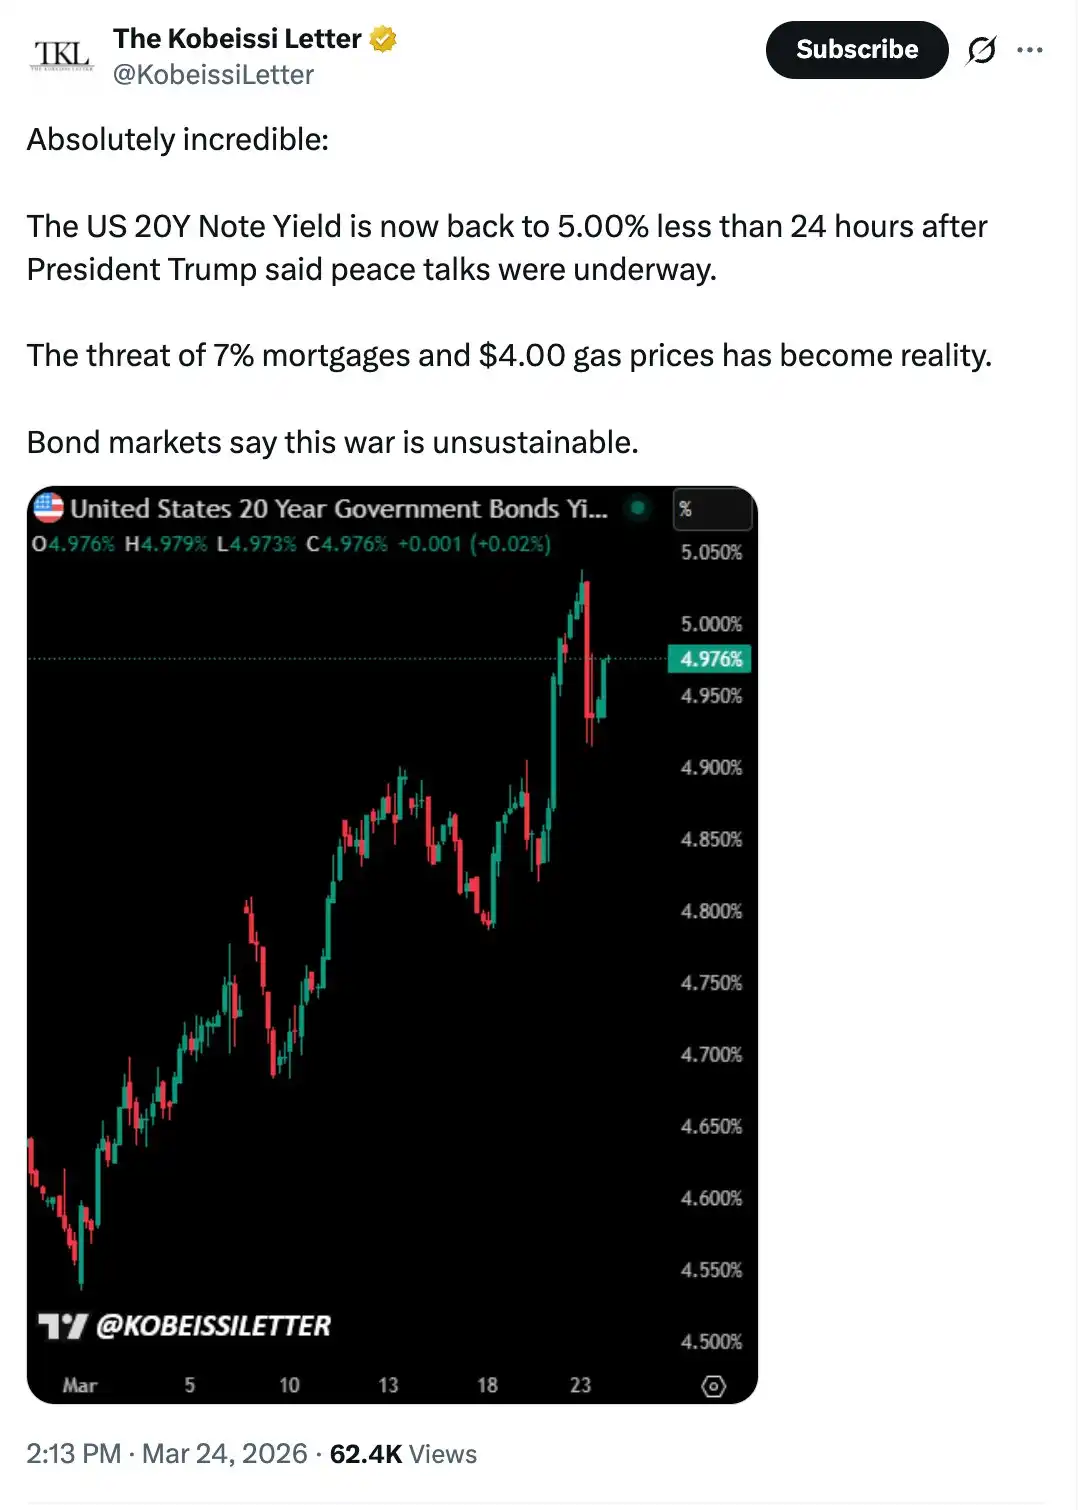
Source: X

Market observers have expressed concerns, believing that U.S. Treasury yields face further upside risks. Technical analysts further pointed out that if the 10-year Treasury yield breaks through the current symmetrical triangle pattern, it could rise by 200 basis points to 6.4%.

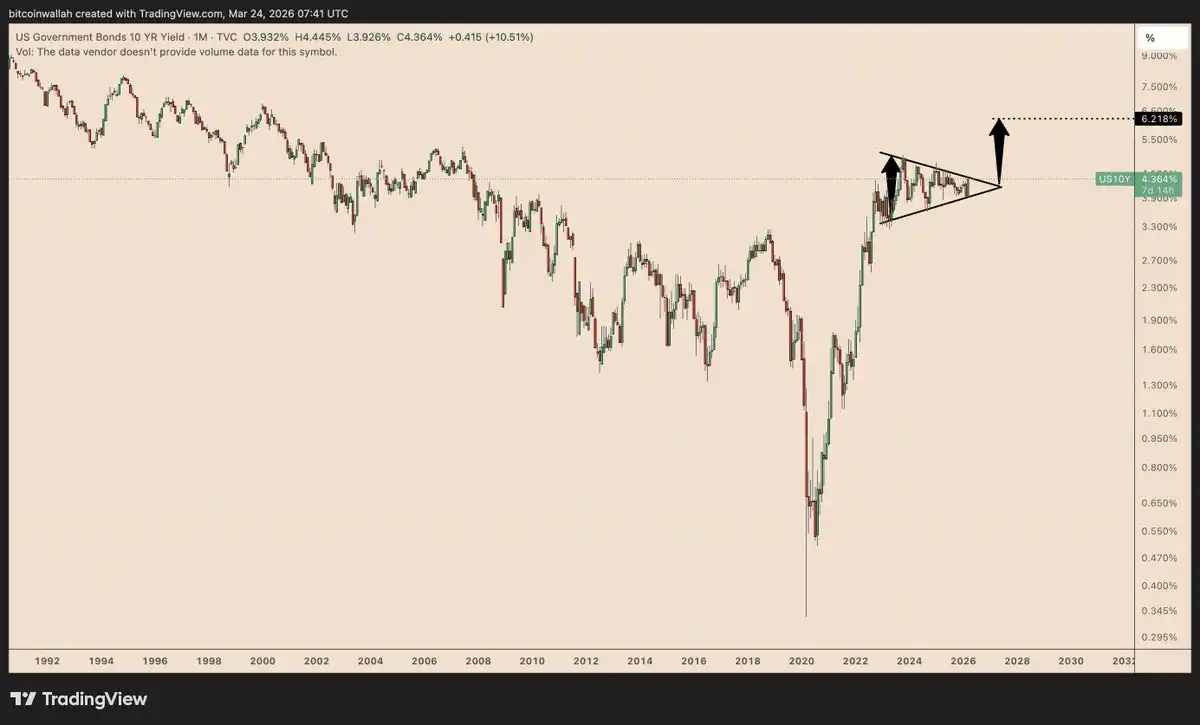
Monthly chart of U.S. 10-year Treasury yield. Source: TradingView

Rising yields increase the opportunity cost of holding risk assets such as stocks and Bitcoin. If Bitcoin continues to exhibit risk asset attributes, a break above 5% in the 10-year Treasury yield could trigger selling pressure in the Bitcoin market.

Historical Cases of Oil-Related Shocks

Historically, short-term oil-related conflicts typically cause sharp but brief fluctuations in Treasury yields and stock markets, while long-term supply shocks can push yields up persistently and suppress stock markets continuously.

During the 1973 Yom Kippur War and the Arab oil embargo, Treasury yields initially rose slightly, then climbed significantly as inflation intensified, with the S&P 500 index falling about 41% to 48% during the 'stagflation' phase.

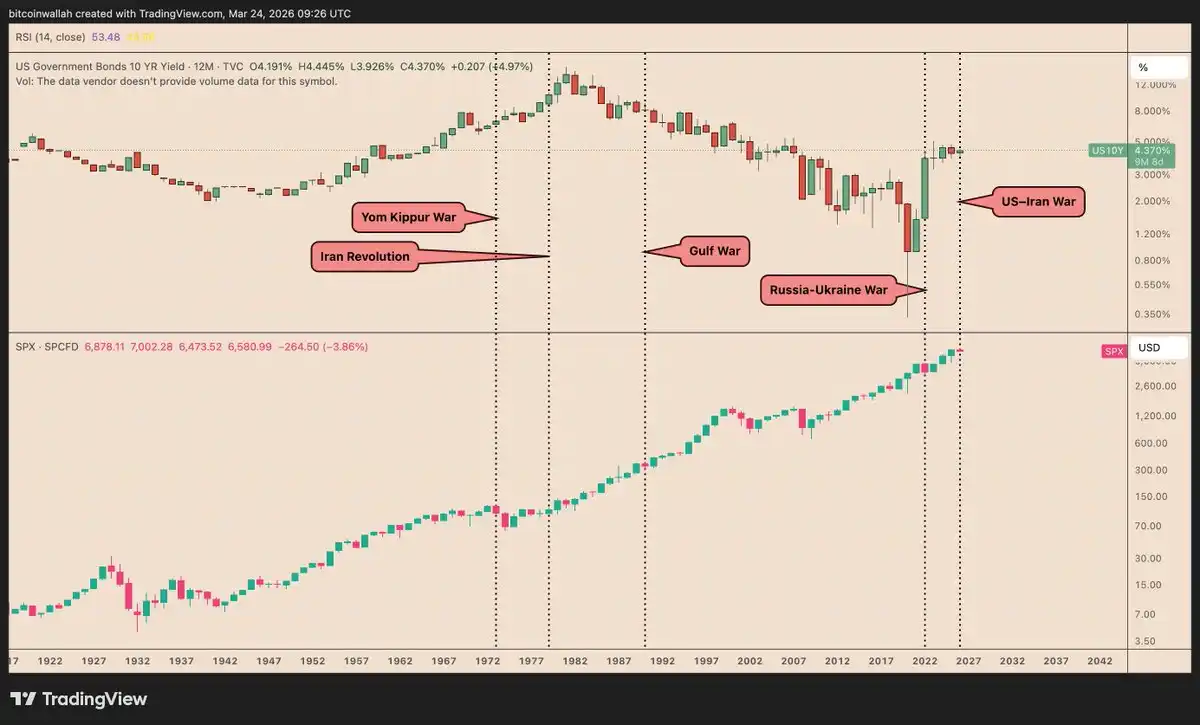
Annual chart of U.S. 10-year Treasury yield and S&P 500 index. Source: TradingView

During the 1979 Iranian Revolution, the bond market reaction was more intense, with the 10-year Treasury yield rising about 150 to 200 basis points in the following year, while the stock market correction was relatively moderate.

During the 1990-1991 Gulf War, the 10-year Treasury yield rose about 50 to 70 basis points, and the S&P 500 index fell about 16% to 20%, rebounding after the conflict was brought under control.

After the outbreak of the Russia-Ukraine conflict in 2022, there was also a rise in Treasury yields and a short-term drop of 5% to 10% in the S&P 500 index.

The current conflict between the U.S., Israel, and Iran seems to be in the early stages of these historical patterns. If the conflict escalates further and oil prices remain high, Treasury yields could rise further, and risk assets may face a new round of downward pressure.

Bitcoin still maintains a high correlation with the S&P 500 index. Therefore, unless the conflict situation eases quickly, Bitcoin's price is likely to face greater downward pressure.

To What Level Could Bitcoin's Price Drop?

From a technical analysis perspective, if Bitcoin's price breaks below the current bear flag pattern, it could further drop to $50,000 or even lower in the coming months.

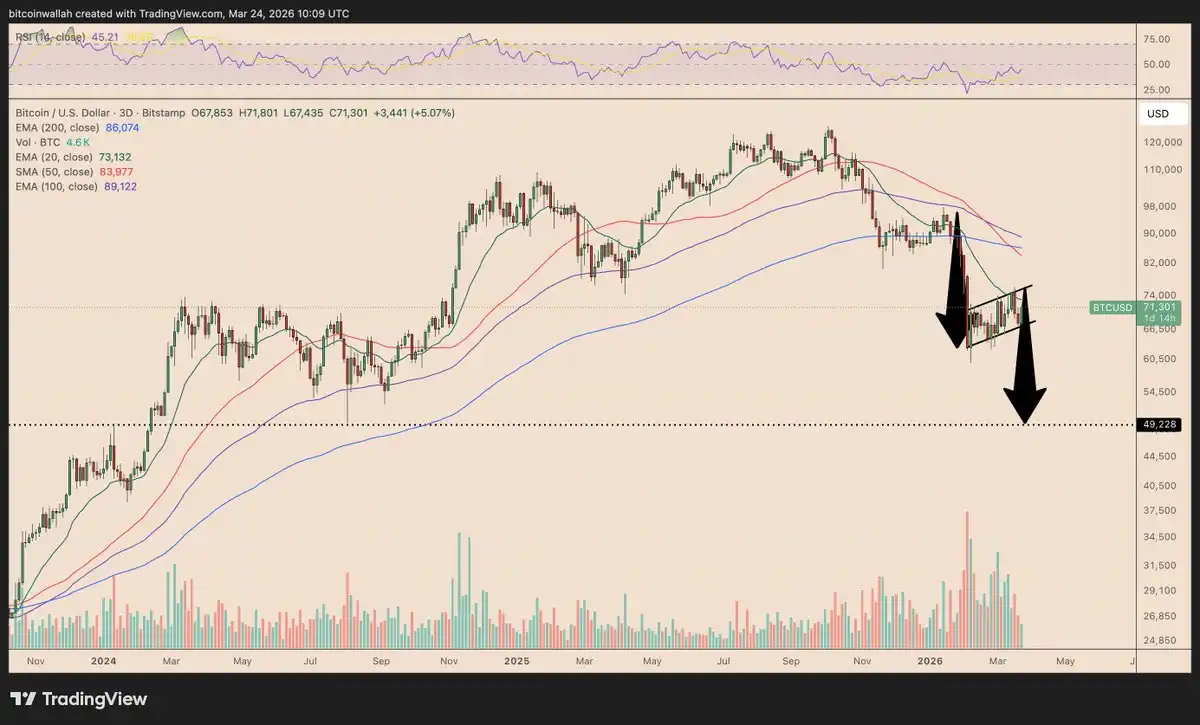
Bitcoin/USD three-day price chart. Source: TradingView

This technical expectation is largely consistent with trading data from prediction markets. Currently, traders estimate a 70% probability that Bitcoin will fall below $55,000 in 2026, and a 46% probability it will fall below $45,000.

BitMEX co-founder Arthur Hayes stated that if the U.S.-Iran war prolongs, it could force the Federal Reserve to adopt loose monetary policies, which would be a positive factor for Bitcoin.

He noted: 'The longer the conflict lasts, the more likely the Fed is to print money to support the U.S. war machine.' He further added:

'When central banks start printing money, I will choose to buy Bitcoin.'

Preguntas relacionadas

QWhat is the main concern regarding US Treasury yields and Bitcoin's price according to the article?

AThe article suggests that if the US 10-year Treasury yield rises above 5%, it could trigger selling pressure in the Bitcoin market, potentially causing its price to fall below $50,000.

QHow have oil-related conflicts historically impacted Treasury yields and risk assets like stocks?

AHistorically, short-term oil-related conflicts caused sharp but brief volatility in yields and stocks, while prolonged supply shocks led to sustained yield increases and prolonged stock market declines, as seen during the 1973 Yom Kippur War and the 1979 Iranian Revolution.

QWhat technical pattern does the article mention for Bitcoin's price, and what is the predicted downside target?

AThe article mentions a bearish flag pattern for Bitcoin's price. If this pattern breaks down, the price could decline to $50,000 or lower in the coming months.

QAccording to market traders, what is the probability of Bitcoin falling below $55,000 and $45,000 in 2026?

ATraders estimate a 70% probability of Bitcoin falling below $55,000 and a 46% probability of it dropping below $45,000 in 2026.

QWhat contrasting view does BitMEX co-founder Arthur Hayes present regarding the impact of prolonged US-Iran war on Bitcoin?

AArthur Hayes argues that a prolonged US-Iran war could force the Federal Reserve to adopt loose monetary policy and print money, which would ultimately be bullish for Bitcoin as he states, 'When central banks start printing money, I will choose to buy Bitcoin.'

Lecturas Relacionadas

Bitcoin Monthly Chart Adjustment Structure Established, HYPE Entry Opportunity Emerges | Exclusive Analysis

Bitcoin Monthly Correction Structure Confirmed, HYPE Entry Opportunity Emerges | Guest Analysis Last week's analysis correctly identified that the $60,000 level for Bitcoin was an intermediate point, not the bottom of the current correction. This was validated on June 5th when the price broke below this key support, dropping to around $59,100. The monthly-level a-b-c three-wave corrective structure from the October 2025 high of $126,200 is now fully established, with the market currently in the c-wave decline phase. The cumulative adjustment time is less than 35 days, indicating the structure is far from complete. This week's focus will be tracking the rebound's strength and resistance performance. The two key resistance zones of $65,000 and $69,500~$70,500 will be crucial observation points for determining the subsequent trend. For HYPE, last week's top warning signal was also validated, with the price falling up to 27% from its $75.87 high. The token has now entered a support zone, presenting a potential short-term entry opportunity. From a strategic standpoint, the medium-term outlook remains bearish, awaiting optimal timing to add short positions upon a rebound. **Key Trading Views Summary:** * **BTC:** The analysis maintains a bearish medium-term bias. Strategy involves building short positions on rebounds towards $65,000 or the $69,500~$70,500 resistance area. A break below the $59,000-$60,000 support could trigger additional short entries. Short-term trading (30% capital) focuses on range-bound opportunities. * **HYPE:** Following a confirmed correction from the $75.87 high, the short-term strategy shifts to "buying on dips." Consider light long positions (under 30%仓位) if the price finds support and shows stabilization signals in the $55-$57 or deeper $47-$49 support zones, contingent on confirming technical signals. The key resistance to watch is the $62.5-$64.57 area. **Risk Management Reminder:** Always set an initial stop-loss immediately upon opening a position. Move the stop-loss to breakeven upon achieving 1% profit, and subsequently trail it to lock in gains. Market conditions change rapidly; this analysis is for informational purposes only and not investment advice.

marsbitHace 17 min(s)

Bitcoin Monthly Chart Adjustment Structure Established, HYPE Entry Opportunity Emerges | Exclusive Analysis

marsbitHace 17 min(s)

Valuation Surpasses 200 Billion, Kimi Reportedly Raises 13.6 Billion More, Speeds Up Hong Kong IPO

Beijing-based AI unicoth MoonDark (Kimi) is reportedly in talks for a new funding round aiming to raise up to $20 billion (approximately RMB 136 billion), targeting a post-money valuation of $300 billion (approximately RMB 2.035 trillion). If successful, this would mark its third round in six months and a six-fold increase from its $43 billion valuation in December last year. Last month, the company completed a $20 billion funding round led by Meituan Longzhu, reaching a valuation exceeding $200 billion. According to reports, MoonDark has raised over RMB 376 billion across six rounds, making it the most funded large language model startup in China. Founded in 2023 by CEO Yang Zhilin, the company's core product is the Kimi AI Assistant. In April, it launched and open-sourced its flagship model, Kimi K2.6, which has demonstrated performance comparable to top models like GPT-5.4 in certain benchmarks. Recently, it began beta testing for Kimi Work, a local AI agent for knowledge workers. Commercially, the company's Annual Recurring Revenue (ARR) reportedly surpassed $2 billion in April. Regarding its IPO plans, Bloomberg reported in March that MoonDark is preparing for a listing in Hong Kong, though the process remains in early stages. The funding and IPO pace for leading Chinese AI firms has accelerated notably in 2026, mirroring global trends where companies like OpenAI and Anthropic are also setting new fundraising and valuation records. Securing substantial capital is becoming a critical factor in the competitive landscape alongside model capabilities.

marsbitHace 20 min(s)

Valuation Surpasses 200 Billion, Kimi Reportedly Raises 13.6 Billion More, Speeds Up Hong Kong IPO

marsbitHace 20 min(s)

South Korea's KOSPI Plunges 8.37% at Opening, Triggers Circuit Breaker: The 'Two Stocks' That Powered the Bull Market Recoil in a Single Day

On June 8th, South Korea's KOSPI index plunged 8.37% within minutes of market open, triggering a circuit breaker and halting trading. The crash was driven by a massive sell-off in heavyweight stocks Samsung Electronics and SK Hynix, which each fell 10%. These two chip giants alone account for over half of the KOSPI's total market capitalization and had contributed roughly 70% of the index's gains year-to-date, pushing it to become the world's sixth-largest stock market. The sell-off was ignited by negative guidance from U.S. chipmaker Broadcom on June 3rd, which sparked a global semiconductor stock rout. This shockwave hit South Korean markets on June 5th, with foreign investors leading a sustained exodus. The sharp decline on June 8th was exacerbated by high levels of retail margin debt (over 38 trillion KRW), forced liquidations, leveraged ETFs tied to the top stocks, and automated program trading, creating a vicious cycle. The Korean won also weakened significantly, further fueling foreign capital outflow. South Korean authorities issued emergency statements to calm markets, echoing recent warnings from the central bank governor about the risks of debt-driven investing. While some institutions like Goldman Sachs maintain long-term bullish targets for the KOSPI, the crash exposed the extreme market concentration and fragility behind its historic rally.

marsbitHace 22 min(s)

South Korea's KOSPI Plunges 8.37% at Opening, Triggers Circuit Breaker: The 'Two Stocks' That Powered the Bull Market Recoil in a Single Day

marsbitHace 22 min(s)

The Compounding Crisis in an Era of High Valuations: Is the US Stock Market Facing a New 'Lost Decade'?

This article analyzes the long-term structural risks in US equity markets, challenging the assumption that "time in the market" always ensures positive returns. Drawing on 155 years of historical data, it identifies three prolonged periods—1929-1954, 1966-1982, and 2000-2013—where real buy-and-hold returns were near zero or negative. Collectively, these "lost decades" represent roughly 35% of market history since 1871 and cause not just delayed wealth accumulation but permanent damage to compound growth paths due to the mathematics of recovering from significant drawdowns. Crucially, the authors argue that current conditions mirror historical precursors to such phases. Multiple valuation indicators, including the CAPE ratio (near its 99th percentile), the Buffett Indicator, and Tobin's Q, signal extreme overvaluation, historically associated with lower future 10-year real returns (averaging 3.6%). The paper debunks the common objection to tactical management—fear of missing the "best days" in the market—by showing that the vast majority of these top-performing days occur during bear markets and crises, often adjacent to the worst days. Therefore, avoiding major drawdowns inherently means missing these volatile surges. A key framework proposed involves monitoring market breadth (advance/decline data), which tends to deteriorate before major indices peak, providing an early warning signal. Combined with high valuations, breadth analysis offers a more robust risk-assessment tool. The conclusion for investors and advisors is not a forecast of an inevitable downturn, but a call to move from complacency to preparedness. The empirical evidence suggests that the conditions preceding lost decades are identifiable. A disciplined, adaptive strategy focused on valuation and breadth signals, rather than precise timing, can help protect long-term compounding from permanent impairment.

marsbitHace 40 min(s)

The Compounding Crisis in an Era of High Valuations: Is the US Stock Market Facing a New 'Lost Decade'?

marsbitHace 40 min(s)

Trading

Spot
Futuros

Artículos destacados

Cómo comprar WAR

¡Bienvenido a HTX.com! Hemos hecho que comprar WAR (WAR) sea simple y conveniente. Sigue nuestra guía paso a paso para iniciar tu viaje de criptos.Paso 1: crea tu cuenta HTXUtiliza tu correo electrónico o número de teléfono para registrarte y obtener una cuenta gratuita en HTX. Experimenta un proceso de registro sin complicaciones y desbloquea todas las funciones.Obtener mi cuentaPaso 2: ve a Comprar cripto y elige tu método de pagoTarjeta de crédito/débito: usa tu Visa o Mastercard para comprar WAR (WAR) al instante.Saldo: utiliza fondos del saldo de tu cuenta HTX para tradear sin problemas.Terceros: hemos agregado métodos de pago populares como Google Pay y Apple Pay para mejorar la comodidad.P2P: tradear directamente con otros usuarios en HTX.Over-the-Counter (OTC): ofrecemos servicios personalizados y tipos de cambio competitivos para los traders.Paso 3: guarda tu WAR (WAR)Después de comprar tu WAR (WAR), guárdalo en tu cuenta HTX. Alternativamente, puedes enviarlo a otro lugar mediante transferencia blockchain o utilizarlo para tradear otras criptomonedas.Paso 4: tradear WAR (WAR)Tradear fácilmente con WAR (WAR) en HTX's mercado spot. Simplemente accede a tu cuenta, selecciona tu par de trading, ejecuta tus trades y monitorea en tiempo real. Ofrecemos una experiencia fácil de usar tanto para principiantes como para traders experimentados.

163 Vistas totalesPublicado en 2024.12.11Actualizado en 2026.06.02

Cómo comprar WAR

Discusiones

Bienvenido a la comunidad de HTX. Aquí puedes mantenerte informado sobre los últimos desarrollos de la plataforma y acceder a análisis profesionales del mercado. A continuación se presentan las opiniones de los usuarios sobre el precio de WAR (WAR).

活动图片