Hold Bitcoin Mid-Term Short Positions, HYPE Successfully Rides the Wave for Profits | Guest Analysis

marsbitPublicado a 2026-03-02Actualizado a 2026-03-02

Resumen

Summary: In this market analysis, Cody, a特邀分析师 for Odaily, reviews the past week's performance and outlines strategies. Bitcoin (BTC) continued its weak consolidation, aligning with the anticipated C-2 wave rebound. A short-term bearish trade (1x leverage) was executed, yielding a 2.12% profit. The medium-term bearish position, initiated at $89,000 (1x leverage), remains open. With BTC closing around $65,770, this position shows an unrealized gain of approximately 26.10%, having reached a maximum floating profit of around 32.58%. The overall technical structure suggests the medium-term downtrend persists, with any rebounds viewed as technical corrections within a larger bearish framework. Key resistance levels are identified at $68,500-$70,000 and $72,300-$74,500, with supports at $65,000, $60,000-$62,500, and $57,400. The strategy advises maintaining a core bearish bias ("sell the rallies"). Conversely, HYPE presented a strong bullish opportunity. Analysis indicates a completed Wave-I rise (from $20.46 to $38.41) followed by a Wave-II correction (to $25.60). The current movement is interpreted as the start of a potent Wave-III drive. A successful short-term long trade (1x leverage) captured an 11.14% gain. Key technical evidence for HYPE's strength includes a break of a long-term descending trendline, robust momentum off the Wave-II low, and quant model signals (momentum and price spread) indicating bottoming and bullish convergence. The primary target for Wave-III is abo...

Hello everyone, I am Cody, a guest analyst for Odaily Planet Daily. Wishing all our reader friends an early Happy Lantern Festival!

Looking back at Bitcoin's performance last week, the overall trend largely followed the established trading framework and rhythm. In terms of short-term strategies, market movements were highly consistent with our short-term judgments, completing one short position trade (1x leverage) based on the short-term trading strategy, achieving a single trade return of approximately 2.12% (see Table 2 for details). Regarding medium-term strategies, Bitcoin continued to follow the previously set mid-term approach, maintaining a short position established at $89,000 (1x leverage). As of last week's close, the price fell to around $65,770, resulting in a paper profit of about 26.10% for this mid-term trade, with a maximum floating profit of around 32.58% during the period.

From a market analysis perspective, Bitcoin continued to trade within a weak range-bound consolidation structure last week, with the pace of movement consistent with the previous judgment of the C-2 wave rebound phase; the nature of the short-term rebound remains unchanged.

Additionally, I remain optimistic about HYPE's trend, so this weekly report continues with a weekly tracking and breakdown of HYPE's multi-cycle price structure. Last week, based on my own short-term structure assessment, I executed one short-term long position trade (1x leverage), achieving a single trade return of approximately 11.14%, with the trading logic and execution results forming a good correlation (see Table 1 for details).

The following will provide a more detailed explanation of the above content, covering market predictions, strategy logic, trade execution, and result review.

I. HYPE Trend – The Prelude to Wave III?

In the weekly review on February 22nd, I first highlighted the investment opportunity in HYPE, clearly stating: its previous downtrend may be reversing, the current market is in the Wave II correction phase following the Wave I rally, and there is potential for an upcoming main upward (Wave III) movement. The core basis is: (see Figure 2)

During the Wave I rally, the price effectively broke through the long-term descending trendline (blue line in the chart) connecting the September 2025 high (approx. $59.48) and the October 2025 high (approx. $50.17);

At the start of Wave I, our self-constructed Momentum Quantification Model issued a daily level momentum divergence signal;

At the start of Wave I, our self-constructed Spread Quantification Model triggered a strong bottom warning signal (white bars in the chart).

It is particularly noted that: the effectiveness of the signals from these two models has been confirmed by the market through the strong upward performance of the price during the Wave I rally.

1. HYPE Short-Term Operation Review (1x Leverage):(02.22~03.01)

Last week, we strictly followed the trading signals issued by our self-constructed Spread Trading Model and Momentum Quantification Model, combined with the prediction of the Wave III main upward movement, to complete one short-term (long) operation, successfully profiting 11.14%.

(See Table 1)

• HYPE Short-Term Trade Details Summary:(Leverage*1x)
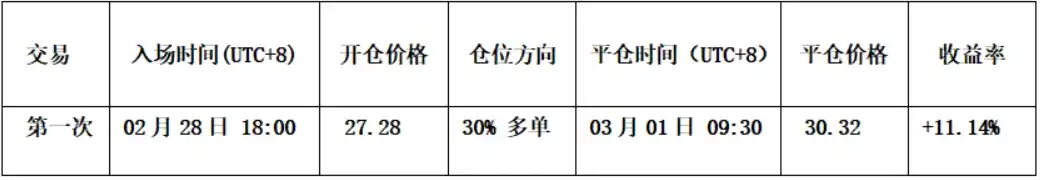
Table 1

• Opening Decision(See Figure 3): Based on the prediction of the main upward movement; simultaneously, the Spread Quantification Model issued multiple bottom warning signals (red dots in the chart), which then formed a bottom resonance signal with the Momentum Quantification Model; and the price broke through and held above a key previous area. Thus, a position was opened (long) at $27.28.

• Closing Decision: The Spread Quantification Model and Momentum Quantification Model issued top resonance signals, so the position was closed around $30.32.

• Trade Summary: This operation successfully captured the upward opportunity in the early stage of Wave III, achieving a profit of approximately 11.14%.

HYPE 30-minute K-line Chart

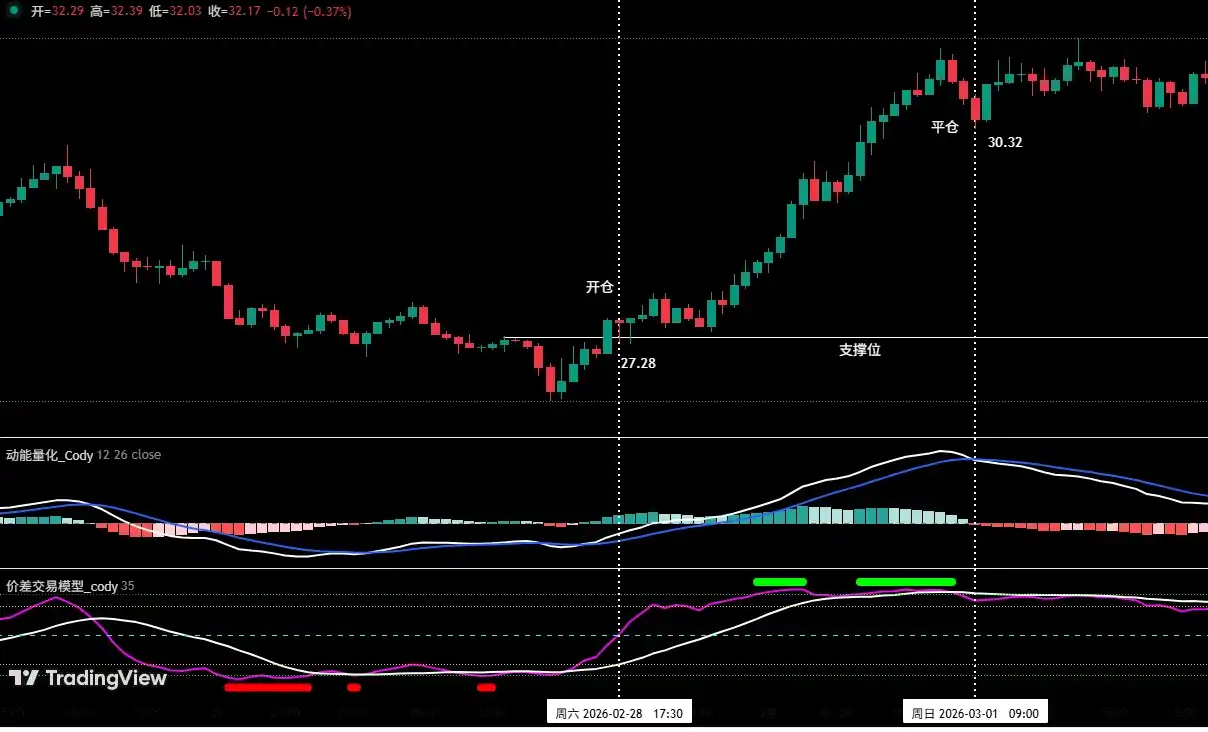
Figure 1 (Short-Term Trade Illustration)

2. Preliminary Division of Daily Level Price Structure:(Based on price action since January 21st)

HYPE Daily K-line Chart
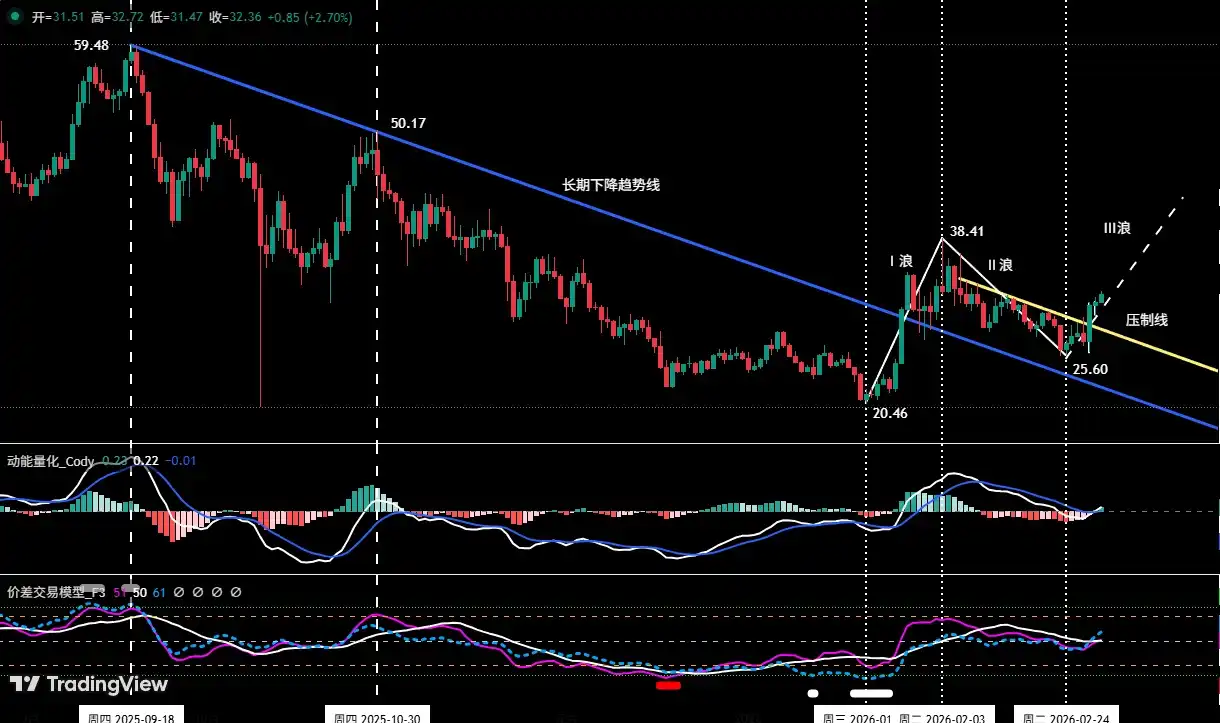
Figure 2

• Wave I (Impulse Wave): Started from the January 21st low of $20.46, ended at the February 3rd high of $38.41. Lasted 14 days, with a maximum gain of 87.73%, constituting the first main impulse wave of this upward cycle.

• Wave II (Corrective Wave): Started from the February 3rd high of $38.41, ended at the February 24th low of $25.60. Lasted 20 days, correcting Wave I, with a maximum drawdown of 33.35%.

• Wave III (Potential Impulse Wave): Initiated from the February 24th low of $25.60, currently in progress. The third impulse wave is often the most explosive.

• Confirmation of Wave III Starting Point Validity: The current price action has shown multiple technical characteristics consistent with the early stages of a strong impulse wave:

a、Break of Key Resistance Line: The price successfully broke through an important resistance line (yellow line in the chart) that had been in place since the Wave II correction, after failing to break it three times consecutively. This marks a shift in the balance of power between bulls and bears.

b、Strong Momentum Validation: The rebound from the February 24th low completely covered the losses of the previous 10 days in just 6 days of gains. Particularly, the large bullish candle on February 28th, with a gain of 14.25%, showed significant strength, fitting the characteristic of strong initial momentum in Wave III.

c、Structural Trend Reversal: The current high price has surpassed two important structural points adjacent to the February 24th low during the Wave II correction, namely the February 21st high of $30.59 and the February 19th low of $27.73. This初步构成了 (initially forms) a "higher high" pattern, meaning the previous downward structure has been基本扭转 (largely reversed).

• Wave III Endpoint Confirmation: The high of Wave III must exceed the Wave I peak of $38.41. Otherwise, this price movement might still be part of a wide range consolidation or a rebound within a downtrend.

3. HYPE 4-Hour Level Detailed Structure

HYPE 4-hour K-line Chart
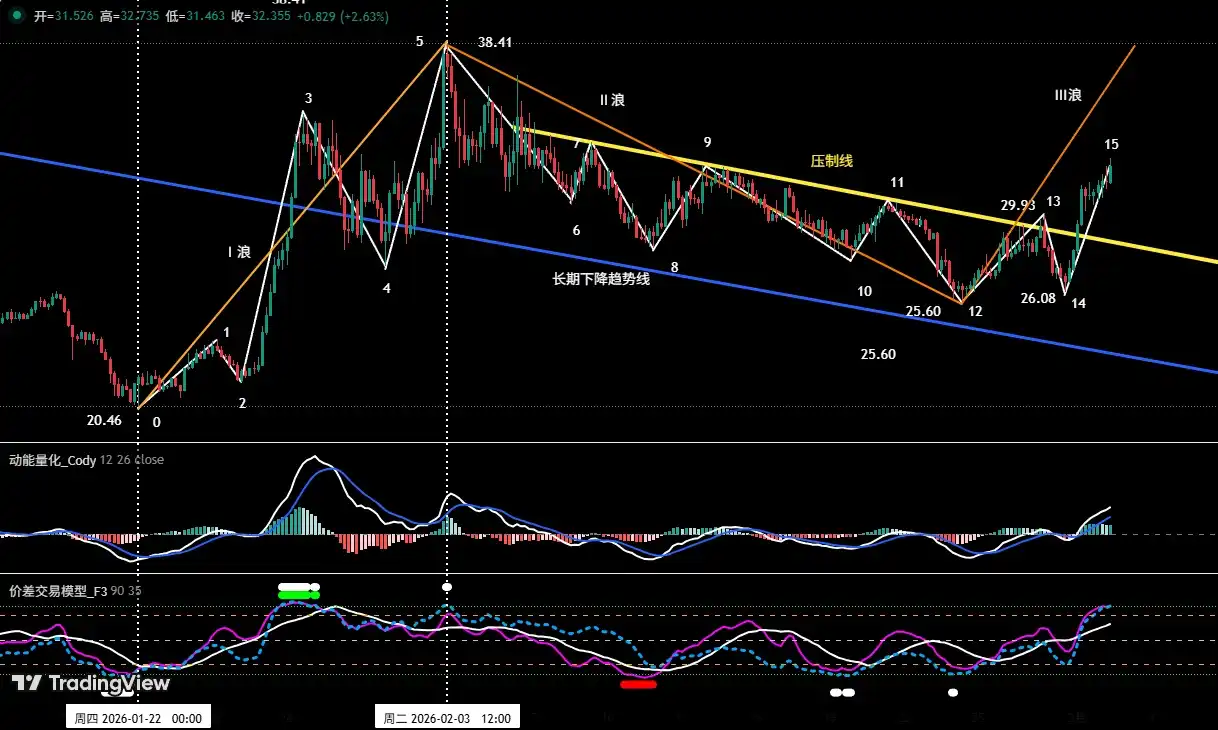
Figure 3

In Figure 3, we further细分 (detail) the wave count from the daily level.

• Wave I Internal Structure: Can be subdivided into 5 upward segments: 0-1, 1-2, 2-3, 3-4, 4-5, forming a complete upward move.

• Wave II Internal Structure: Can be subdivided into 7 corrective segments: 5-6, 6-7, 7-8, 8-9, 9-10, 10-11, 11-12, forming an orderly correction.

• Wave III Internal Structure: Currently in progress. Temporarily can be subdivided into 3 segments: 12-13, 13-14, 14-15, where the 14-15 upward segment is not yet finished.

II. Back to Bitcoin – Mainly Range-Bound Consolidation:(02.22~03.01)

1、Short-Term Operation Strategy Review:(See Table 2)

We strictly followed the trading signals issued by our self-constructed Spread Trading Model and Momentum Quantification Model, combined with market trend predictions, and completed one short-term (short) operation last week, profiting 2.12%.

1、Bitcoin Short-Term Trade Details Summary:(Leverage*1x)
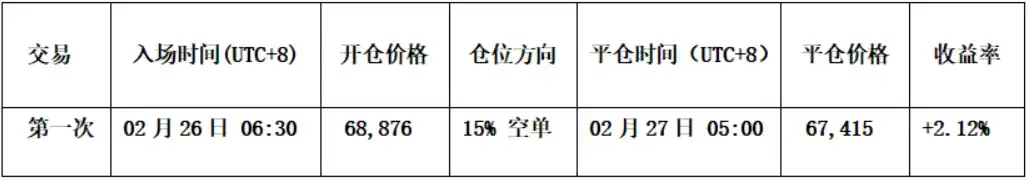
Table 2

2、Short-Term Trade Review:(See Figure 4)

• Opening: Price encountered resistance upon retesting the descending trendline, simultaneously the Spread Trading Model triggered a top warning signal (green dot in the chart),再加上 (coupled with) two model short resonance signals, a 15% short position was established at $68,876.

• Risk Control: Initial stop-loss for the short position set at $72,000.

• Closing: Upon approaching support levels, combined with model bottom resonance signals and candlestick pattern bottom signals, the entire position was liquidated at $67,415.

• Summary: This trade profited 2.12%.

Bitcoin 30-minute K-line Chart:(Momentum Quantification Model + Spread Trading Model)

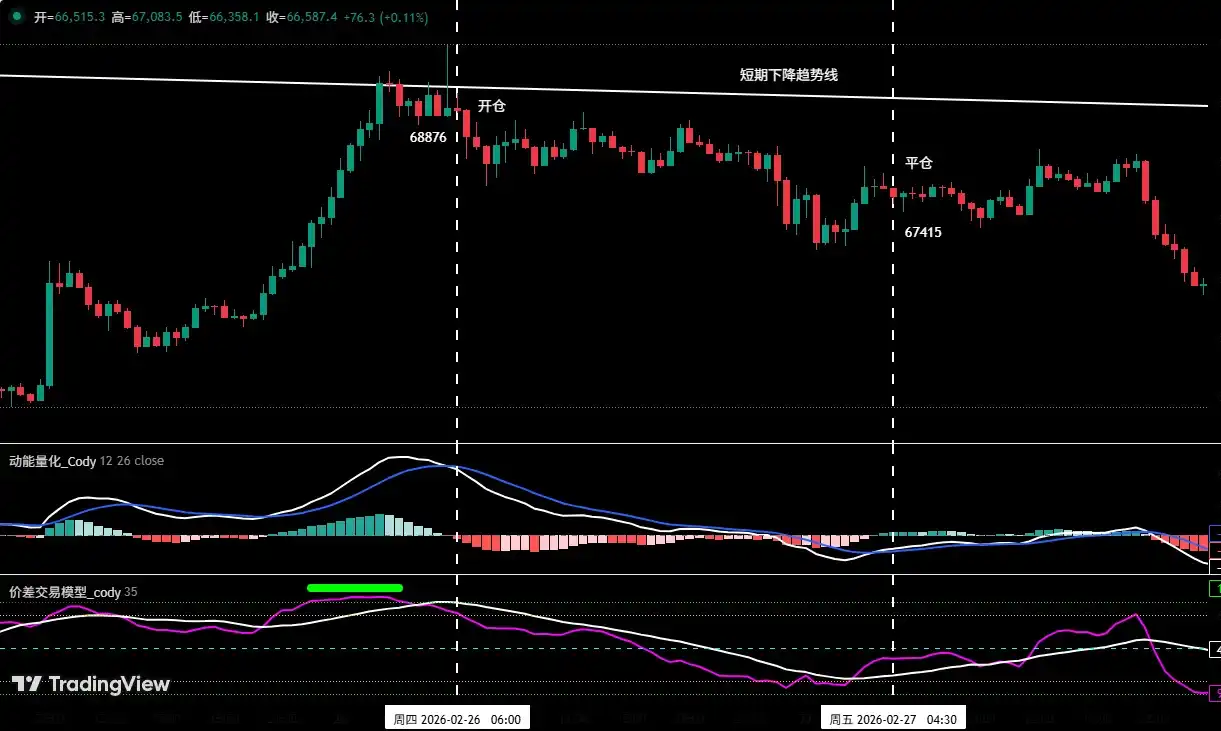
Figure 4 (Short-Term Trade Illustration)

III. Bitcoin Indicator Analysis: Weekly and Daily Comprehensive Judgment

Weekly Level: Mid-Term Bearish Structure Continues

From the weekly structure, the momentum line in the Momentum Quantification Model continues to decline. Although the negative momentum bars have阶段性缩短 (shortened phase-wise), no effective divergence signal has formed yet, indicating the bearish trend hasn't fundamentally changed. The Sentiment Quantification Model shows the market has not entered a明显的超卖恐慌区间 (clear oversold panic zone), conditions for bottom sentiment repair remain insufficient; simultaneously, the Digital Monitoring Model has not given a bottom confirmation signal.

In terms of chart structure, last week's weekly candle closed as a阴线 (bearish candle) with a loss of about 2.76%. The price broke below the previous triangle convergence structure, with the center of gravity明显下移 (clearly moving down). The overall pattern is more characteristic of a下跌中继 (falling mid-way consolidation), indicating the mid-term trend remains weak.

Daily Level: Oversold Rebound Continues, but Momentum is Limited

Observing the daily level, the market overall maintained a horizontal consolidation pattern in the short cycle. The momentum line formed a "golden cross" below the zero axis and rose slightly, showing short-term rebound momentum is being released. However, the positive momentum bars are arranged无序 (disorderly) with insufficient persistence, indicating a weak rebound rhythm.

Regarding the Sentiment Quantification Model, although sentiment indicators are slowly moving out of the oversold zone, capital participation remains limited. Both bulls and bears are mainly watching, making it difficult to push the market into a trend-based upward attack.

Multi-Cycle Comprehensive Judgment

Combining weekly and daily analysis, Bitcoin is still trading within a bearish-dominated downward structure. The daily level rebound is more偏向于 (leaning towards) a technical correction within the下跌过程 (downtrend process). Until the weekly trend is effectively reversed, the height and sustainability of the rebound仍需保持谨慎对待 (still need to be treated cautiously).

The above data suggests: The daily bearish trend has not changed, the oversold rebound is continuing.

IV. Market Prediction:(03.02~03.08)

1、Bitcoin Upward Center Construction (Based on price action since the February 6th low)

Bitcoin 4-hour K-line Chart
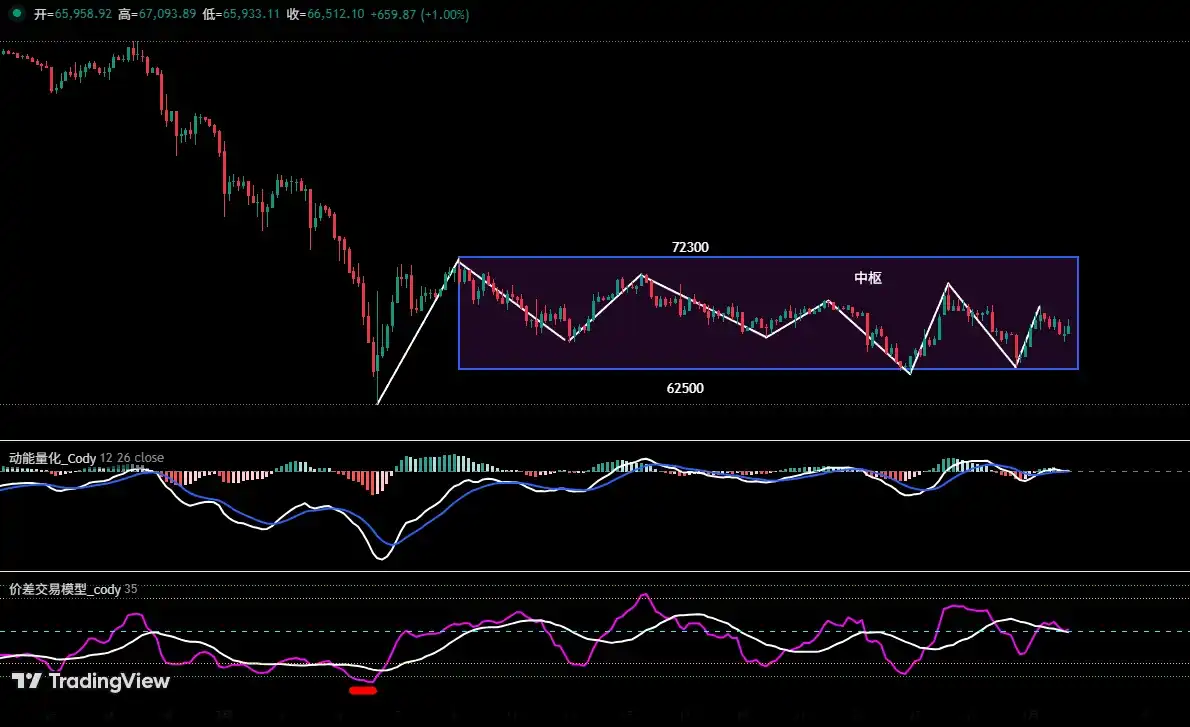
Figure 5

Using Bitcoin's 4-hour chart as the operation cycle:

Center Construction: From the 4-hour chart, it is known that the probability of currently constructing an "upward center" structure is high. Its highest resistance is around $72,300, and the lowest support has moved down to around $62,500.

Core Operation Plan:

Upward Rebound: If the price effectively breaks through the resistance near $72,300, escaping the current "center gravity", it may continue the C-2 segment oversold rebound trend, but the rebound space is expected to be limited.

Downward Adjustment: The current center's lowest support has moved down to around $62,500, close to the February 6th low of $60,000. If the price breaks below this support, the C-2 segment oversold rebound may end, potentially initiating the C-3 segment adjustment行情 (price movement).

• Regardless of which of the above trends the price follows, it is recommended that investors adhere to the strategy of "selling high (short)"为主的 (primarily) in short-term operations.

2、This Week's Core View: Maintain the range-bound consolidation pattern, focus on the struggle between bulls and bears near the range edges. Strategically, firmly implement the operation principle of "reduce positions (longs) on rallies, control risk".

3、Core Resistance Levels:

• First Resistance Area: $68,500-$70,000 area (previous筹码密集成交区 - dense trading area)

• Second Resistance Area: $72,300-$74,500 area (near last April's low)

4、Core Support Levels:

• First Support Level: Around $65,000 (previous important support area)

• Second Support Level: $60,000~$62,500 area (near the February 6th low)

• Third Support Level: Around $57,400 (near the 210-week moving average)

V. Plan A & B Strategies (Excluding Sudden News Impact):(03.02~03.08)

1、 Mid-Term Strategy: Maintain 60% short position. If the rebound effectively breaks $74,500, reduce the position to 40%.

2、 Short-Term Strategy: Use 30% of capital, set stop-loss points, and look for "spread" opportunities based on support and resistance levels. (Use 30-minute/60-minute as operation cycle).

3、Since the market's mid-term direction is bearish, Bitcoin short-term operations should follow the principle of "follow the trend, sell high (go short)". To dynamically respond to complex market changes and combined with signals from our self-built trading models, we have formulated Plan A/B short-term operation plans:

Plan A: If the price rebounds to the resistance area $70,000~$72,300:

• Open Position: When the rebound encounters resistance in this area and triggers a signal, combined with model top signals, establish a 15% short position.

• Risk Control: Initial stop-loss for the short position set above $75,500.

• Close Position: When falling to important support levels combined with model signals, gradually liquidate to take profits.

Plan B: If the price rebounds to around $74,500:

• Add Position: When the price continues to rebound to this area and encounters resistance, combined with model top signals, add a 15% short position.

• Risk Control: Initial stop-loss for the short position set above $75,500.

• Close Position: When falling to support levels combined with model signals, gradually liquidate to take profits.

VI. Special Notes:​​

1. When opening a position: Immediately set the initial stop-loss level.

2. When profit reaches 1%: Move the stop-loss to the entry price (breakeven point) to ensure capital safety.

3. When profit reaches 2%​​: Move the stop-loss to the 1% profit level.

4. Continuous Tracking: Thereafter, for every additional 1% profit, move the stop-loss up 1%同步 (synchronously), dynamically protecting and locking in profits.

Financial markets change rapidly, all market analysis and trading strategies require dynamic adjustment. All views, analytical models, and operation strategies involved in this article are derived from personal technical analysis, intended only for personal trading log purposes, and do not constitute any investment advice or operational basis. The market involves risks, investment requires caution, please do not make decisions based solely on this.

Preguntas relacionadas

QWhat is the current status and profit of the analyst's medium-term Bitcoin short position mentioned in the article?

AThe analyst is holding a medium-term Bitcoin short position that was initially opened at $89,000 with 1x leverage. As of the article's writing, the price has fallen to approximately $65,770, resulting in an unrealized profit of about 26.10%, with a maximum floating profit of around 32.58% during the period.

QWhat trading strategy and models did the analyst use for the successful short-term HYPE trade?

AThe analyst executed a successful short-term long trade on HYPE using 1x leverage, achieving an 11.14% profit. The decision was based on a pre-existing judgment of a potential main upward wave (Wave III) and signals from two proprietary models: the Price Difference Quantification Model, which issued multiple bottom预警 signals (red dots), and the Momentum Quantification Model. These models formed a bottom resonance signal, and the trade was entered after the price broke through and held above a key resistance area at $27.28.

QAccording to the wave count analysis, what are the key characteristics that confirm the potential start of Wave III for HYPE?

AThe analysis identifies several key characteristics confirming the potential start of Wave III for HYPE: 1. A successful break of a significant resistance line (yellow line on the chart) from the Wave II adjustment, which had been unsuccessfully challenged three times before. 2. Strong momentum validation, where a 6-day rally completely covered the previous 10-day decline, including a large bullish candle with a 14.25% gain. 3. A structural trend reversal, where the current high surpassed two important structural points adjacent to the Wave II low, forming a preliminary 'higher high' pattern.

QWhat is the core outlook and trading strategy for Bitcoin in the coming week as per the analyst's prediction?

AThe core outlook for Bitcoin is a continuation of range-bound consolidation. The analyst predicts the price will oscillate within a 'rising central bank' structure on the 4-hour chart, with key resistance around $72,300 and key support around $62,500. The recommended strategy is to maintain a 'sell on rallies' approach for short-term operations, using 30% of capital to look for price difference opportunities on smaller timeframes (30/60 minutes) with strict risk management, including immediate stop-loss placement.

QWhat are the A and B short-term operation plans for Bitcoin based on different price scenarios?

APlan A: If the price rebounds to the resistance area of $70,000-$72,300 and shows signs of rejection, combined with a top signal from the models, open a 15% short position with an initial stop-loss above $75,500. Plan B: If the price continues to rebound to around $74,500 and shows rejection with model top signals, add another 15% to the short position, also with an initial stop-loss above $75,500. Profits are to be taken gradually when the price falls to support levels accompanied by model signals.

Lecturas Relacionadas

Silicon Valley 'Startup Guru' Steve Hoffman: Web3 + AI Could Be a Trap

Silicon Valley investor and "Godfather of Startups" Steve Hoffman warns that combining Web3 with AI is likely a trap, not a promising venture. In an interview, Hoffman argues that while AI is a foundational technology touching all industries, Web3 adds complexity, friction, and regulatory risk without solving mainstream consumer or business needs. He advises founders to focus on deep, specialized applications where startups can out-iterate giants, rather than on generic features easily replicated by large tech companies. Hoffman observes that Silicon Valley will lead foundational AI research, while China excels at rapid, large-scale application and commercialization, particularly in robotics. He stresses that AI-driven autonomous agents capable of collaborative, multi-step tasks are 2-4 years away, which will cause significant job displacement. The solution is not to slow AI but to redesign business models around human-AI collaboration and reform social systems like education and retraining. For startups, Hoffman recommends focusing on vertical, expertise-heavy domains to build defensibility. He sees major opportunities in AI fraud detection and cybersecurity. Key founder mindsets include systemic thinking over feature-focus, relentless customer centricity, building adaptive teams, and deeply understanding AI's capabilities and limits. Hoffman is also leading a non-profit initiative to establish university centers aimed at training future leaders in responsible, human-value-aligned AI innovation.

marsbitHace 1 hora(s)

Silicon Valley 'Startup Guru' Steve Hoffman: Web3 + AI Could Be a Trap

marsbitHace 1 hora(s)

Token Inefficient, Economy Tokenless

The article "Tokens Aren't Economical, Economics Aren't Tokenized" analyzes a pivotal shift in the AI industry from a technology-driven narrative to one dominated by capital efficiency. It highlights two concurrent trends: a severe capital shortage due to the exorbitant and recurring costs of compute (e.g., OpenAI's high burn rate) and a wave of corporate spin-offs where major tech companies are separating their AI units (like Kuaishou's Kling and Baidu's Kunlunxin). The core argument is that AI's "anti-internet" business model, where user growth increases costs rather than profits, has created a disconnect between high valuations and actual cash flow. Spin-offs address this by allowing AI assets to be valued independently. Within a parent company, they are seen as cost centers, but as standalone entities, they are priced based on their growth potential and scarcity in the primary market, leading to massive valuation premiums (e.g., Kling's estimated value tripling post-spin-off). The industry is at an inflection point, moving from "model worship" to "value realization." The competition is evolving from a pure compute (GPU) race to a broader focus on systemic efficiency and full-stack engineering (involving CPUs and orchestration) to achieve viable commercialization. The year 2026 is framed as a critical moment where the industry must definitively answer how to economically translate AI capability into tangible business value, reshaping the sector's future power structure.

marsbitHace 1 hora(s)

Token Inefficient, Economy Tokenless

marsbitHace 1 hora(s)

Crossing the 'Memory Wall': The Wafer-Level Revolution and Computing Power Routes in the AI Inference Era

In 2026, a historic shift occurred in AI as major cloud providers' inference spending surpassed training spending for the first time, signaling a move from "building large models" to "using large models." This shifts the core challenge from computing power to the "memory wall"—the bottleneck of data movement (model weights, activations, KV Cache) between external DRAM and processors, where energy and latency from data transfer far exceed computation itself. Companies like Nvidia face GPU idle time due to bandwidth limits. In contrast, Cerebras Systems adopts a radical "wafer-scale" approach with its Wafer-Scale Engine (WSE). Instead of cutting a silicon wafer into many chips, Cerebras uses almost the entire wafer as one massive chip (WSE-3). This design provides 44GB of on-chip SRAM, delivering memory bandwidth thousands of times higher than traditional HBM (e.g., 21 PB/s vs. Nvidia B200). For LLM inference, weights are streamed layer-by-layer from external MemoryX storage to the chip, avoiding HBM bottlenecks. This results in token generation speeds 1.5–5 times faster than Nvidia's B200 in some models and significant advantages in first-token latency and long-context tasks. Additionally, Cerebras's architecture offers much lower interconnect power consumption (0.15 pJ/bit vs. GPU's ~10 pJ/bit). However, Cerebras faces challenges: SRAM scaling has slowed with advanced nodes, limiting future capacity gains; the chip requires specialized liquid cooling and custom software stacks; and its external I/O bandwidth (150 GB/s) is low compared to NVLink, hindering multi-system scaling for very large models. Competition is intensifying. Major players are pursuing three paths: 1) Developing proprietary inference ASICs (e.g., Google TPU, Microsoft Maia), 2) Leveraging advanced packaging (e.g., TSMC's SoW) to democratize wafer-scale-like integration, potentially eroding Cerebras's process advantage within a few years, and 3) Exploring optical interconnects for ultimate bandwidth. Commercially, Cerebras is transitioning from a hardware vendor to a service provider, facing the immense challenge of building high-power, specialized data centers to meet large contracts (e.g., 250MW/year from 2026–2028). In conclusion, the AI inference era presents a fundamental architectural trade-off. Cerebras opts for extreme physical optimization for low-latency, single-task performance, while Nvidia prioritizes versatility and massive cluster throughput. The path forward remains uncertain, with technology and business models still evolving in the race toward advanced AI.

marsbitHace 1 hora(s)

Crossing the 'Memory Wall': The Wafer-Level Revolution and Computing Power Routes in the AI Inference Era

marsbitHace 1 hora(s)

Has Bitcoin's 'Rebound Ended', Officially Entering the Late Bear Market Phase?

**Title: Has Bitcoin's Rebound Ended, Entering the Late Bear Market Phase?** **Summary:** Bitcoin's price has declined by 13% this week, signaling a potential return to late-stage bear market conditions. The price fell to around $67k, positioned between the Realized Price and Realized Cap Weighted Average. For the first time since early 2022, the Short-Term Holder cost basis has dropped below this key average, confirming a hallmark of late-cycle bear markets. Profitability metrics have collapsed sharply. The 7-day average of the Realized Profit/Loss ratio plummeted from a local high of 3.16 to 0.29, mirroring the February panic sell-off. Critically, the 90-day average never breached the threshold of 2, indicating the recent rally to $82k was a bear market bounce, not a structural shift. Realized losses surged to $1.35 billion daily, with $770 million coming from Long-Term Holders selling at a loss. This accelerating redistribution of supply from weak to strong hands is a necessary but ongoing process for a market bottom. The rally stalled almost precisely at the aggregate cost basis (~$83k) of US spot Bitcoin ETF investors, turning that level into strong resistance and leaving the average ETF holder underwater again. Spot market flows have turned decisively negative, showing sellers are dominating order books despite the price drop. While a significant futures long liquidation event cleared over $400 million in leverage, providing a potential reset, sustained spot demand is yet to materialize. Options markets continue to price in higher future volatility (Implied Volatility) than recent price action (Realized Volatility) has shown, with a persistent skew towards put options, indicating ongoing demand for downside protection. In conclusion, multiple metrics point to a fragile market structure. Resistance at the ETF cost basis, accelerating realized losses, dominant spot selling, and cautious options pricing all suggest the bear market trend persists. A sustainable recovery likely requires a resurgence of spot demand, ETF holders returning to profit, and a clear reduction in selling pressure.

marsbitHace 1 hora(s)

Has Bitcoin's 'Rebound Ended', Officially Entering the Late Bear Market Phase?

marsbitHace 1 hora(s)

Trading

Spot
Futuros

Artículos destacados

Cómo comprar HYPE

¡Bienvenido a HTX.com! Hemos hecho que comprar Hyperliquid (HYPE) sea simple y conveniente. Sigue nuestra guía paso a paso para iniciar tu viaje de criptos.Paso 1: crea tu cuenta HTXUtiliza tu correo electrónico o número de teléfono para registrarte y obtener una cuenta gratuita en HTX. Experimenta un proceso de registro sin complicaciones y desbloquea todas las funciones.Obtener mi cuentaPaso 2: ve a Comprar cripto y elige tu método de pagoTarjeta de crédito/débito: usa tu Visa o Mastercard para comprar Hyperliquid (HYPE) al instante.Saldo: utiliza fondos del saldo de tu cuenta HTX para tradear sin problemas.Terceros: hemos agregado métodos de pago populares como Google Pay y Apple Pay para mejorar la comodidad.P2P: tradear directamente con otros usuarios en HTX.Over-the-Counter (OTC): ofrecemos servicios personalizados y tipos de cambio competitivos para los traders.Paso 3: guarda tu Hyperliquid (HYPE)Después de comprar tu Hyperliquid (HYPE), guárdalo en tu cuenta HTX. Alternativamente, puedes enviarlo a otro lugar mediante transferencia blockchain o utilizarlo para tradear otras criptomonedas.Paso 4: tradear Hyperliquid (HYPE)Tradear fácilmente con Hyperliquid (HYPE) en HTX's mercado spot. Simplemente accede a tu cuenta, selecciona tu par de trading, ejecuta tus trades y monitorea en tiempo real. Ofrecemos una experiencia fácil de usar tanto para principiantes como para traders experimentados.

195 Vistas totalesPublicado en 2024.12.11Actualizado en 2026.06.02

Cómo comprar HYPE

Discusiones

Bienvenido a la comunidad de HTX. Aquí puedes mantenerte informado sobre los últimos desarrollos de la plataforma y acceder a análisis profesionales del mercado. A continuación se presentan las opiniones de los usuarios sobre el precio de HYPE (HYPE).

活动图片