GPUs Have No 'Price': Four Indices Clash, the Compute Market Is More Chaotic Than You Think

marsbitPublicado a 2026-04-08Actualizado a 2026-04-08

Resumen

The GPU compute market lacks a clear price benchmark, with four major indices on Bloomberg Terminal showing significant divergence—differing by over $2 and moving inconsistently. This reveals a fragmented and inefficient market for AI compute power, particularly for H100 and B200 GPUs. While demand surges and supply constraints are real, pricing is highly opaque and varies by contract type, provider, and location. The absence of standardized contracts, reliable benchmarks, and liquid secondary markets leads to hoarding and informal subleasing. Key issues include inconsistent pricing methodologies, unstandardized agreements, quality assurance gaps, and no forward pricing mechanism. Without coordinated improvements in infrastructure and market design, establishing a true price for GPU compute remains impossible.

Author: David Lopez Mateos

Compiled by: Deep Tide TechFlow

Deep Tide Guide: The media likes to summarize the rise and fall of GPU compute prices with a single number, but the reality is: the quotes from four index providers on the Bloomberg terminal diverge by more than $2, with inconsistent directions and rhythms. The author of this article is David Lopez Mateos, founder of the GPU compute trading platform Compute Desk. Using first-hand transaction data, he breaks down the real pricing structure of H100 and B200, revealing a primitive market with no consensus benchmark, no standard contracts, and no forward curve—compute power is being hoarded and sublet like short-term rental apartments.

Media headlines would make you think GPU compute prices are soaring. This narrative is comfortable, perfectly fitting into the macro framework of "supply crunch + bottomless AI demand," and it implies something reassuring: we have a well-functioning market with clear and readable price signals.

But we don't. This narrative is almost entirely built on a single index, and it implies something that shouldn't be implied: the GPU rental market has become efficient enough to be represented by a single number.

The supply crunch is real, but the crunch felt by different people is completely different—depending on who you are, where you are, what contract you're trading, and what compute asset. Faced with this opacity, the market's natural reaction is not orderly price discovery but hoarding: locking in GPU time you might not even need yet, because you're not sure if you can get it at any price next month. Where there is hoarding and no transparent benchmark, fragmented secondary markets emerge. At Compute Desk, we have already facilitated tenants subletting their clusters like apartments during major events. This is not a hypothesis; it is happening.

Indices Do Not Converge

In mature commodity markets, indices built on different methodologies tend to converge. Brent crude and WTI have a few dollars of spread due to geographic location and crude quality, but they move in sync directionally (Figure 1). This convergence is a hallmark of an efficient market.
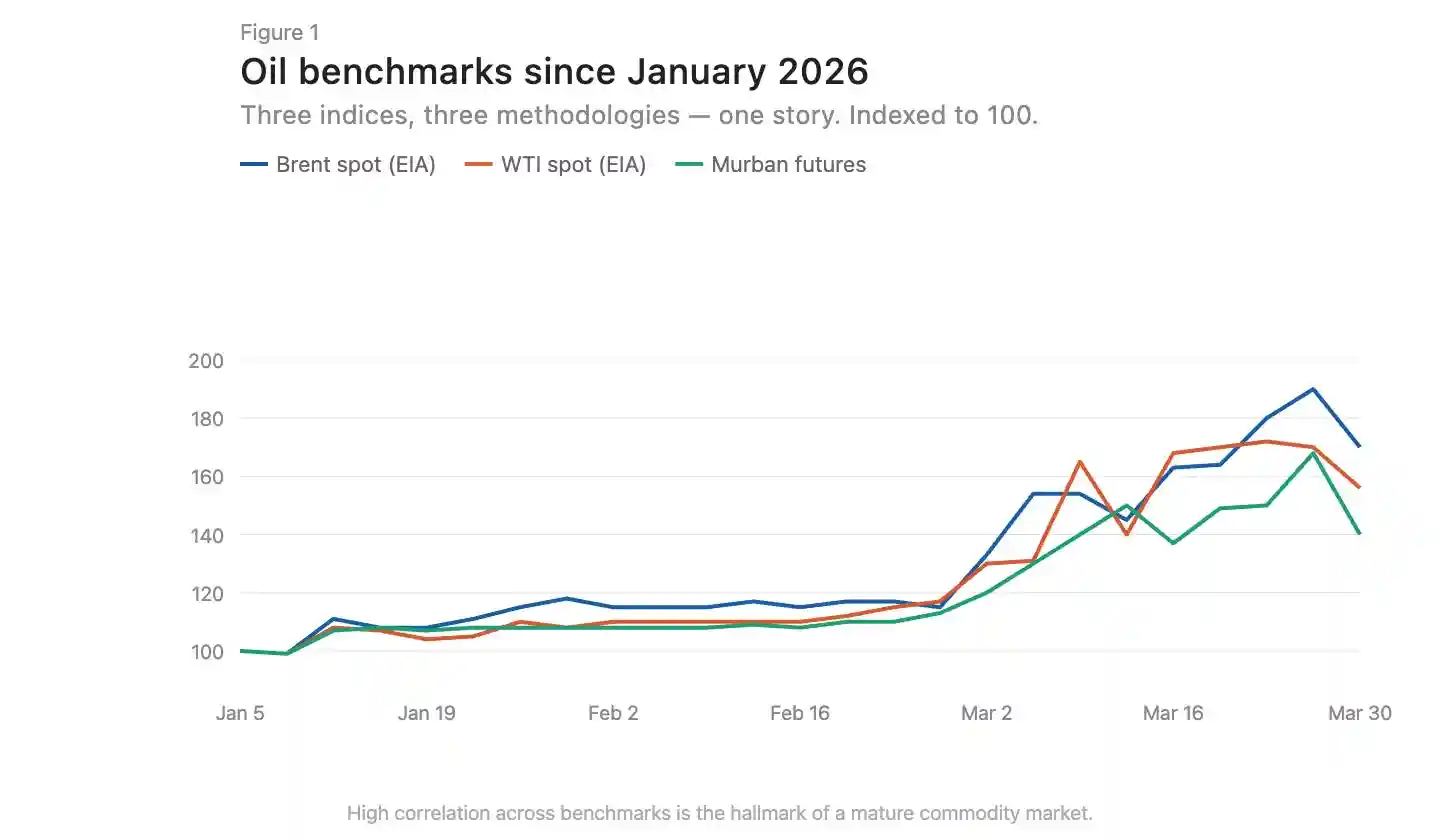
Caption: Comparison of Brent and WTI crude oil price trends, showing high directional alignment

There are now three GPU pricing index providers on the Bloomberg terminal: Silicon Data, Ornn AI, and Compute Desk. SemiAnalysis just released a fourth—a monthly H100 one-year contract price index based on survey data from over 100 market participants. Silicon Data and Ornn publish daily H100 rental indices, Compute Desk aggregates data at the Hopper architecture level, and SemiAnalysis captures negotiated contract prices rather than listed or crawled prices. Different methodologies, different frequencies, different angles of insight into the same market. Overlaying them reveals clear divergence (Figure 2).
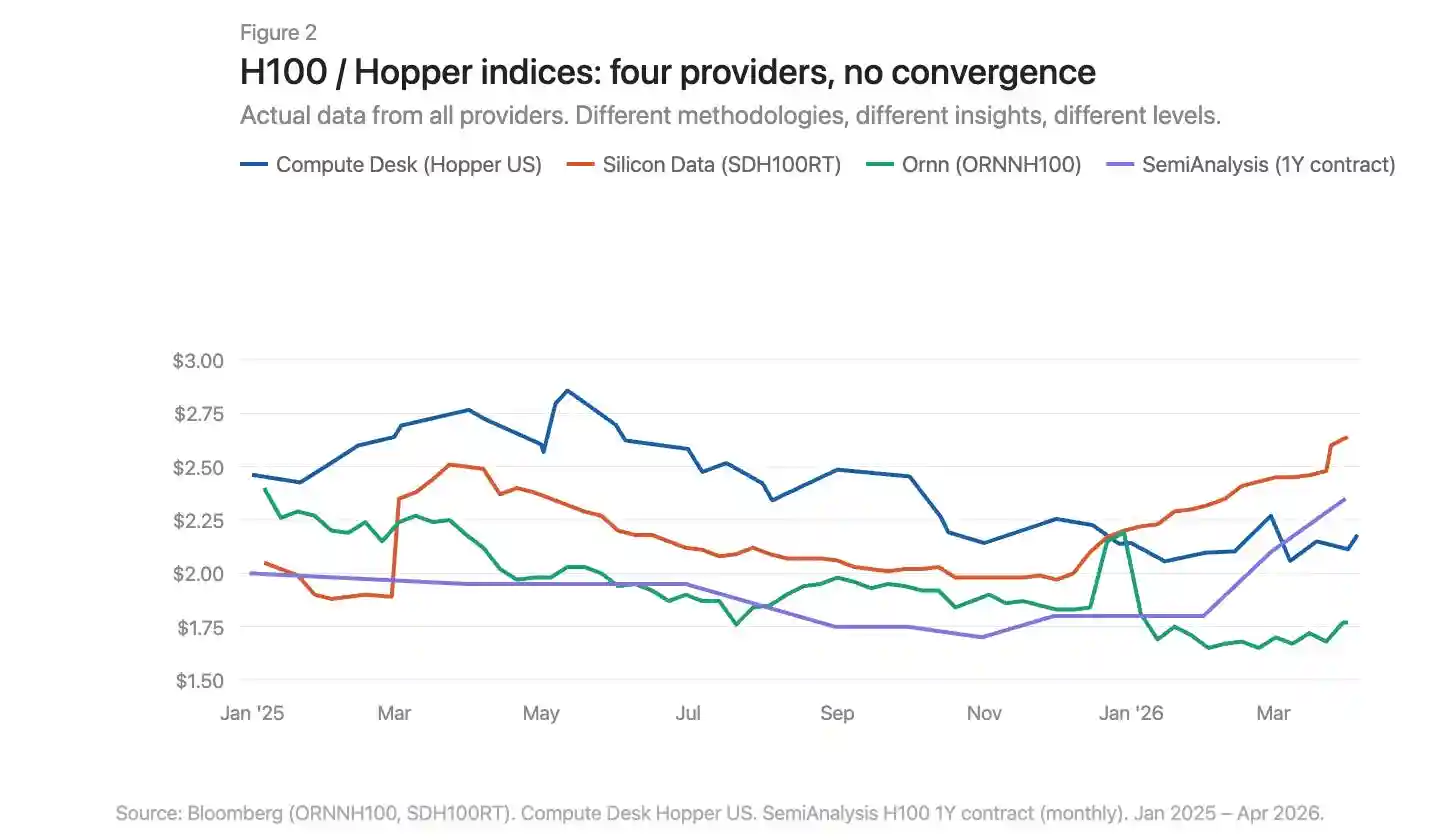
Caption: Overlay comparison of four GPU indices, showing significant divergence in price levels and trends

Where Exactly Is the Price Increase Happening

Using Compute Desk data, we can break down H100 price changes by supplier type and contract structure, and overlay Silicon Data's SDH100RT index (Figure 3). All indicators show prices rising, but the starting points and magnitudes vary greatly depending on the index and contract type.
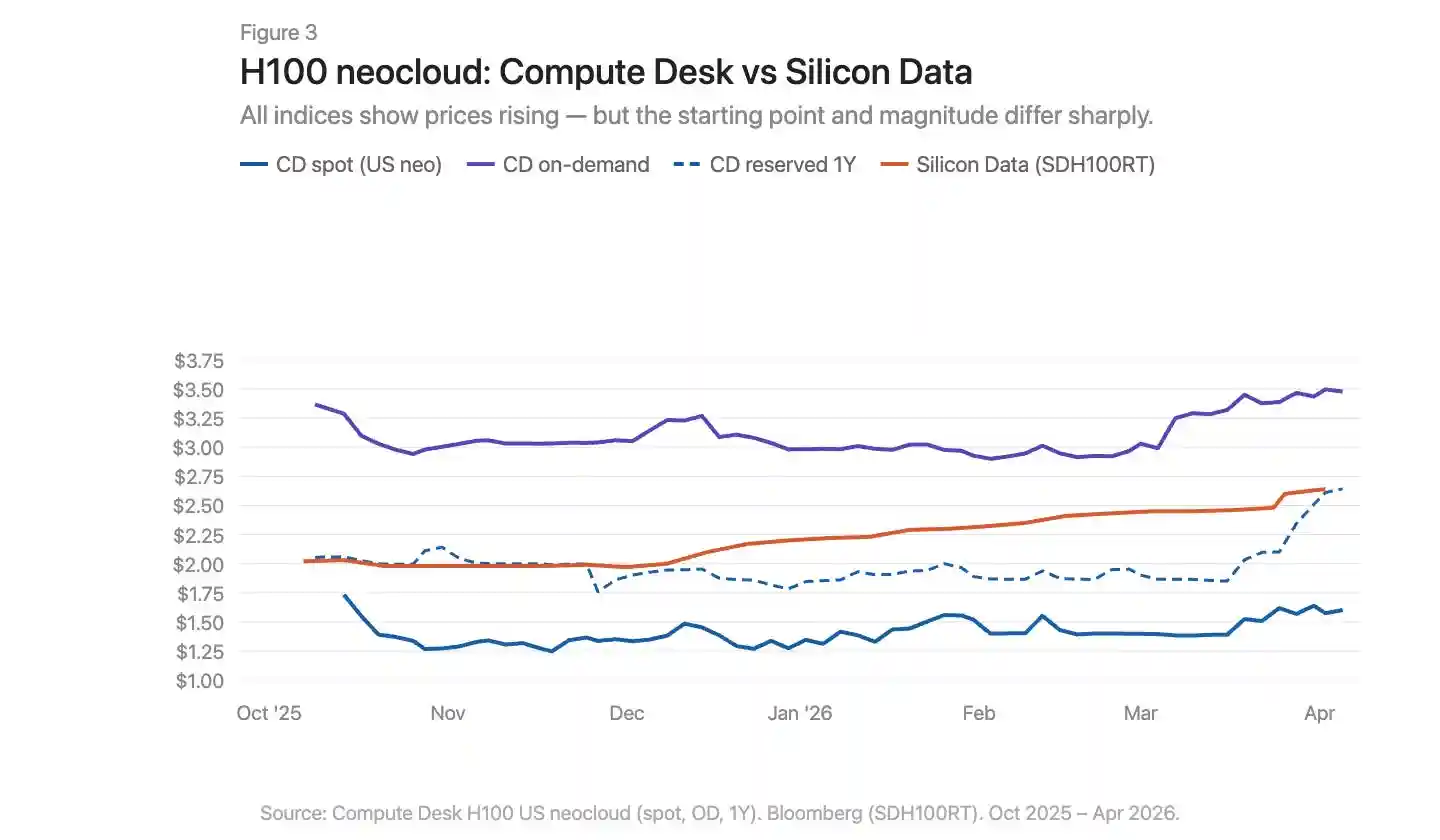
Caption: H100 price trends by contract type overlaid with the SDH100RT index

Compute Desk's H100 neocloud data tells a more specific story than the aggregate index. On-demand pricing was relatively stable throughout the winter, around $3.00/hour, then surged sharply to $3.50 in March. Spot pricing was noisier and lower, with only a slight upward trend until March. Silicon Data's SDH100RT shows a smoother, steady rise, increasing from $2.00 to $2.64 over the same period. The two indices remain at different price levels and describe different time rhythms: Compute Desk shows a March spike, Silicon Data shows a slow climb.

One-year reserved pricing was largely flat until February, then jumped sharply from $1.90 to $2.64 at the end of March—not a gradual catch-up, but a sudden repricing. This looks more like suppliers collectively adjusting contract rates after the on-demand market tightened, rather than a continuous structural demand driver.

The March story for B200 is even more dramatic (Figure 4). Compute Desk's on-demand index exploded from $5.70 to over $8.00 within weeks. Silicon Data's SDB200RT surged from $4.40 to $6.11 before falling back to $5.47. Both indices recorded this move, but the starting points differed by over $2, and the shapes of the rise and fall were different. B200 has less than five months of data, fewer suppliers, and larger spreads; the two indices are viewing the same event through very different lenses.
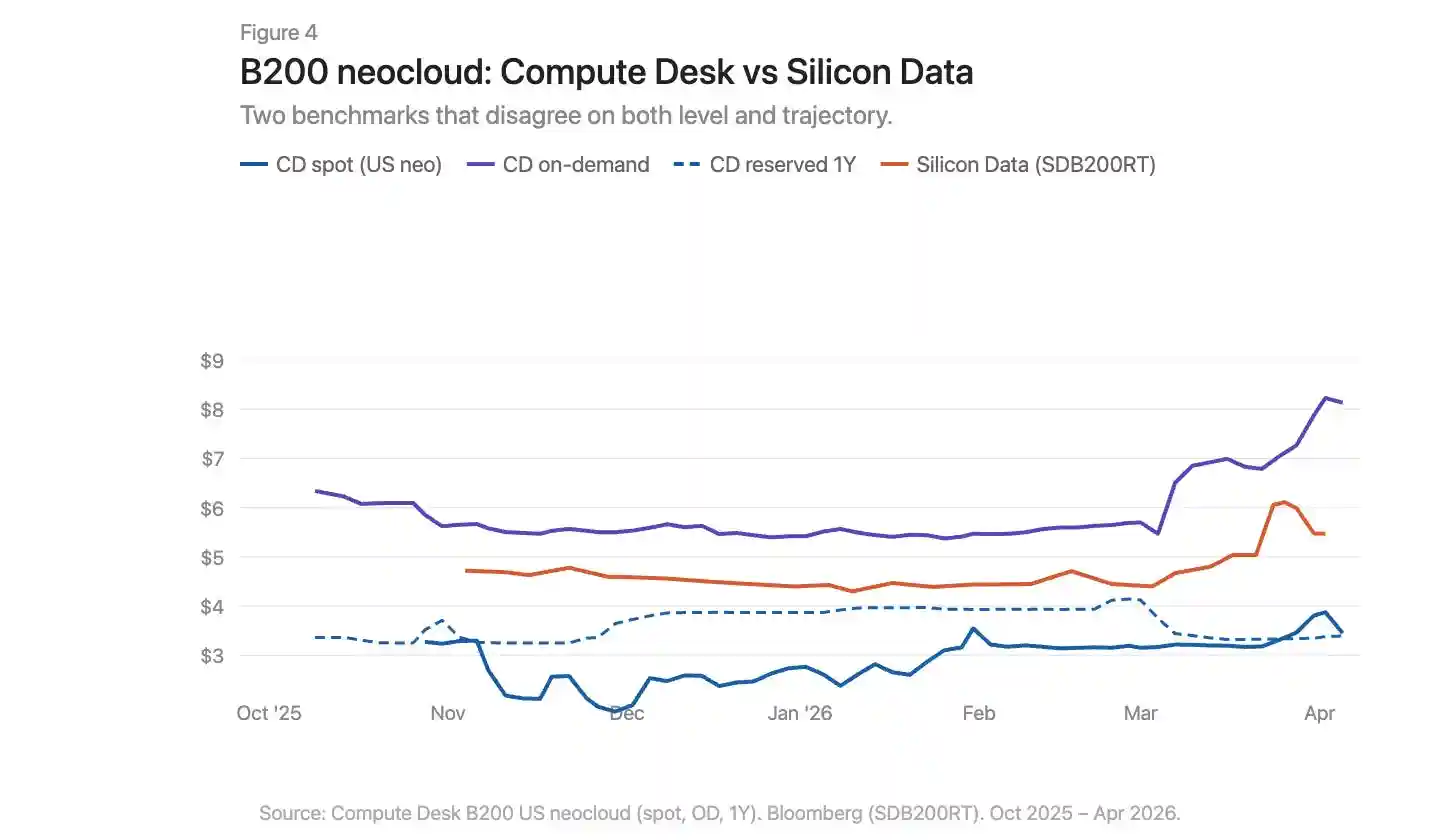
Caption: B200 on-demand and reserved price trends, overlaid with Compute Desk and Silicon Data data

Infrastructure Issues, Not Just Geographic Differences

Commodity markets have basis differentials. Appalachian natural gas is a textbook case: massive reserves sit atop structurally constrained pipeline capacity, with utilization rates in the Pennsylvania-Ohio corridor often exceeding 100%, and new projects like the Borealis Pipeline not coming online until the late 2020s.

The GPU market has a similar situation: an H100 in Virginia and an H100 in Frankfurt are not the same economic good. But geographic differences alone cannot explain why indices measuring the same market diverge so much. The dislocation in the GPU market is deeper than in Appalachian natural gas. The problem with natural gas is a single missing link: pipeline capacity connecting supply and demand. The infrastructure gap in the compute market exists on both the supply and demand sides. Physical infrastructure—the consistent networks, predictable configurations, and predictable availability needed for reliable compute distribution—is not yet mature and sometimes simply doesn't work. Financial infrastructure—standardized contracts that compress spreads despite physical differences, transparent benchmarks, arbitrage mechanisms—also doesn't exist yet.

The data tells one story. The real, painful experience of trying to procure compute in early 2026 tells another. On-demand capacity for all GPU types is virtually sold out. Finding 64 H100s is difficult: Compute Desk shows 90% of suppliers have zero on-demand cluster availability, and the reserved market isn't much better. In a well-functioning market, this level of scarcity would have pushed prices to a new equilibrium. But it hasn't. This suggests suppliers themselves lack real-time pricing intelligence to adjust. Prices are rising, but too slowly to clear the market. The gap between listed prices and true willingness to pay is being filled by hoarding, subletting, and informal secondary market transactions.

What Needs to Change

The current GPU compute market has seven core problems:

No consensus benchmark. Multiple indices coexist with different methodologies and contradictory conclusions.

Aggregate narratives mask structure. A single "H100 price" number masks huge differences between supplier types and contract terms.

Lack of transaction-level data. In bilateral markets, the deviation between listed prices and actual transaction prices is very large.

No contract standardization. Most GPU rentals are bilaterally negotiated with varying terms. Shorter, more standardized contract terms would improve liquidity and price discovery.

No delivery quality guarantee. Interconnect topology, CPU pairing, network stack, and uptime vary enormously. Buyers need to know the quality of the compute they are purchasing before committing.

Contracts lack liquidity. If demand changes during a reservation, options are limited: either eat the cost or sublet informally. The market needs infrastructure to transfer or resell committed compute, allowing capacity to flow to those who need it most.

No forward curve. Without the ability to price forwards, there is no hedging. This is why lenders discount GPU collateral by 40%-50%, keeping financing costs high.

Building a properly functioning market for the most important commodity of the century cannot advance on just one front. Measurement, standardization, contract structure, delivery quality, liquidity—these must advance in sync. Until then, no one can truly say what a GPU hour is worth.


Preguntas relacionadas

QWhy do the four GPU pricing indices on the Bloomberg terminal show significant discrepancies?

AThe indices differ because they use different methodologies, frequencies, and data sources. Some track daily H100 rental rates, others aggregate data at the Hopper architecture level, and one uses survey-based monthly contract prices. This lack of standardization leads to inconsistent price levels and trends.

QWhat does the divergence between GPU indices indicate about the current state of the compute market?

AThe divergence indicates an inefficient and immature market. Unlike mature commodity markets where indices converge, the GPU market lacks a consensus benchmark, standardized contracts, and transparent pricing, leading to fragmented and unreliable price signals.

QHow did H100 pricing behave across different contract types according to Compute Desk data?

AOn-demand pricing was stable at around $3.00/hour until March, then spiked to $3.50. Spot pricing was lower and noisier, with a slight uptrend in March. One-year reserved pricing was flat until late March, then jumped sharply from $1.90 to $2.64, indicating a sudden repricing rather than gradual demand growth.

QWhat infrastructure gaps are exacerbating the fragmentation in the GPU compute market?

ABoth physical and financial infrastructure are underdeveloped. Physically, inconsistent network reliability, configuration, and availability hinder uniform delivery. Financially, there are no standardized contracts, transparent benchmarks, or arbitrage mechanisms to compress price differences across regions and providers.

QWhat are the core problems preventing the GPU compute market from functioning efficiently?

AKey issues include: no consensus benchmark, aggregated narratives masking structural differences, lack of transaction-level data, absence of contract standardization, unguaranteed delivery quality, illiquid contracts with no resale mechanisms, and no forward curve for hedging or financing.

Lecturas Relacionadas

Coldcard Urges Users to Move Bitcoin as Vulnerability Remains Exploited

Coldcard has urgently warned users to move their Bitcoin holdings, confirming on Tuesday that a vulnerability—which has already led to the theft of up to $114 million from self-custody wallets—remains actively exploited. The company stressed this is not a precautionary alert, citing a fourth wave of fraudulent transactions on Monday that drained approximately 449 BTC from 709 addresses. The flaw, dormant since 2021, involves firmware in cases where funds are controlled by a single key without a second confirmation. Users of Mk3 models (with firmware 4.0.1 or later) must transfer funds immediately. Owners of Mk4, Mk5, and Q models with firmware below 5.6.0 or 1.5.0Q should update firmware, generate a new wallet, then move coins. The vulnerability is tied to insufficient entropy during seed phrase generation, potentially allowing attackers to guess the key and drain wallets remotely. An exception is made for users who employed the device’s “dice roll” feature for key generation, as those wallets never touched the compromised code. Vincent Buzon, a cybersecurity expert at rival hardware wallet maker Ledger, noted the incident stemmed from an implementation failure, emphasizing that secure entropy generation must be hardware-based. He warned that software wallets on unprotected devices are riskier, and holding funds on centralized exchanges represents “not ownership, but an IOU.” Bitcoin traded around $63,800 in the U.S. on Tuesday, largely unaffected by the wallet warning.

cryptonews.ruHace 20 min(s)

Coldcard Urges Users to Move Bitcoin as Vulnerability Remains Exploited

cryptonews.ruHace 20 min(s)

Ethereum Price Forecast: Why Does ETH Remain Stable After Five Consecutive Weeks of ETF Inflows?

Ethereum Price Forecast: Why ETH Stays Stable After Five Consecutive Weeks of ETF Inflows? Ethereum (ETH) is trading around $1,867.68, showing little movement despite five consecutive weeks of net inflows into spot ETFs and a new community-dividing proposal, EIP-8363, that could significantly alter ETH's supply dynamics. Technically, ETH is consolidating between key support at $1,837.76 (0.382 Fibonacci) and resistance around $1,939. A descending trendline from May near $1,900 continues to cap price rallies. The MACD indicator remains bearish, suggesting sideways momentum persists until a breakout occurs. On August 4th, spot ETH ETFs saw a strong $53.75 million daily inflow, led by BlackRock's ETHA. This marks the fifth straight week of positive inflows, with total net inflows reaching $11.25 billion. A major talking point is EIP-8363, the "Tapered Issuance Burn" proposal backed by researchers like Justin Drake. It aims to burn an increasing share of validator rewards as the staked ETH ratio grows, reaching 100% burn when 60.25 million ETH (≈50% of supply) is staked. Proponents see it as a long-term positive supply shock for price. However, opponents warn it could disadvantage small validators and reduce staking yields, potentially dampening institutional demand. **Price Outlook:** * **Bull Case (Target: $2,042):** A daily close above the $1,940 resistance and the descending trendline, fueled by sustained ETF inflows and EIP-8363 supply narrative, could open a path toward the 0.618 Fibonacci level at $2,042. * **Bear Case (Risk to $1,711):** If selling pressure resumes, ETH losing the $1,837 support could lead to a decline toward the 0.236 Fibonacci level at $1,711, with June's low of $1,506 as a deeper risk level.

cryptonews.ruHace 24 min(s)

Ethereum Price Forecast: Why Does ETH Remain Stable After Five Consecutive Weeks of ETF Inflows?

cryptonews.ruHace 24 min(s)

Chainstack Adds Support for Robinhood Chain for Managed and Self-Hosted Nodes

Chainstack, a Web3 infrastructure platform supporting over 100,000 developers across 70+ blockchain networks, has added support for Robinhood Chain across its three deployment models: Global Nodes, Dedicated Nodes, and Chainstack Self-Hosted. The support is available for both the mainnet (chain ID 4663) and testnet (chain ID 46630). Robinhood Chain is an Ethereum L2 network built on Arbitrum Orbit with Nitro, optimized for financial and tokenized real-world asset transactions. It offers 100-millisecond block times and uses ETH for gas. A key feature is its first-come, first-served transaction ordering based on endpoint latency, making node placement a matter of execution rather than fee strategy. Chainstack's three models provide different levels of control and infrastructure: scalable Global Nodes for dApps and wallets, high-performance Dedicated Nodes with unlimited requests for marketplaces and protocols, and Self-Hosted Nodes for clients requiring full control over data sovereignty and deployment in their own environment. The Self-Hosted option is highlighted as critical for regulated issuers and brokers who cannot use third-party infrastructure due to compliance. The platform offers a unified management plane, billing, and monitoring for RWA workflows across multiple blockchains. Access is available immediately, with testnet tokens provided via a faucet and a free tier for evaluation.

cryptonews.ruHace 27 min(s)

Chainstack Adds Support for Robinhood Chain for Managed and Self-Hosted Nodes

cryptonews.ruHace 27 min(s)

Trading

Spot
活动图片