Fundamental indicators of cryptocurrencies are increasingly becoming the main filter for investors: they look at protocol revenue, real-world usage, token economics, and a project's ability to retain created value, not just its position in the market capitalization table.
Market participants from Bitwise, Wintermute, and Arbitrum Foundation note that cryptocurrency is gradually moving out of the stage where tokens were evaluated on the principle of 'the higher in the ranking, the more reliable.' In the short term, prices are still largely driven by perpetual futures, liquidity, and trading flows. But over months and years, investors are paying closer attention to whether a network has users, fees, sustainable demand, and a clear model for capturing value.
Key takeaways:
- Investors are increasingly evaluating tokens based on the size of the potential market, actual adoption, and the project's ability to convert activity into value.
- Capital managers who are just entering the crypto industry are not limiting themselves to CoinMarketCap rankings and are delving deeper into individual networks and applications.
- Hyperliquid became one of the early examples of this approach: the $HYPE token is evaluated through platform activity, its revenues, and economic parameters.
What is fundamental analysis of cryptocurrencies
Fundamental analysis of cryptocurrencies, in simple terms, is an attempt to understand what makes a project valuable in the first place. An investor looks not only at the token price, but at users, fees, revenues, technology, tokenomics, and the network's ability to retain created value.
Technical analysis answers a different question: how the price behaves on the chart right now. It helps assess levels, liquidity, perpetual futures, funding rates, and trader behavior. Fundamental analysis is more suitable for evaluating a project over months and years, while technical analysis is for finding entry points and short-term trades.
Fundamental and technical analysis: a brief comparison
- Criterion: What is studied. Fundamental analysis looks at the protocol's business logic, users, fees, and token economics. Technical analysis looks at the price chart, volumes, liquidity, and derivatives.
- Criterion: Horizon. Fundamental analysis is more useful over a horizon of months and years. Technical analysis is more often used intraday and for short-term trades.
- Criterion: Main question. Fundamental analysis asks why an asset should have value. Technical analysis asks where the price might go in the near future.
What to check before evaluating a token
- Developer team: Experience, public presence, ability to deliver on promises and develop the product.
- Technology and innovation: What problem the network or application solves and whether the project has a noticeable advantage.
- Tokenomics: Issuance, token distribution, incentives for participants, and value accumulation mechanism.
- Partnerships and integrations: Whether they help attract users, capital, and real-world use cases.
- User activity: Transactions, paying users, fees, and audience retention.
- Economic model: Whether there are revenues, demand, and a clear link between protocol activity and token value.
- Competitors: How the project differs from other networks, exchanges, applications, or infrastructure solutions.
- Roadmap and development plans: How realistic the plans are and whether they support the long-term growth of the ecosystem.
Tools and metrics for fundamental analysis
For fundamental analysis, investors use not one indicator, but a set of sources and metrics. The market capitalization ranking helps to quickly understand the scale of an asset, but by itself it no longer answers the question of how strong a project is.
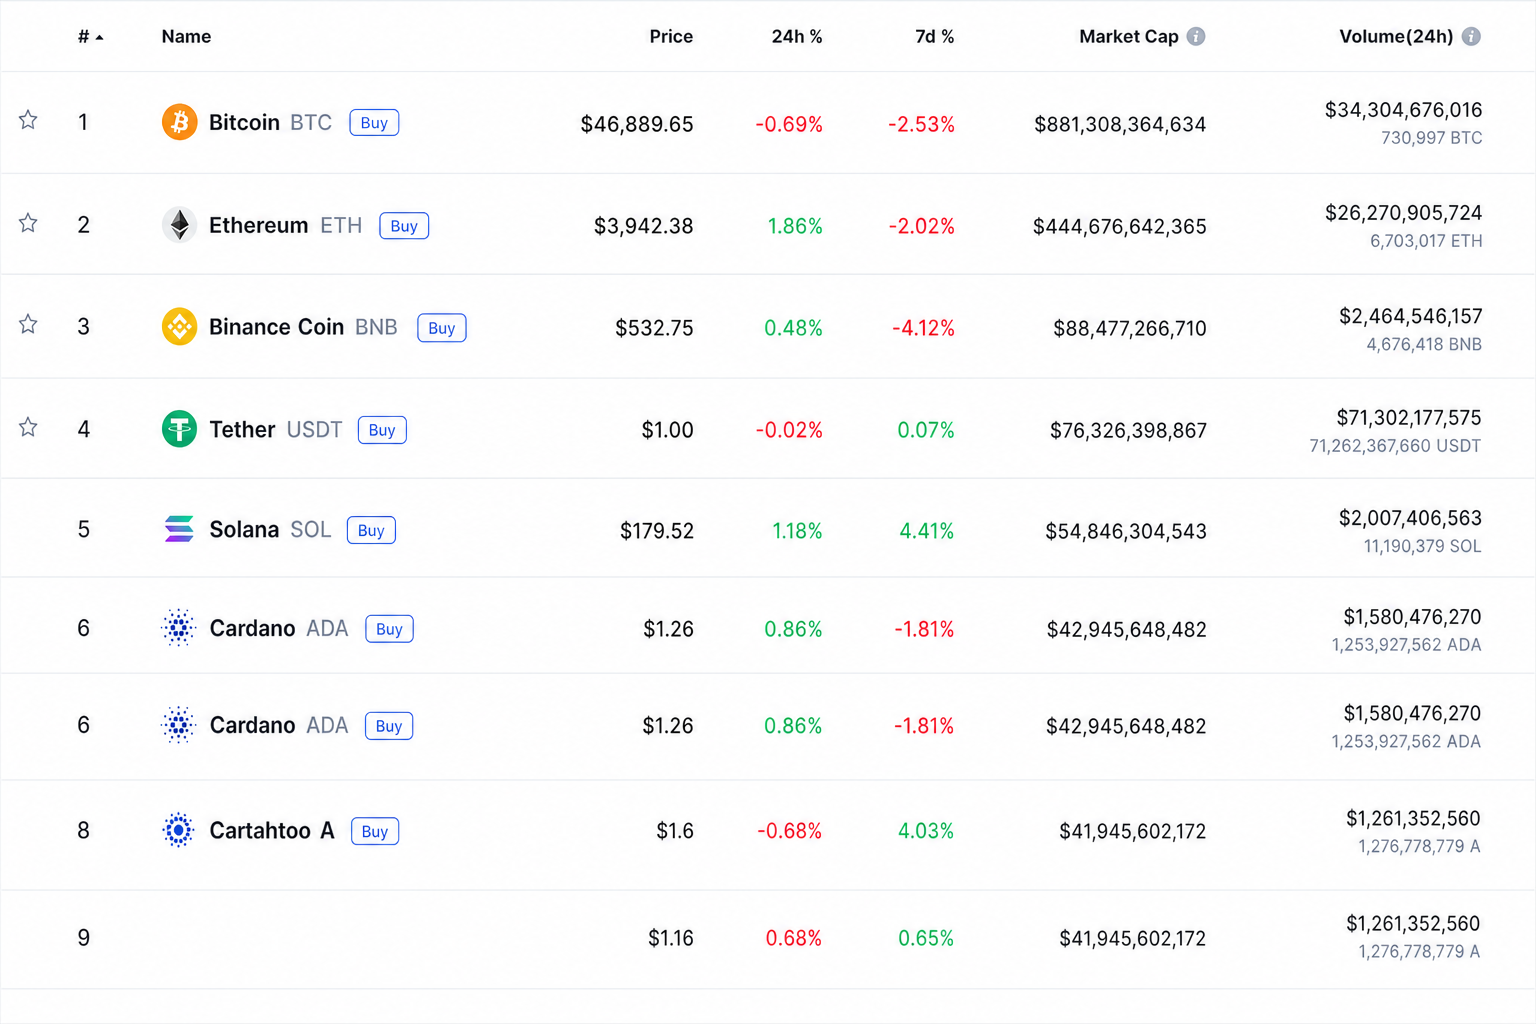
- Rankings and aggregators like CoinMarketCap help assess a token's place in the market and compare its capitalization with other assets.
- On-chain data shows transactions, fees, user activity, and capital that remains within the network.
- Reports and reviews from managers and market makers, including Bitwise and Wintermute, help to see institutional flows and changes in demand.
- Data on derivatives, perpetual futures, funding rates, and liquidations help separate short-term price movements from the long-term value of a project.
Market capitalization is the token price multiplied by the number of tokens in circulation. This indicator is important because it helps compare the scale of projects, but it does not replace the analysis of revenues, users, tokenomics, and sustainability of demand.
When evaluating a team, it's worth looking at who develops the project, whether the participants have relevant experience, how they communicate with the community, and whether they fulfill stated plans. When evaluating tokenomics, token distribution, incentives, issuance, token demand, and whether part of the created value is returned to the ecosystem are important.
Government policy and regulation affect the market through rules for investor admission, requirements for exchanges and custodians, tax regime, as well as the approach to stablecoins, tokenized assets, and DeFi instruments. The clearer the rules, the easier it is for large allocators to work with digital assets; sharp uncertainty, on the contrary, increases risk and can put pressure on liquidity.
Why market cap ranking has ceased to be the main benchmark
Bitwise CEO Hunter Horsley describes what is happening as the end of the 'CoinMarketCap ranking' era. In previous market cycles, new layer-1 networks were often evaluated as a scaled-down version of the largest blockchains: if a project was lower on the list, a discount was automatically applied to it.
Now this template works less well. Fundamental analysis comes to the fore: what market a project can capture, how fast its user base is growing, what fees it collects, and how much of the created value remains within the ecosystem. Market capitalization remains a noticeable benchmark, but it no longer replaces a full-fledged evaluation of the protocol's business.
Horsley cites Hyperliquid as an example. When evaluating $HYPE, investors can look not at how similar it is to another blockchain network, but at the trading activity of the derivatives platform, its profitability, and internal economics. Over the past year, the token has risen by about 20%.
When we talk to capital managers at companies that have recently entered this sector, they often don't even know what position an asset occupies on CoinMarketCap. For them, it's just not the main thing, said Hunter Horsley.
Perpetual futures still move the price intraday
Wintermute OTC trader Jasper De Maer emphasizes: fundamental indicators and market flows are important, but they work on different timeframes. Intraday, the price is still often determined by perpetual futures, funding rates, trader positioning, and liquidations.
For most major tokens, the volume of perpetual futures remains several times higher than spot trading. Therefore, technical analysis, liquidity data, and the behavior of the derivatives market retain significance for short-term trades. But for longer-term investments, investors are increasingly returning to revenues, demand, and the quality of user activity.
According to De Maer, over the past 12-18 months, interest has noticeably shifted from pure infrastructure to applications and application-specific blockchains. Such projects are closer to the familiar logic of fintech and venture capital: they are easier to compare by clients, turnover, fees, and user retention.
Fundamental metrics become especially important in decentralized finance, on perpetual futures exchanges, and in decentralized physical infrastructure networks. Mining also falls into this category, where investors have long been accustomed to looking at the cost of production, revenue, and the sustainability of the model, not just the coin price.
Fundamental indicators form the lower boundary of valuation and help create a shortlist of assets, and then trading flows determine the specific price, noted Jasper De Maer.
He adds that revenues and real-world usage help understand which tokens will survive downturns and enter the portfolios of large allocators. But these indicators rarely determine where the price will go today.
Institutional flows are changing the market structure
Wintermute data shows that the main change is not so much a shift from spot to derivatives, but rather who exactly is trading. In the first half of 2026, institutional counterparties accounted for about 72% of the company's spot OTC flow. A year earlier, their share was approximately 59%.
These flows are concentrated in the largest cryptocurrencies and in a limited set of tokens that can generate income. De Maer calls tokenized real assets a separate new category. In this logic, a token is increasingly perceived not only as a speculative instrument, but also as an asset on the balance sheet, whose value must be based on verifiable cash flows or retained capital.
At the same time, De Maer warns: it is not always easy to understand where the market is truly rewarding strong fundamentals, and where it is simply following a fashionable narrative. Tokens with revenue attract attention precisely because the fundamental theme is currently in demand, and these two effects are difficult to separate.
The gap is also noticeable between the crypto assets themselves and public companies related to the industry. In the first half of the year, cryptocurrencies fell by 36%, while crypto company stocks rose by 23%, according to a Bitwise review. This does not mean that the stock as a financial instrument will continue to outperform tokens, but it shows that the securities market and the digital assets market can operate in different modes.
Which metrics do investors consider more reliable
Brendan Ma, Head of Investment Strategy at Arbitrum Foundation, says analysts have become better at understanding revenue structure, transactional activity, and value capture mechanisms compared to a year ago. In his opinion, the most convincing are metrics that require costs to create and are verifiable on the blockchain.
Ma includes fee revenue, users who actually pay fees, and capital remaining in the network as such indicators. These can be stablecoin balances and tokenized assets. Such data is harder to fake than a simple number of addresses or total value locked.
The number of addresses and the total value locked metric can be inflated by incentives or bots. Therefore, transaction growth becomes more important when accompanied by an increase in fees and user retention. In this sense, economics as a science helps to look at blockchain not as a price quote table, but as a system of incentives, demand, and value distribution.
Ma cites Arbitrum as an example of project-level analysis. Throughout its history, the network has processed over 2.7 billion transactions, of which more than 500 million occurred in 2026. According to the foundation, Robinhood Chain generates about $40 million in annual revenue. Under the expansion program, 10% of that network's net protocol revenue is returned to the Arbitrum ecosystem.
Which assets look stronger based on fundamentals
According to the logic of Hunter Horsley, Jasper De Maer, Brendan Ma, and Zach Pandl, assets that look stronger are not just the most prominent tokens, but those with real usage, revenues, capital within the network, and a clear model for capturing value.
- Bitcoin remains a separate macro asset, demand for which is linked to the search for alternatives to fiat currencies.
- Ethereum and projects beyond it will undergo stricter scrutiny of their economic model, users, and revenues.
- $HYPE is evaluated through Hyperliquid's activity, platform profitability, and internal economics.
- Arbitrum shows how investors can look at transactions, revenue of connected networks, and the return of part of the revenue to the ecosystem.
Bitcoin, Ethereum, and the new chapter of digital assets
Hunter Horsley believes that index products can give investors broad access to the crypto market without the need to pick individual winners. Such solutions are offered by Bitwise, as well as other asset managers, including 21Shares.
Grayscale's Head of Research, Zach Pandl, separates Bitcoin and the rest of the market. In his assessment, Bitcoin remains a macro asset, demand for which is linked to the search for alternatives to fiat currencies. Here, macroeconomics, inflation, and investor attitudes towards monetary policy are important.
Other cryptocurrencies, including Ethereum and projects beyond it, will undergo stricter scrutiny of their underlying economic model. Investors will look at whether the network has real users, sustainable revenues, and a clear logic for value accumulation. In traditional finance, financial reporting plays a similar role: it helps understand to what extent a security or business is backed by real results.
Pandl expects the sector's prospects to remain strong because stablecoins, tokenized assets, and decentralized finance instruments will support demand for digital assets beyond Bitcoin in the coming years.
A small number of tokens with a strong fundamental base will play a key role in the next stage of digital asset development. Weak projects with poor indicators will be left behind, said Zach Pandl.
The main conclusion for the market is simple: capital is increasingly less willing to pay just for a place in the ranking. As the industry matures, verifiable economics, real users, and a project's ability to convert activity into long-term value become more important for investors than a loud narrative.
end-content