DeXe slips 13% – But here’s why the pullback may be temporary

ambcryptoPublicado a 2026-07-14Actualizado a 2026-07-14

Resumen

DeXe (DEXE) has recently pulled back by approximately 13% after a significant rally, gaining over 1,000% in the past six months. This dip is largely attributed to profit-taking by buyers. Analysis of the price chart indicates the sell-off may be temporary. Key demand zones are seen as potential support levels, with the first zone being the most likely to hold. Technical indicators support this view: the Accumulation/Distribution line shows slight upward divergence despite falling prices, and the RSI remains in a neutral-bullish range near 52. Furthermore, spot market data reveals a sharp decline in net selling pressure, dropping more than tenfold from its recent peak. The evidence suggests the current weakness is a slowdown within a longer-term bullish trend rather than a decisive reversal.

DeXe [DEXE] has been printing fresh highs for weeks, gaining 45% in the past seven days alone and more than 1,000% across the past 180 days, as reflected on the chart.

Over the past 24 hours, capital has begun retreating as buyers step back and lock in profit, a shift that has dragged the asset down roughly 13% within the period.

The chart structure, however, points to a possible temporary pullback, with price still positioned to extend its upside over the longer term.

DeXe doji candles expose a standoff

DeXe printed two telling doji candles in the early hours of the day.

The first, a gravestone doji, reflected intense sell pressure as price attempted to extend its upswing, while a dragonfly doji formed a few candles later and signaled bulls stepping back in.

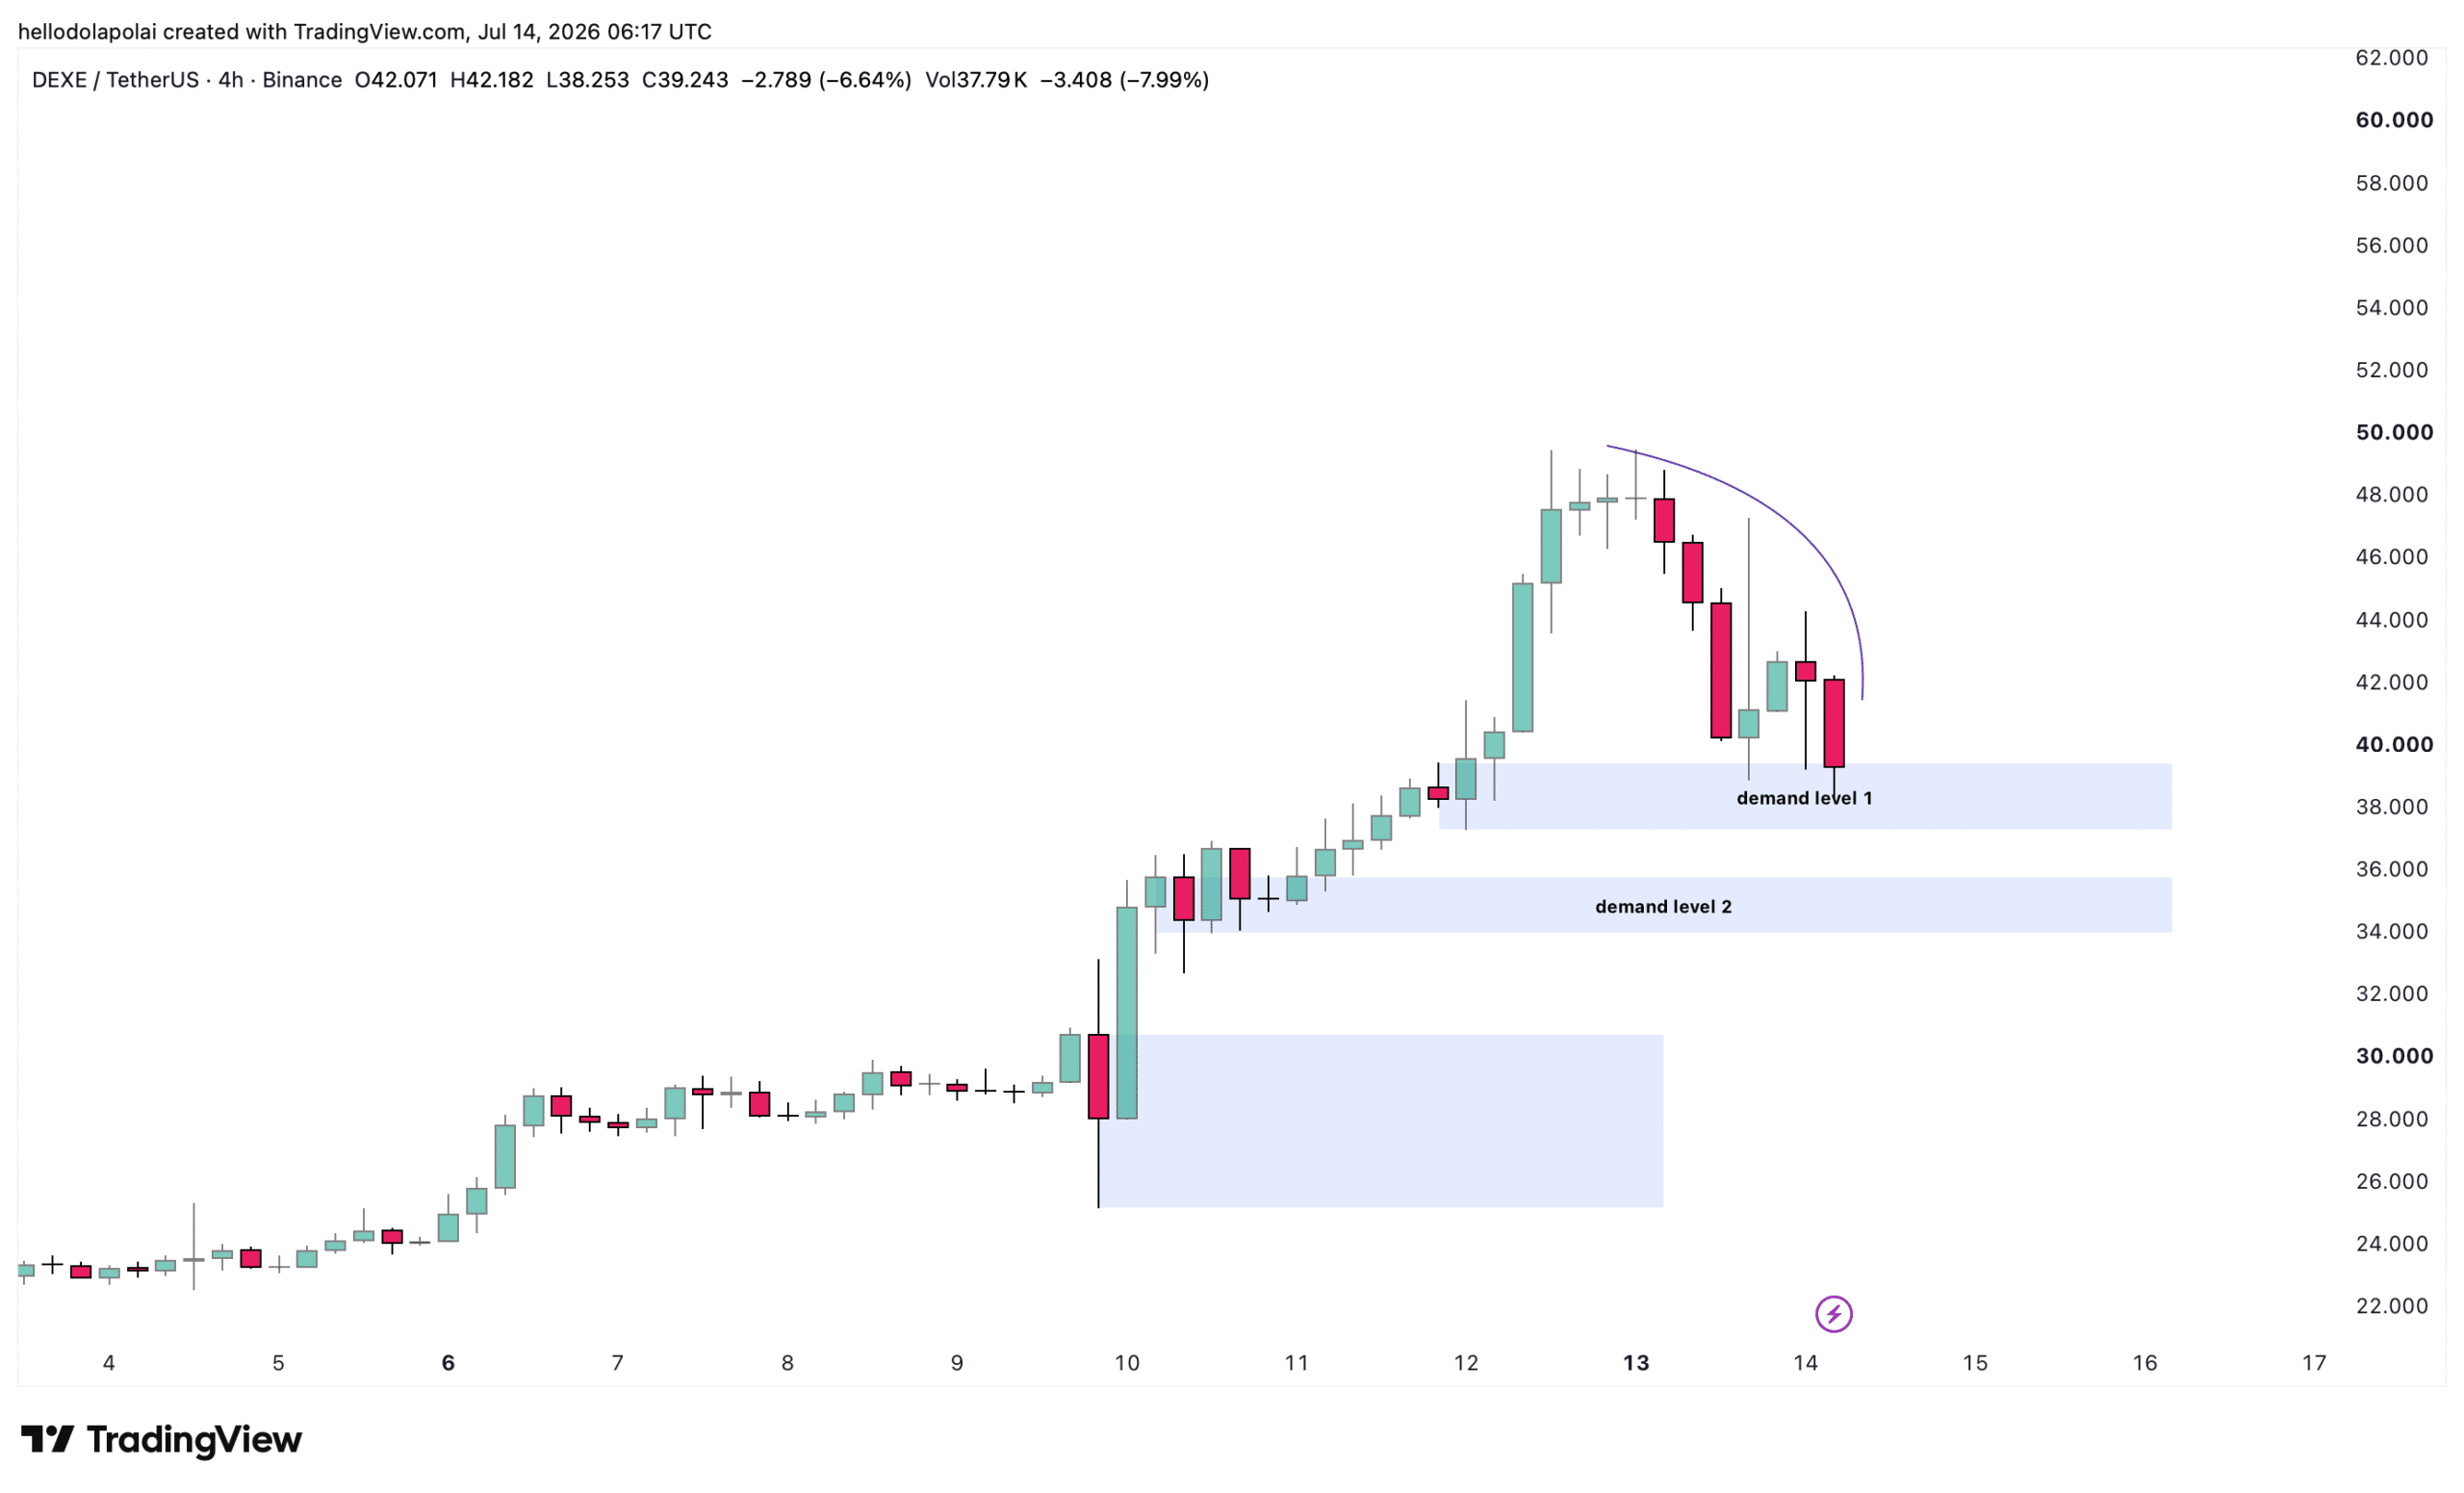
Price currently sits decidedly bearish, and the near-term outcome hinges on the key demand zones mapped on the chart.
Source: TradingView

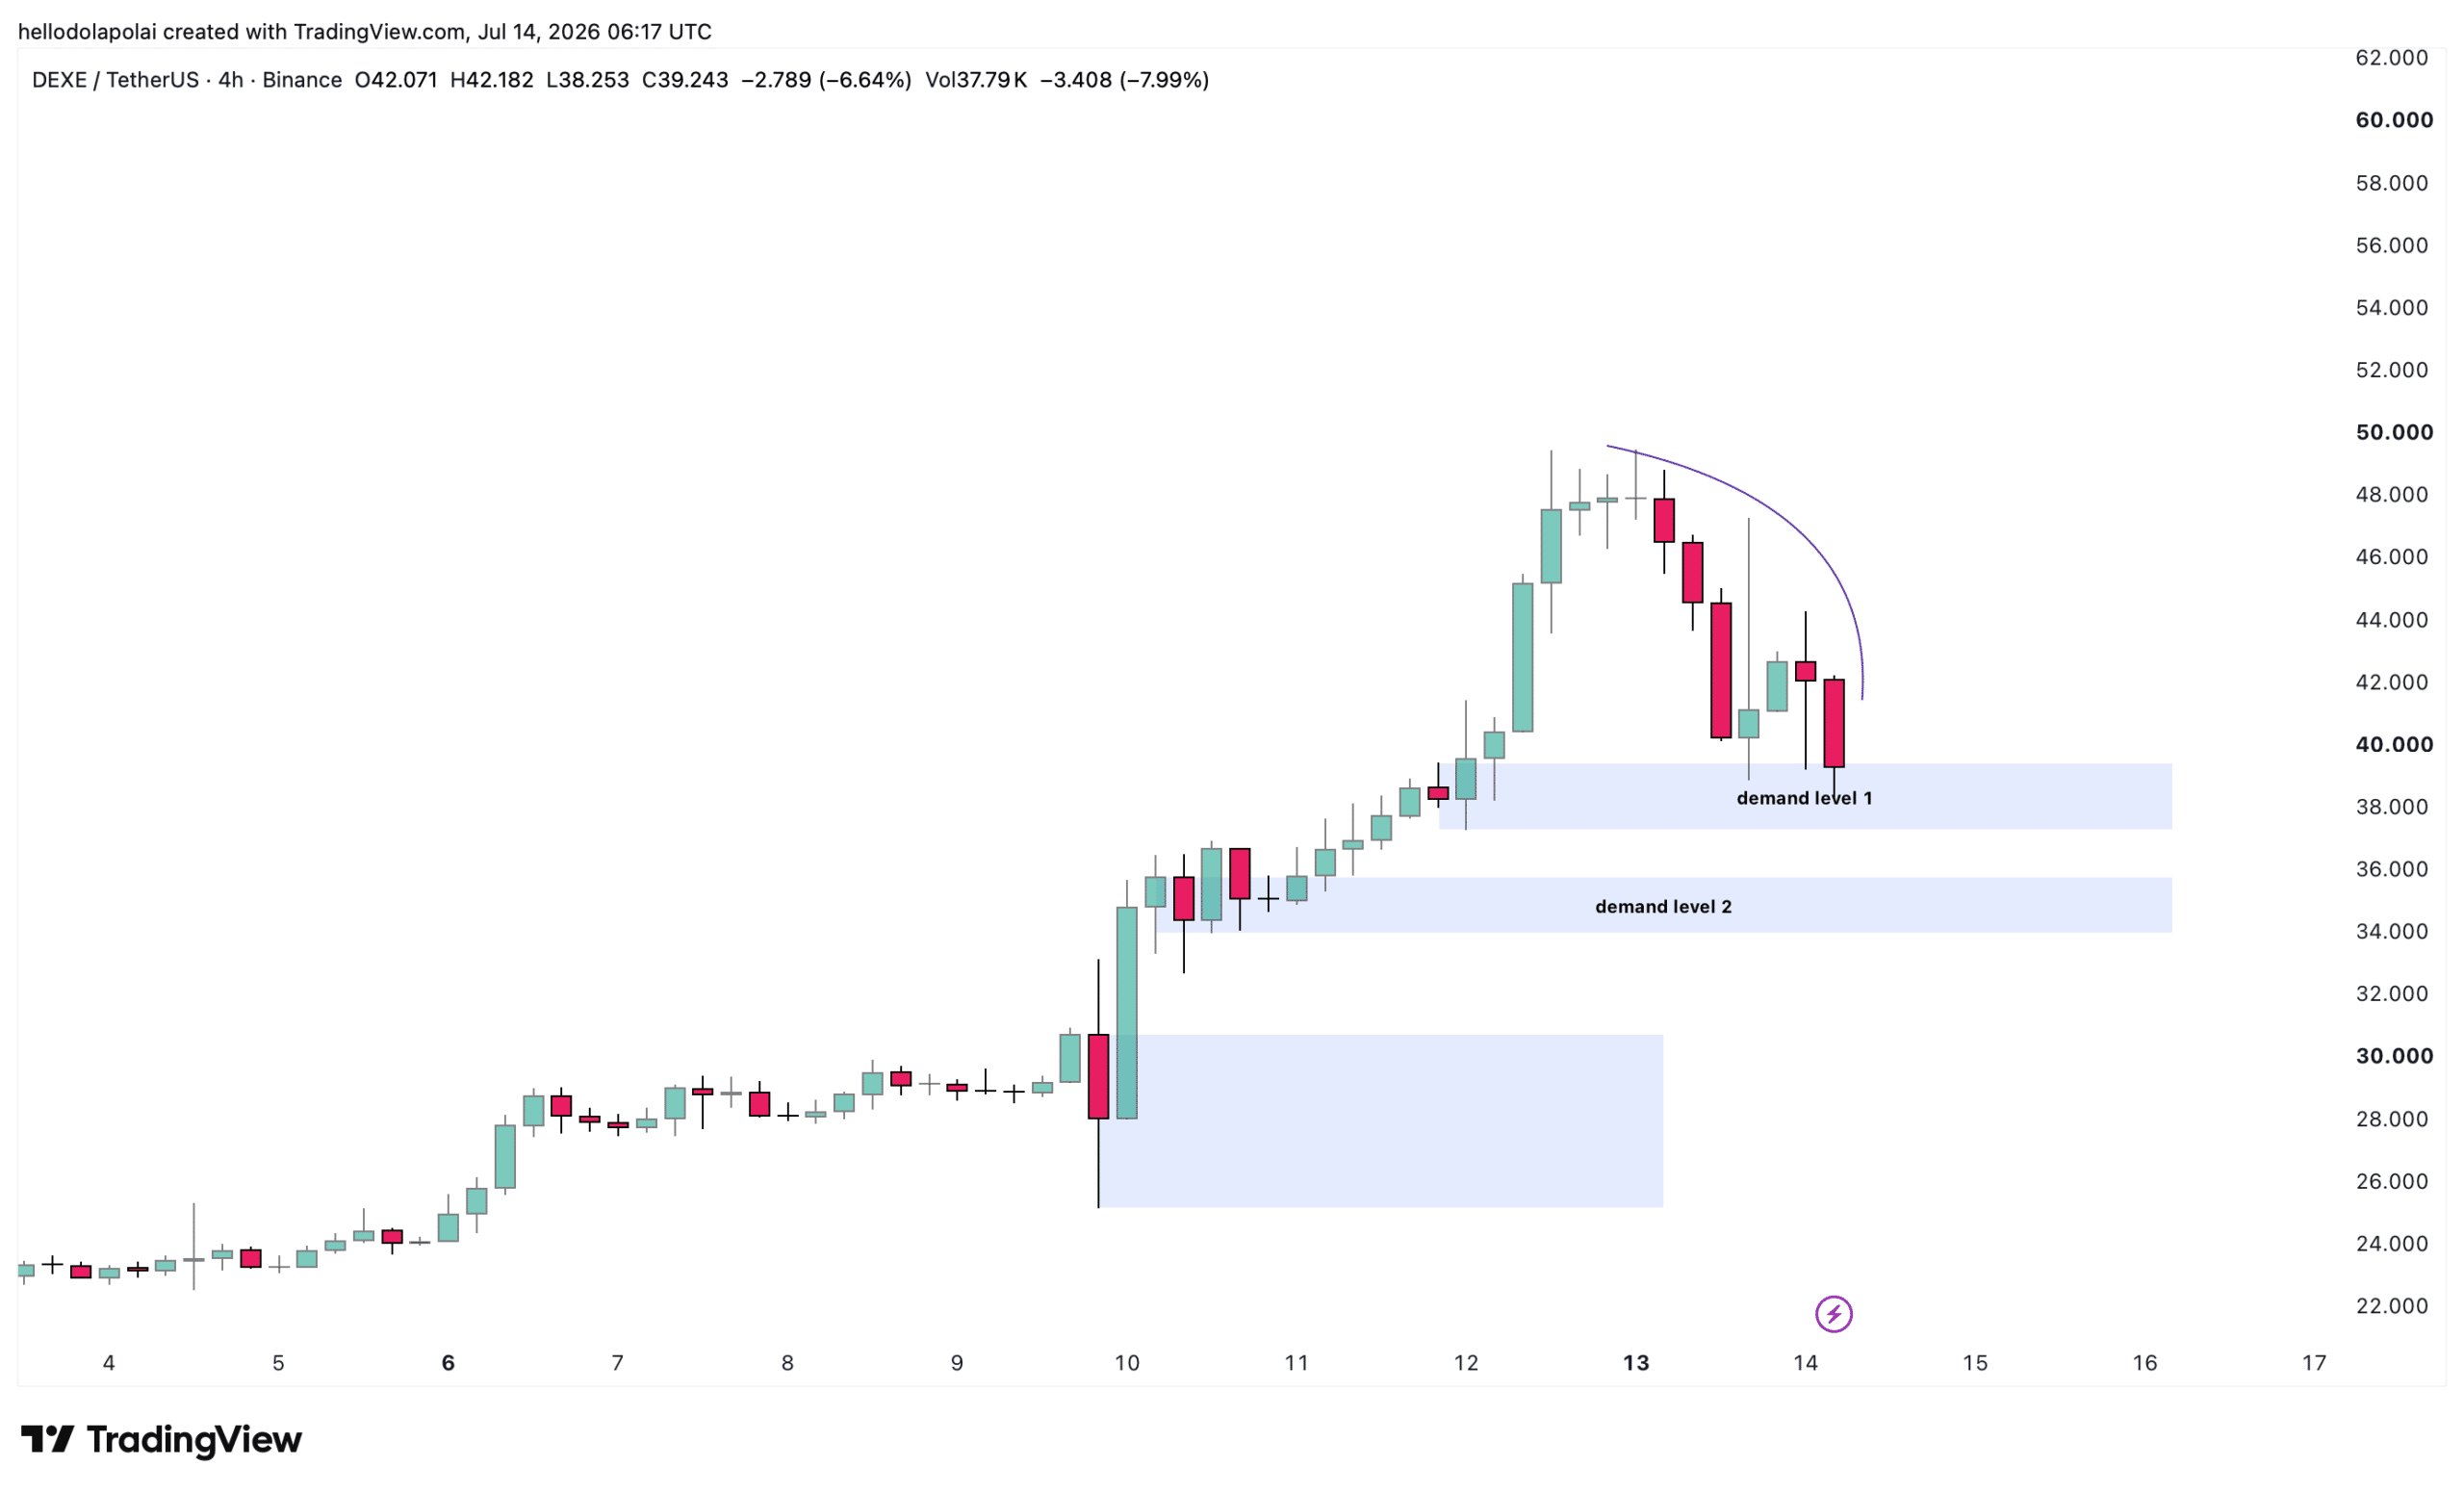
Demand zone 1 offers the first line of support, and a sufficient bounce there could send price swinging upward to clear the overhead liquidity marked by the curved line on the left.

Should selling pressure keep mounting and that level give way, demand zone 2 stands ready to cushion price and absorb the pressure that has weighed on the asset for most of the day.

Demand zone 1 holding remains the likelier scenario, and volume data supports that read, with volume down 36% over the period.

Declining volume alongside a falling price often signals that the momentum driving the move is weak, which opens room for buyers to take control.

Indicators point to a slowdown rather than a reversal

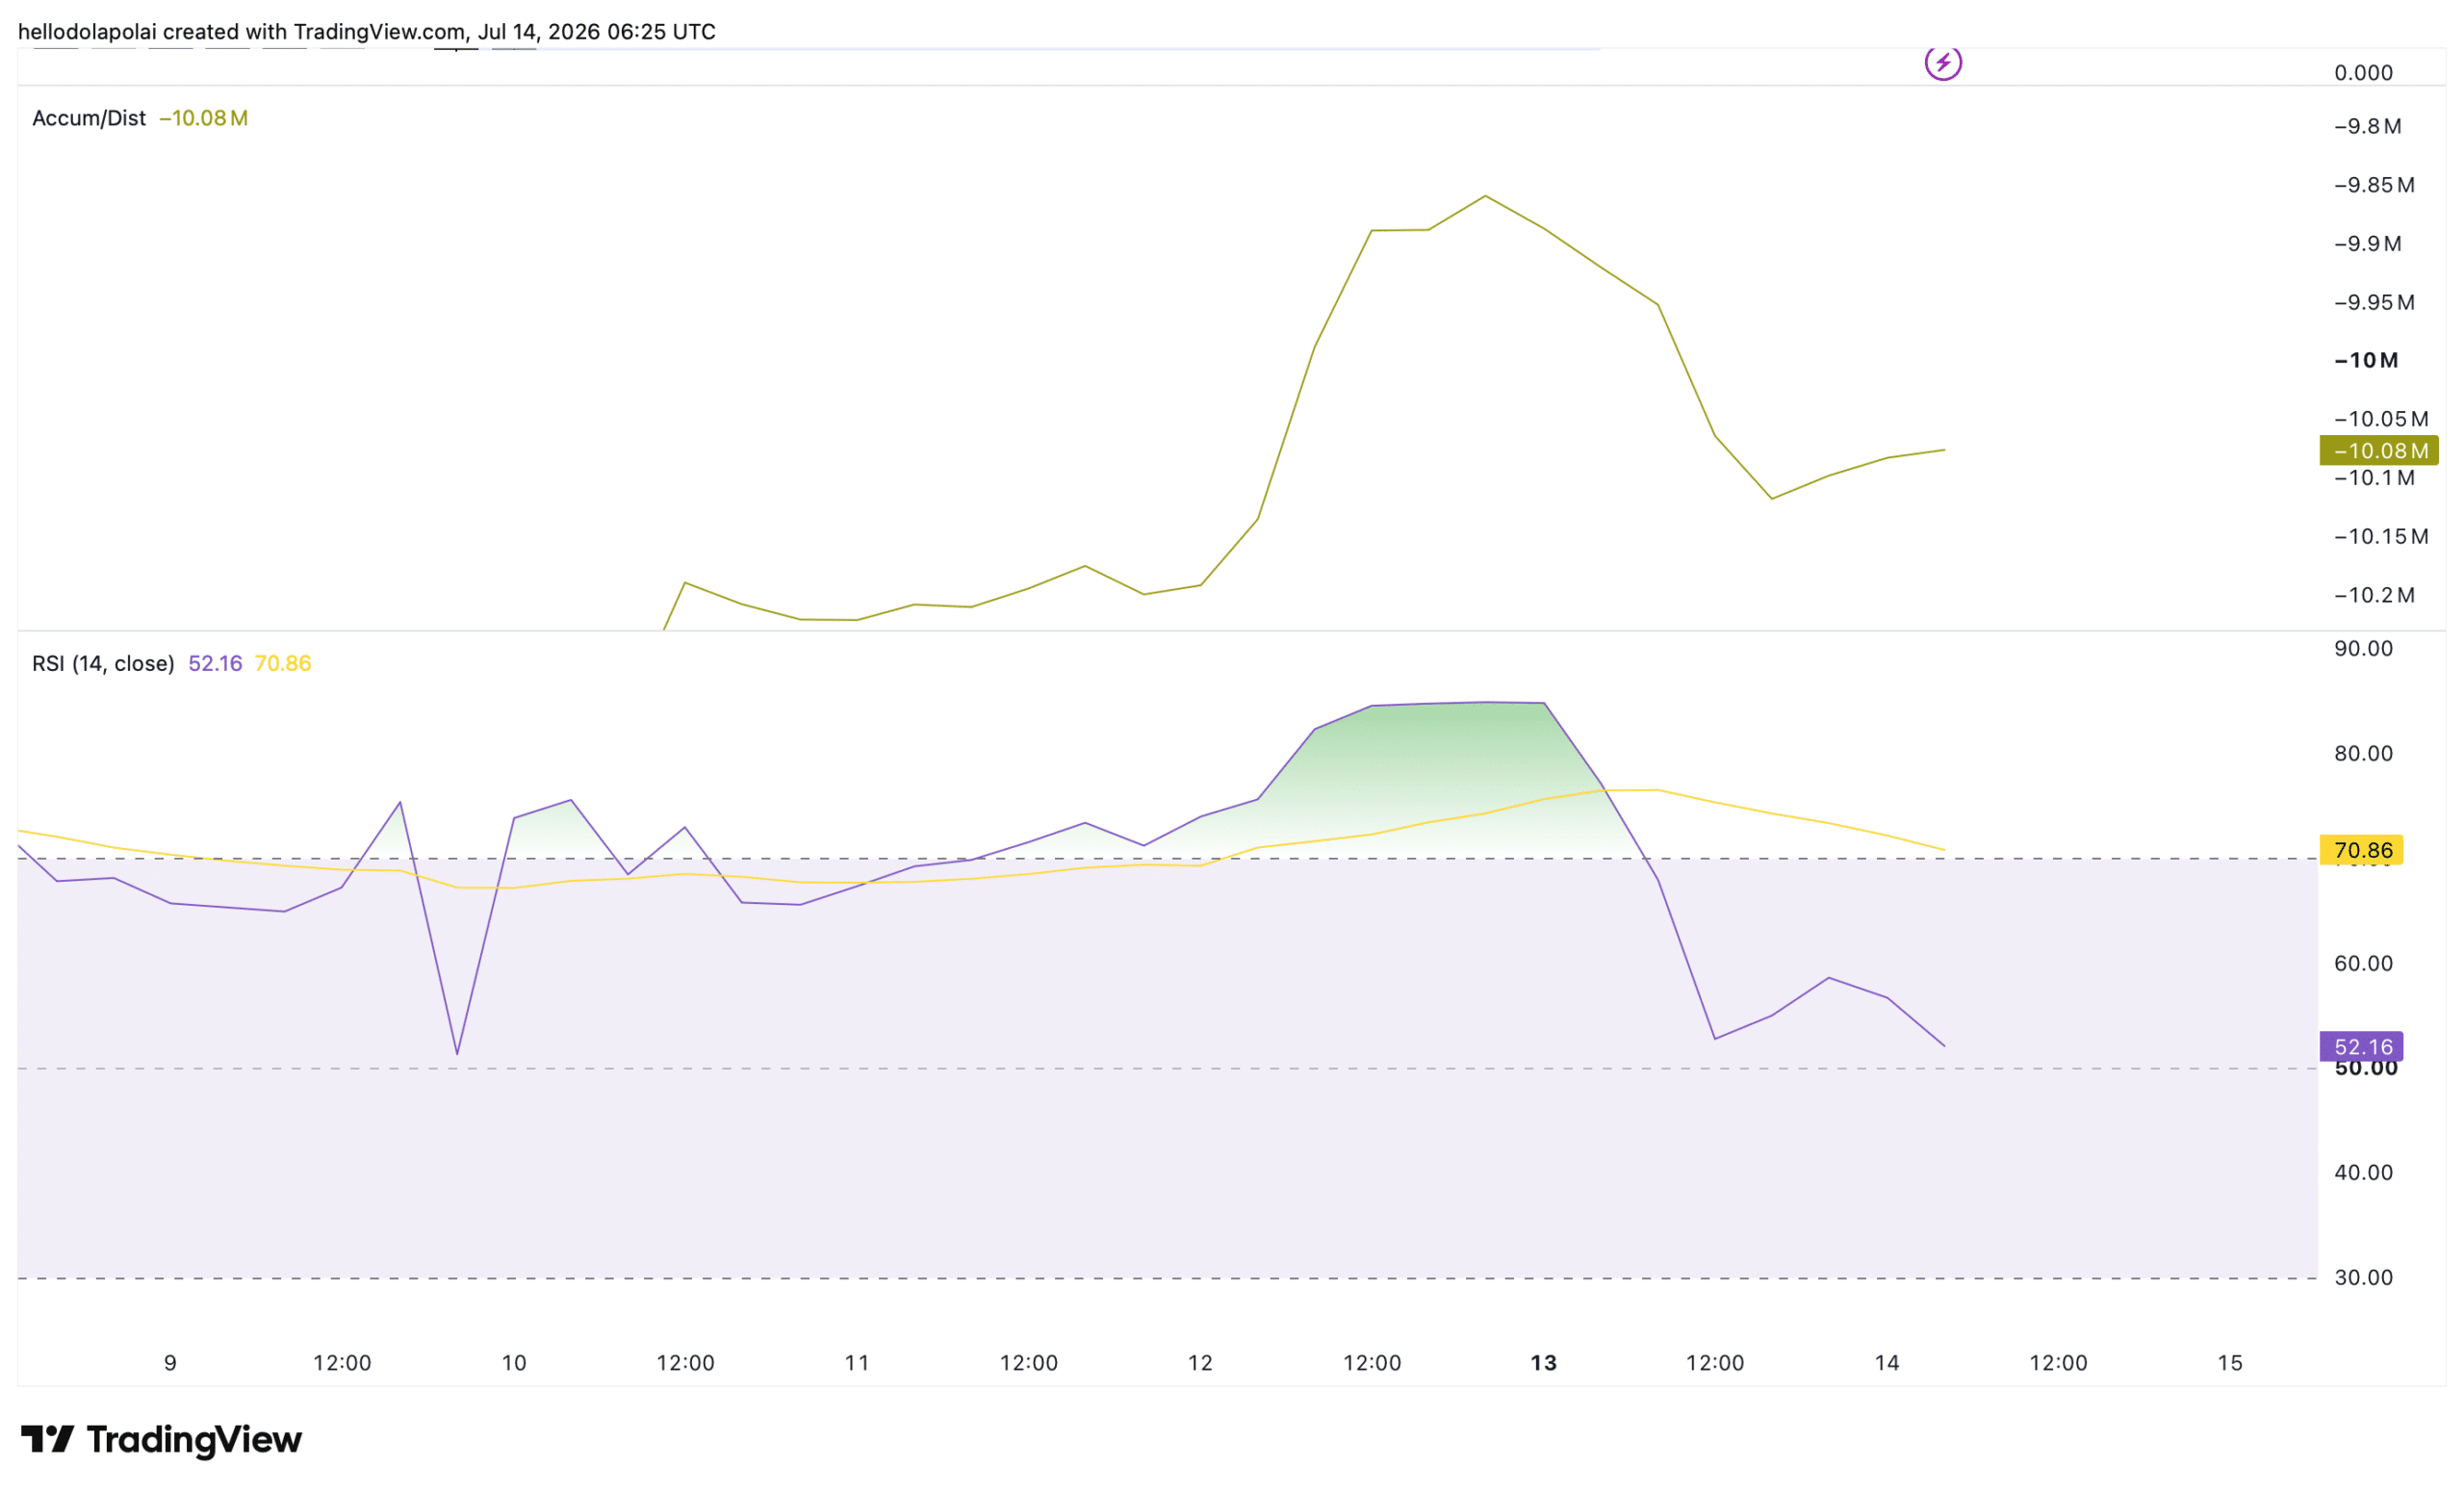
Momentum indicators aren’t fully aligned with the bearish price action, and the Accumulation/Distribution (A/D) indicator captures that tension.

The A/D line weights each period’s volume by where price closes within its range, serving as a proxy for whether an asset is being accumulated or distributed.

At the time of this report, it was trending slightly upward even as prices fell, a divergence that suggests a modest step-up in buyer activity within the period.
Source: TradingView

Likewise, the relative strength index (RSI) is holding within the bullish 50 to 70 band at a reading of 52.

The RSI measures the speed and magnitude of recent price moves, and a reading sitting right on the midline points to neutral, relaxed sentiment rather than a decisive bearish shift.

The balance suggests the price is likely to settle around this level, which coincides with the demand zone.

Sell pressure eases across the Spot market

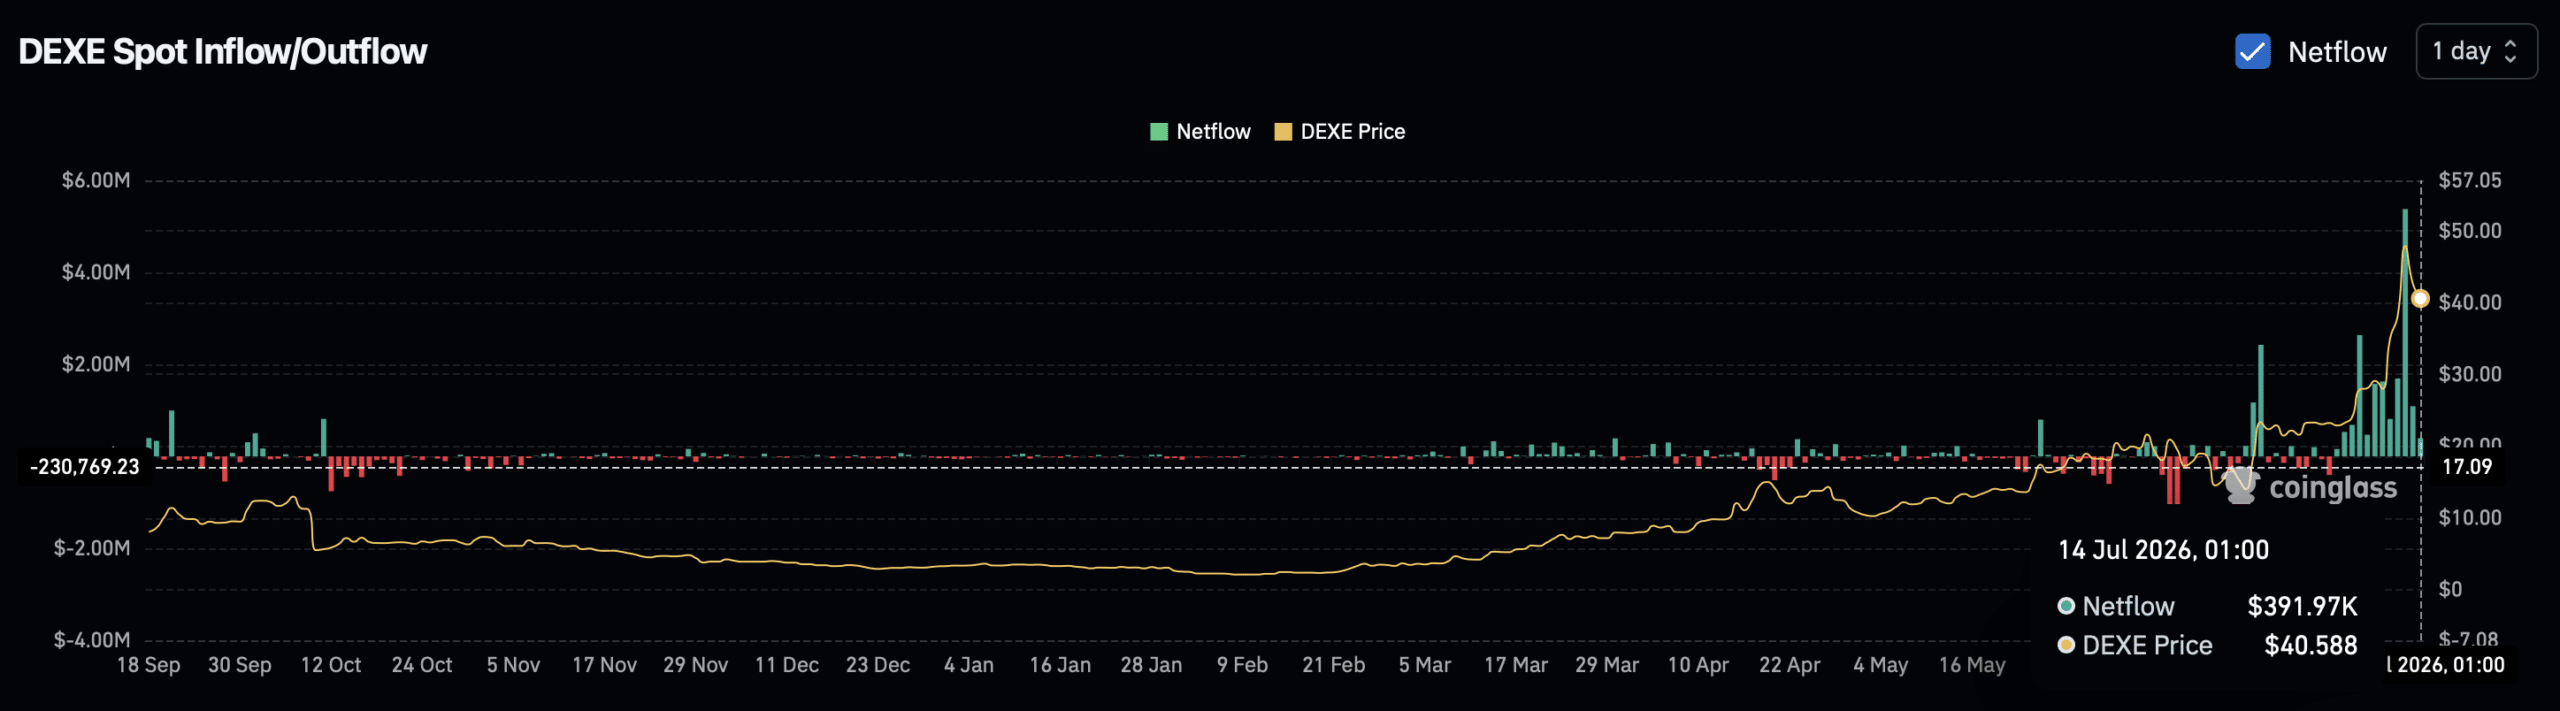
Spot market data points to easing sell pressure so far. Spot netflow hit its highest net sales on the 12th of July as sellers dominated and net inflows reached $5.38 million.

Although sellers still hold the upper hand, the netflow has plunged to just $391,000, more than ten times below the earlier reading.
Source: CoinGlass

This matters because it shows seller strength has weakened sharply on a netflow basis while buyers step in.


Final Summary

  • DeXe has surged more than 1,000% over the past six months, and the current 13% dip looks more like profit-taking after a strong run than a shift in trend.
  • Selling has cooled sharply over the last day, with net sales down more than tenfold from the July 12 peak, a sign that buyers may be stepping back in.


Criptos en tendencia

Preguntas relacionadas

QWhat are the two key demand zones mentioned in the article that could influence DeXe's price?

AThe article mentions Demand zone 1 as the first line of support, and Demand zone 2 as a secondary cushion should selling pressure increase and break the first level.

QWhat do the doji candles (gravestone and dragonfly) observed on DeXe's chart indicate?

AThe gravestone doji indicated intense sell pressure as price attempted to rise, while the dragonfly doji signaled that bulls were stepping back in, exposing a standoff between buyers and sellers.

QWhy does the article suggest the current pullback might be temporary based on trading volume data?

AVolume decreased by 36% alongside the falling price, which often signals weak momentum behind the move and opens room for buyers to take control, suggesting a potential temporary pullback rather than a trend reversal.

QWhat is the significance of the divergence between the A/D (Accumulation/Distribution) line and the price action?

AThe A/D line was trending slightly upward even as prices fell, a divergence suggesting a modest increase in buyer activity (accumulation) during the period, indicating underlying strength.

QWhat key data point from the spot market suggests sell pressure is easing for DeXe?

ANet sales (netflow) have plunged dramatically, from $5.38 million on July 12th to just $391,000, a drop of more than tenfold, indicating seller strength has weakened sharply.

Lecturas Relacionadas

How Long Will the Memory Boom Last?

"The semiconductor storage market is currently experiencing an unprecedented, explosive boom, primarily driven by DRAM and NAND flash. This growth, characterized by a near-vertical surge since 2024, is not due to a massive increase in shipment volume but rather an abnormal spike in prices—approximately a tenfold increase from 2025 to 2026 for both DRAM and NAND. This price surge stems from a severe supply-demand imbalance caused by massive capital investments from hyperscale data center operators (Amazon, Google, Microsoft, Meta) building AI data centers, which act like a "black hole" consuming high-performance memory, particularly HBM. This redirects production capacity away from consumer electronics (PCs, smartphones), creating critical shortages and driving up prices further. The AI-driven boom has rendered previous market forecasts obsolete, with the global semiconductor market now projected to exceed $1.5 trillion by 2026, largely propelled by memory and logic (including GPUs). However, historical analysis of the memory market reveals a consistent pattern: periods of positive annual growth have never lasted more than five consecutive years, inevitably followed by a downturn due to the "silicon cycle" of overinvestment and subsequent oversupply. Given that the current upswing began around 2023, history suggests a peak is likely by 2027-2028. Furthermore, the higher the peak, the deeper the subsequent trough. The current 285% annual growth rate is a historical anomaly, implying the coming recession could be exceptionally severe. While memory manufacturers' stock prices and profits are currently soaring, the author urges the industry to prepare practically for the inevitable downturn while the boom continues."

链捕手Hace 2 hora(s)

How Long Will the Memory Boom Last?

链捕手Hace 2 hora(s)

Trading

Spot

Artículos destacados

Cómo comprar DEXE

¡Bienvenido a HTX.com! Hemos hecho que comprar DeXe (DEXE) sea simple y conveniente. Sigue nuestra guía paso a paso para iniciar tu viaje de criptos.Paso 1: crea tu cuenta HTXUtiliza tu correo electrónico o número de teléfono para registrarte y obtener una cuenta gratuita en HTX. Experimenta un proceso de registro sin complicaciones y desbloquea todas las funciones.Obtener mi cuentaPaso 2: ve a Comprar cripto y elige tu método de pagoTarjeta de crédito/débito: usa tu Visa o Mastercard para comprar DeXe (DEXE) al instante.Saldo: utiliza fondos del saldo de tu cuenta HTX para tradear sin problemas.Terceros: hemos agregado métodos de pago populares como Google Pay y Apple Pay para mejorar la comodidad.P2P: tradear directamente con otros usuarios en HTX.Over-the-Counter (OTC): ofrecemos servicios personalizados y tipos de cambio competitivos para los traders.Paso 3: guarda tu DeXe (DEXE)Después de comprar tu DeXe (DEXE), guárdalo en tu cuenta HTX. Alternativamente, puedes enviarlo a otro lugar mediante transferencia blockchain o utilizarlo para tradear otras criptomonedas.Paso 4: tradear DeXe (DEXE)Tradear fácilmente con DeXe (DEXE) en HTX's mercado spot. Simplemente accede a tu cuenta, selecciona tu par de trading, ejecuta tus trades y monitorea en tiempo real. Ofrecemos una experiencia fácil de usar tanto para principiantes como para traders experimentados.

157 Vistas totalesPublicado en 2024.12.12Actualizado en 2026.06.02

Cómo comprar DEXE

Discusiones

Bienvenido a la comunidad de HTX. Aquí puedes mantenerte informado sobre los últimos desarrollos de la plataforma y acceder a análisis profesionales del mercado. A continuación se presentan las opiniones de los usuarios sobre el precio de DEXE (DEXE).

活动图片