DEXE rallies as trading volume jumps 200%—Can it break $30 next?

ambcryptoPublicado a 2026-07-07Actualizado a 2026-07-07

Resumen

The altcoin market has grown 7% this month, with DeXe (DEXE) standing out as a top performer, gaining 17.5% in 24 hours and seeing a 201% surge in daily trading volume. This indicates strong market conviction behind the rally. Technically, DEXE's daily chart shows a bullish structure, with a recent move from $9.81 to $24.49 followed by a correction and another push higher that has surpassed the 23.6% Fibonacci level. Significant capital inflows support the uptrend. However, momentum indicators like the MACD and Stochastic RSI suggest the rally may be overextended, though a correction is not immediate. On the shorter 2-hour chart, the trend remains strongly bullish. A drop below $26.93 could signal a deeper pullback. Traders are advised to potentially wait for a dip toward $24.65 to buy, but should be aware that a rally past $30 could happen before any significant retracement. Bitcoin's price action near $64k is also noted as a factor that could influence DEXE's trend.

The altcoin market cap has risen by nearly 7% since the start of the month. The top tokens in the AI sector did not show strong short-term upward momentum, except for DeXe [DEXE].

The decentralized social trading and asset management network’s native token has shot higher by 17.5% in the past 24 hours. The daily trading volume has climbed by 201%, a sign of market conviction backing the swift gains.

Towards the end of June, AMBCrypto had reported that the DeXe price action warranted a cautiously bullish bias from swing traders and investors. The ATH in network activity reinforced the altcoin’s remarkable relative strength against the broader crypto market.

A route to and beyond $30 looks increasingly likely
Source: DEXE/USDT on TradingView

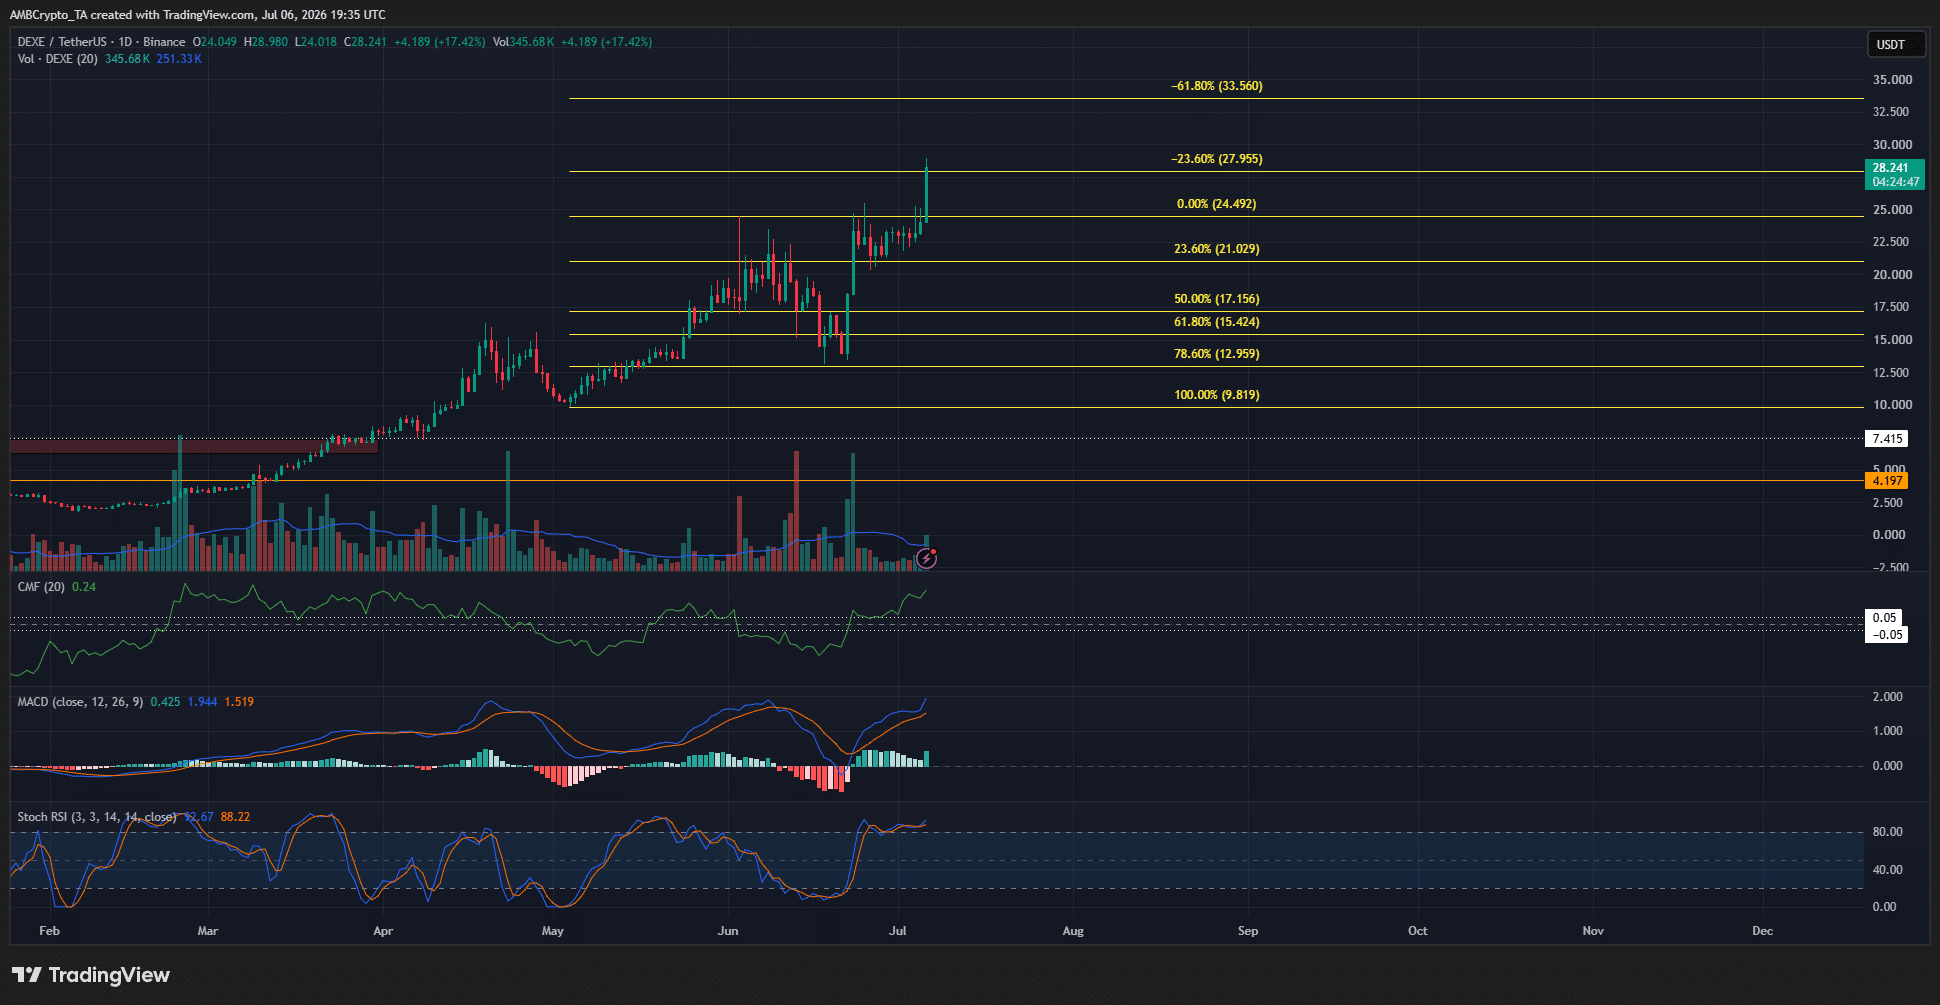
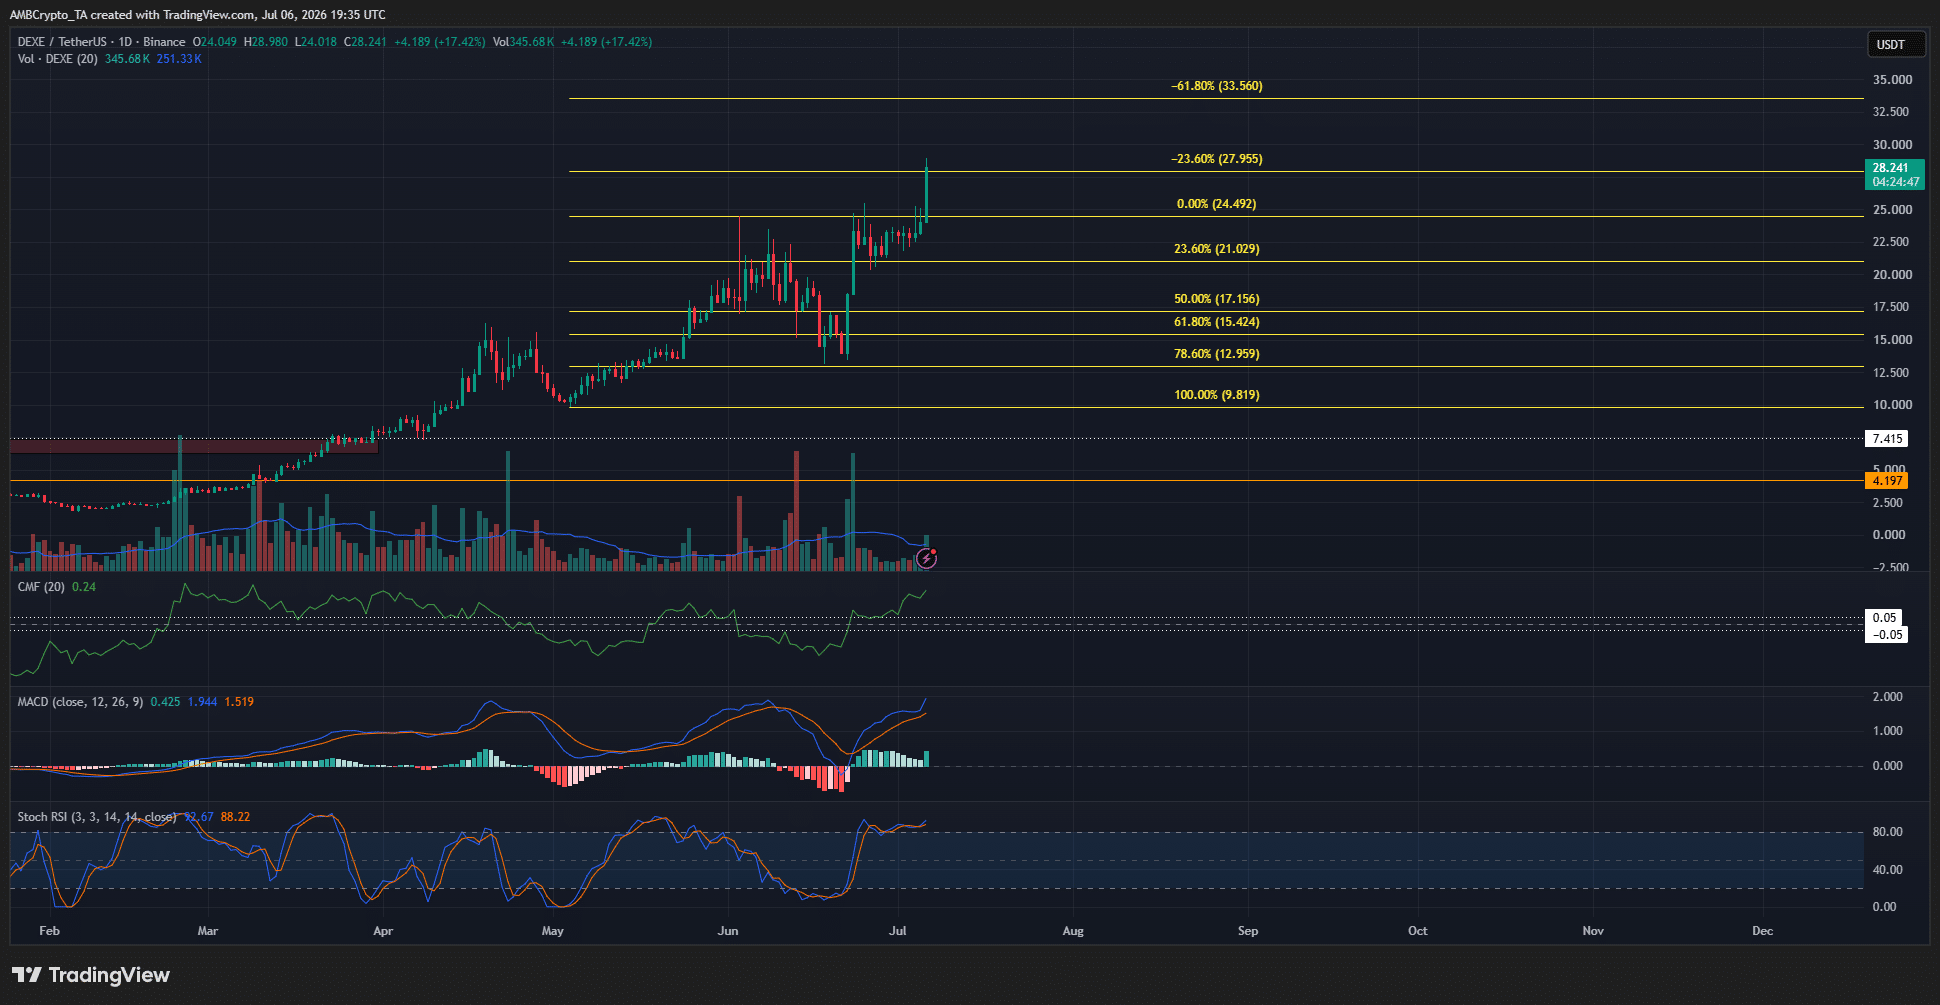
On the 1-day chart, the swing structure for the altcoin was firmly bullish. The latest upward leg from $9.81 to $24.49 was followed by a deep correction and another push higher. This push has not yet ended, but it has surpassed the 23.6% Fibonacci extension level.

The CMF was rising steadily, and its reading of +0.24 showed sizeable capital inflows to keep the DEXE. Alongside the spike in daily trading volume, the volume trends supported the idea of a continued bullish price expansion.

Yet, the MACD was at its highest level it has been in 2026, and the Stochastic RSI was persistently in overbought territory in recent days. The momentum indicators were signaling potential overextended conditions, though it need not bring an immediate price correction.

Traders’ call to action- Wait to buy
Source: DEXE/USDT on TradingView

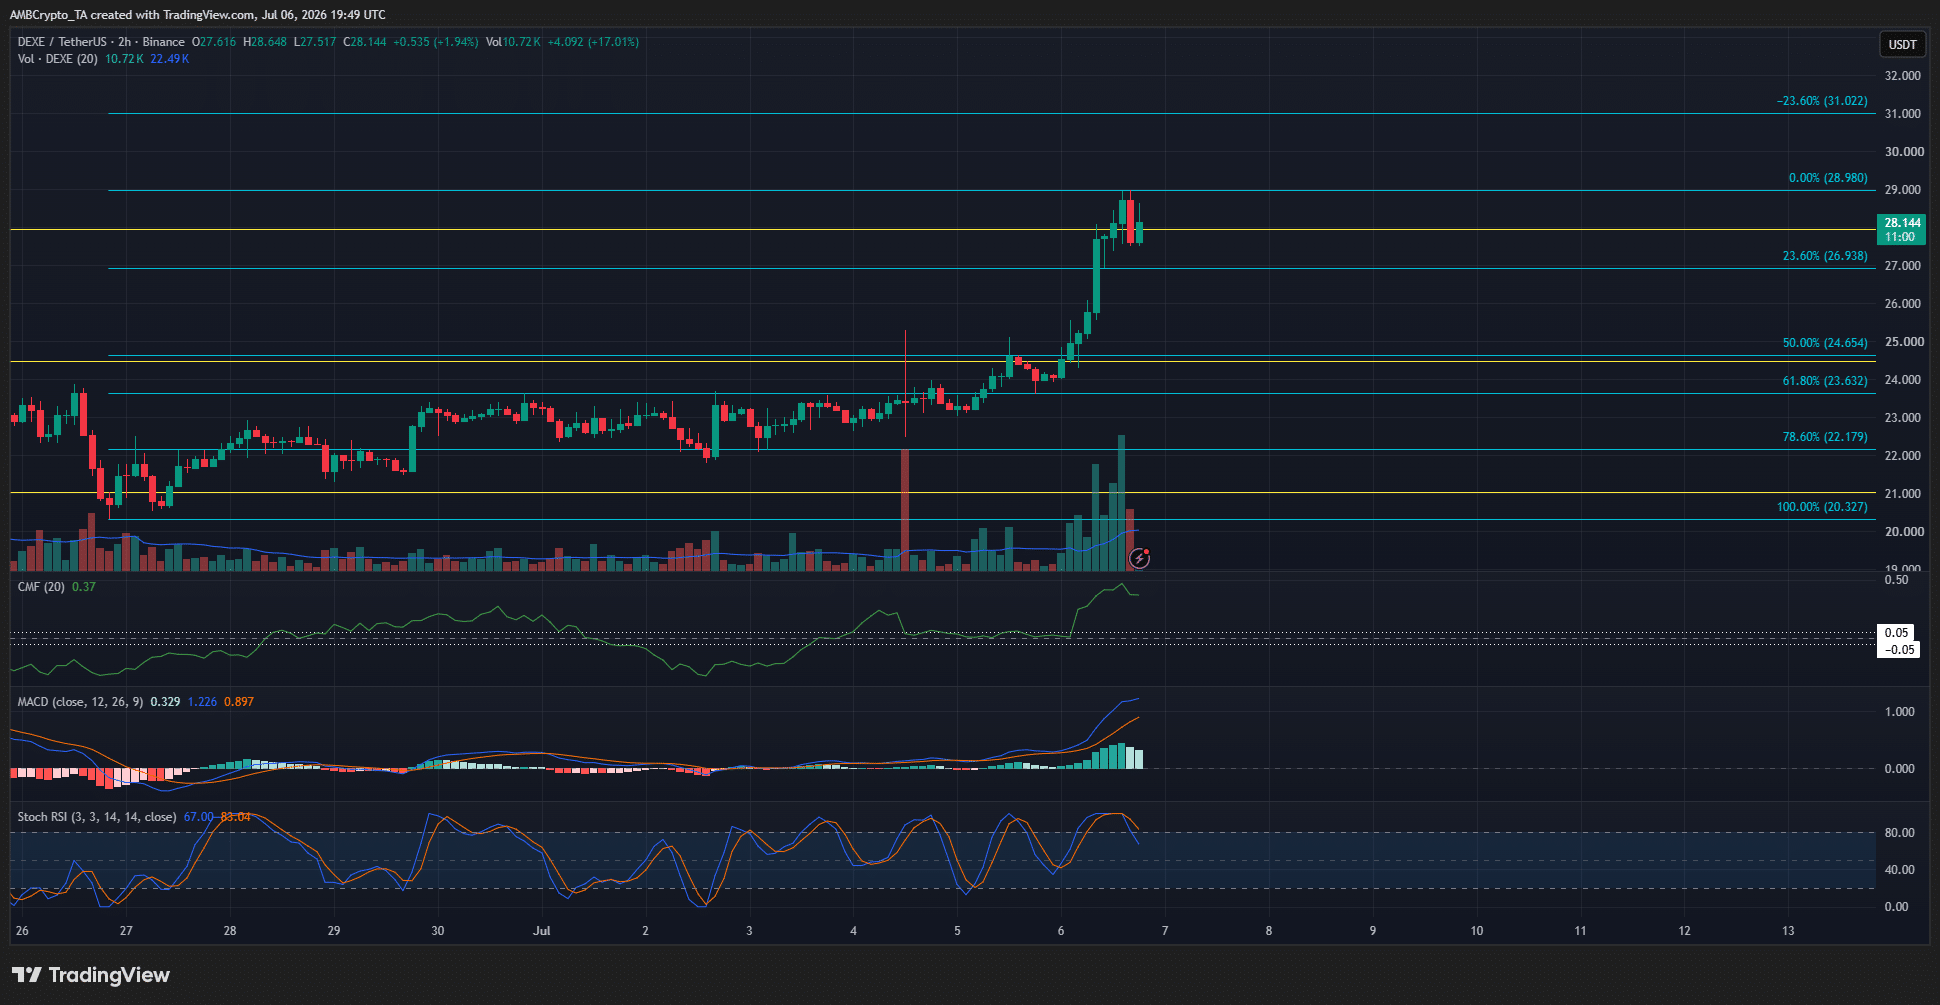
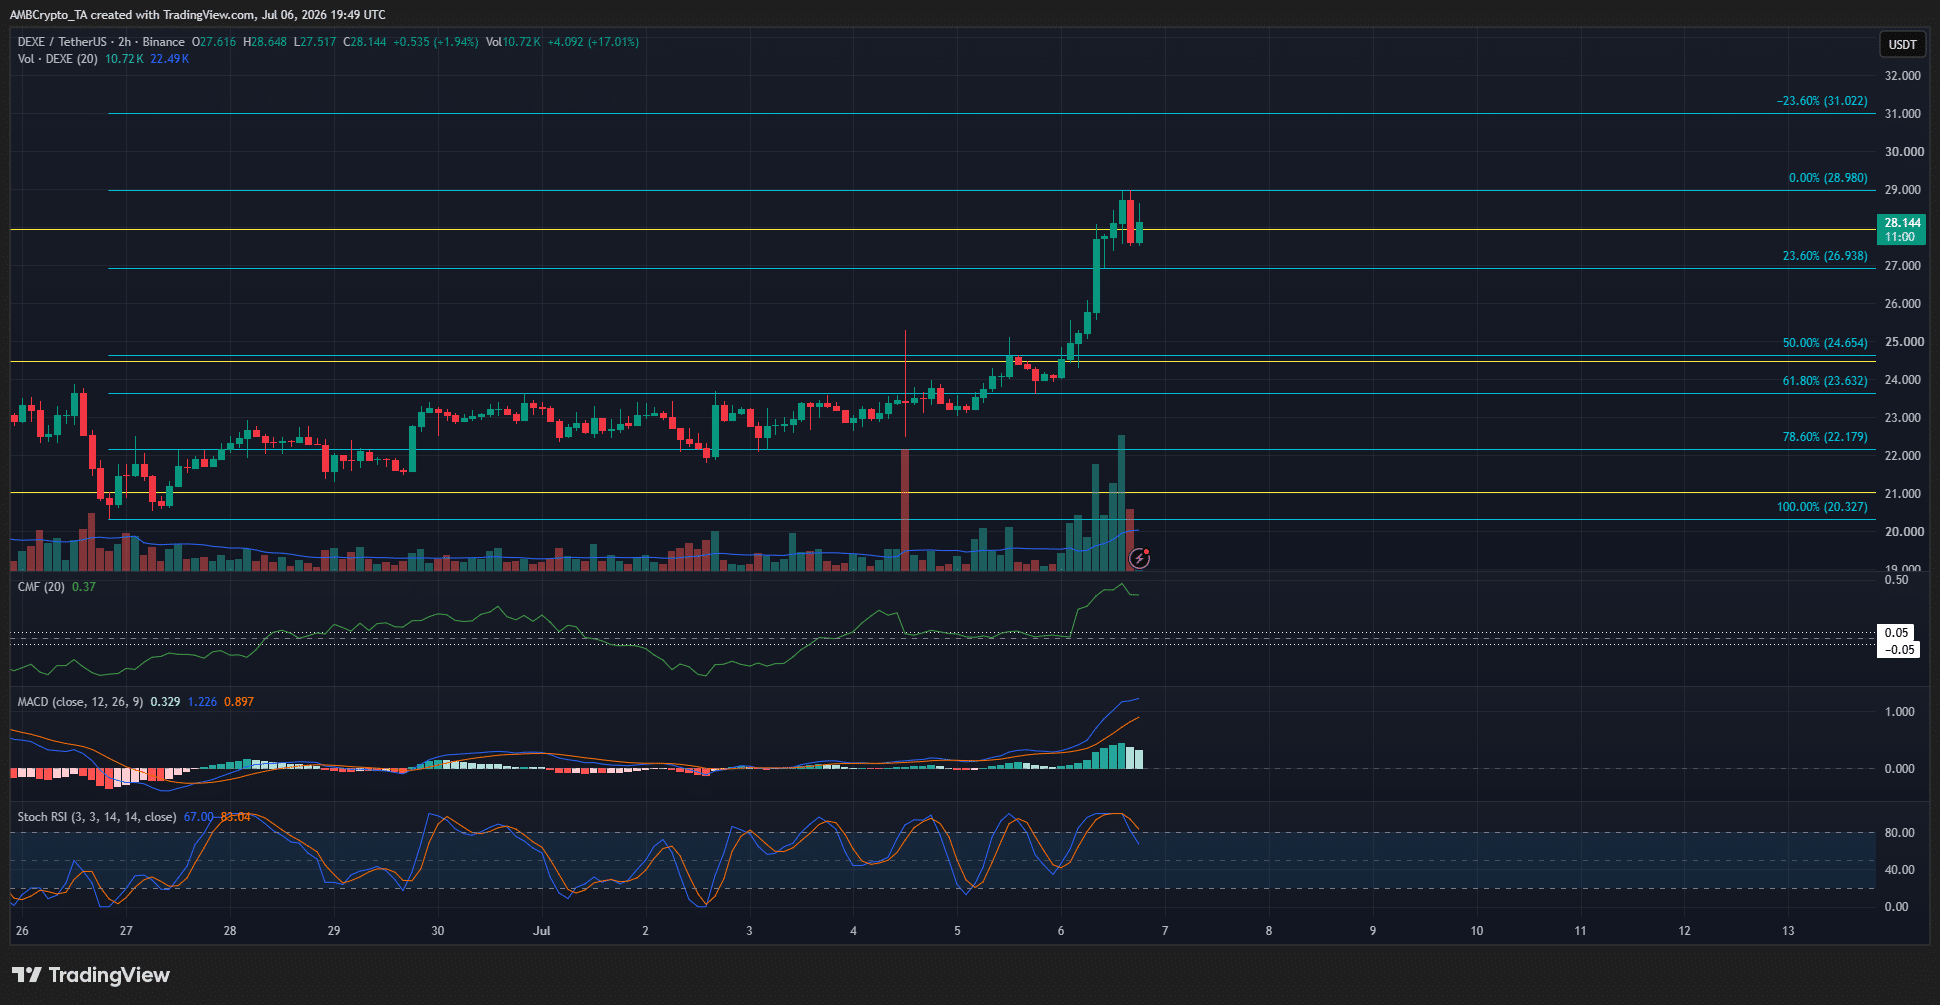
The 2-hour chart was also strongly bullish. It is unclear if further northward expansion would come immediately or if a pullback would start. A drop below $26.93 would be an early sign of a deeper pullback.

Traders and investors can wait for a move toward $24.65 to buy, but also understand that a rally beyond $30 could occur before such a pullback.

Another factor that could affect DEXE trends was Bitcoin [BTC], which was closing in on the $64k local supply zone.


Final Summary

  • The DeXe price action was firmly bullish, and its recent standout performance was not matched by other AI sector tokens either.
  • The relative strength was acompanied by high buying volume, and it is unclear if the momentum would see a deep correction below $25 before continuing higher.


Criptos en tendencia

Preguntas relacionadas

QWhat are the key factors that have contributed to the recent price rally of DeXe (DEXE)?

AThe recent price rally of DEXE is attributed to a 201% surge in daily trading volume, showing strong market conviction. The Chaikin Money Flow (CMF) reading of +0.24 indicates substantial capital inflows, and the overall swing structure on the 1-day chart is firmly bullish, with price action showing remarkable relative strength against the broader market.

QAccording to the technical analysis on the 1-day chart, what potential warning signs are present for DEXE's momentum?

AThe momentum indicators on the 1-day chart show potential warning signs. The MACD is at its highest level in 2026, and the Stochastic RSI has been persistently in overbought territory in recent days. These signals indicate potentially overextended conditions, though the article notes this may not lead to an immediate price correction.

QWhat is the suggested trading strategy for DEXE based on the 2-hour chart analysis?

ABased on the 2-hour chart analysis, the suggested strategy is for traders to wait for a potential pullback to buy. Specifically, waiting for a move toward $24.65 is mentioned as a buying opportunity. However, it also cautions that a rally beyond $30 could occur before such a pullback, and a drop below $26.93 would be an early sign of a deeper correction.

QHow did the performance of DEXE compare to other tokens in the AI sector, according to the article?

ADEXE's performance stood out compared to other tokens in the AI sector. While the altcoin market cap rose by nearly 7%, the top tokens in the AI sector did not show strong short-term upward momentum. DEXE was the exception, rallying 17.5% in the past 24 hours and demonstrating remarkable relative strength.

QWhat external factor, besides its own metrics, could affect DEXE's price trends according to the article?

AThe article states that Bitcoin (BTC) is an external factor that could affect DEXE's price trends. It mentions that Bitcoin was closing in on the $64k local supply zone at the time, implying that BTC's price action could have a subsequent impact on DEXE's market movements.

Lecturas Relacionadas

How Token Economy Reshapes the Business Rules of AI 'Measurement' | ToB Industry Observation

"Token Economy: How It Reshapes the Business Rules of AI's 'Metrics' | ToB Industry Observation" The article discusses how the token economy is fundamentally changing the business landscape for AI, moving from a phase of explosive technical supply to a focus on measurable value for enterprise demand. It highlights the astronomical growth in daily token usage in China, framing tokens as the new "measurement standard" or "electricity" of the intelligent era. A central challenge is determining a token's value, which varies drastically—up to 100,000x—across different applications, from drug discovery to casual chat. The concept of "high-quality tokens" that deliver real intelligence, versus "noise," is emphasized as crucial. Lenovo's Vice President shares three proposed "laws" of token economics: 1. **Law of Inertia:** The cost per token will continuously decline due to technological innovation, system optimization, and intelligent runtime scheduling. 2. **Law of Acceleration:** The value generated per token accelerates based on the depth of AI integration into business workflows, the level of engineering support, and organizational readiness. 3. **Law of the Singularity:** A tipping point where the value curve of AI application surpasses its cost curve, shifting from cost-saving to generating incremental, previously impossible value—enabling "innovation at scale." The article notes real-world struggles, such as companies exceeding AI budgets due to unpredictable token pricing and "token inflation" from agentic AI workflows. Solutions being explored include standardized metrics for token quality, transparent pricing, and new infrastructure like "Token Factories" for efficient, on-demand token production. The ultimate goal is for businesses to move past anxiety and reach the "singularity," where AI drives scalable innovation, akin to how electricity enabled countless modern appliances.

marsbitHace 11 min(s)

How Token Economy Reshapes the Business Rules of AI 'Measurement' | ToB Industry Observation

marsbitHace 11 min(s)

Bitcoin Rebounds to $64k as Fed Rate Hike Expectations Plummet?

Bitcoin rebounded strongly this week, climbing back above $60,000 and briefly touching $64,000. This recovery followed a significant drop after the U.S. presidential election, with the market now closely watching Federal Reserve policy signals. The key trigger was a weaker-than-expected June U.S. jobs report, showing only 57,000 new jobs versus an expected 115,000. While the unemployment rate fell, analysts noted concerning details like declining labor force participation. However, wage growth accelerated to 3.5% year-over-year, sustaining inflation concerns. Market focus has shifted to the upcoming July Consumer Price Index (CPI) data. Analysts expect a monthly decline in overall prices, partly due to falling gasoline costs. This has led traders to reduce bets on further Fed rate hikes this year, with markets now pricing in a high probability of rates holding steady at the July meeting. Fed Chair Kevin Warsh's recent comments about easing inflation risks have further supported this dovish shift. The anticipation of lower borrowing costs and a weaker dollar is seen as supportive for risk-sensitive assets like Bitcoin. Some investors are positioning for a potential Fed policy pivot to easing later this year, which could benefit "devaluation trades" including cryptocurrencies. Looking ahead, Bitcoin's price trajectory remains highly sensitive to U.S. economic data—particularly jobs and inflation reports—and evolving Fed policy expectations. Other critical factors include institutional ETF flows and geopolitical developments. Analysts suggest that if these factors improve, the recent sell-off could be seen as a buying opportunity; otherwise, high volatility may persist until a solid price floor is established.

marsbitHace 31 min(s)

Bitcoin Rebounds to $64k as Fed Rate Hike Expectations Plummet?

marsbitHace 31 min(s)

Trading

Spot

Artículos destacados

Cómo comprar CAP

¡Bienvenido a HTX.com! Hemos hecho que comprar Cap (CAP) sea simple y conveniente. Sigue nuestra guía paso a paso para iniciar tu viaje de criptos.Paso 1: crea tu cuenta HTXUtiliza tu correo electrónico o número de teléfono para registrarte y obtener una cuenta gratuita en HTX. Experimenta un proceso de registro sin complicaciones y desbloquea todas las funciones.Obtener mi cuentaPaso 2: ve a Comprar cripto y elige tu método de pagoTarjeta de crédito/débito: usa tu Visa o Mastercard para comprar Cap (CAP) al instante.Saldo: utiliza fondos del saldo de tu cuenta HTX para tradear sin problemas.Terceros: hemos agregado métodos de pago populares como Google Pay y Apple Pay para mejorar la comodidad.P2P: tradear directamente con otros usuarios en HTX.Over-the-Counter (OTC): ofrecemos servicios personalizados y tipos de cambio competitivos para los traders.Paso 3: guarda tu Cap (CAP)Después de comprar tu Cap (CAP), guárdalo en tu cuenta HTX. Alternativamente, puedes enviarlo a otro lugar mediante transferencia blockchain o utilizarlo para tradear otras criptomonedas.Paso 4: tradear Cap (CAP)Tradear fácilmente con Cap (CAP) en HTX's mercado spot. Simplemente accede a tu cuenta, selecciona tu par de trading, ejecuta tus trades y monitorea en tiempo real. Ofrecemos una experiencia fácil de usar tanto para principiantes como para traders experimentados.

34 Vistas totalesPublicado en 2026.06.26Actualizado en 2026.06.26

Cómo comprar CAP

Discusiones

Bienvenido a la comunidad de HTX. Aquí puedes mantenerte informado sobre los últimos desarrollos de la plataforma y acceder a análisis profesionales del mercado. A continuación se presentan las opiniones de los usuarios sobre el precio de CAP (CAP).

活动图片