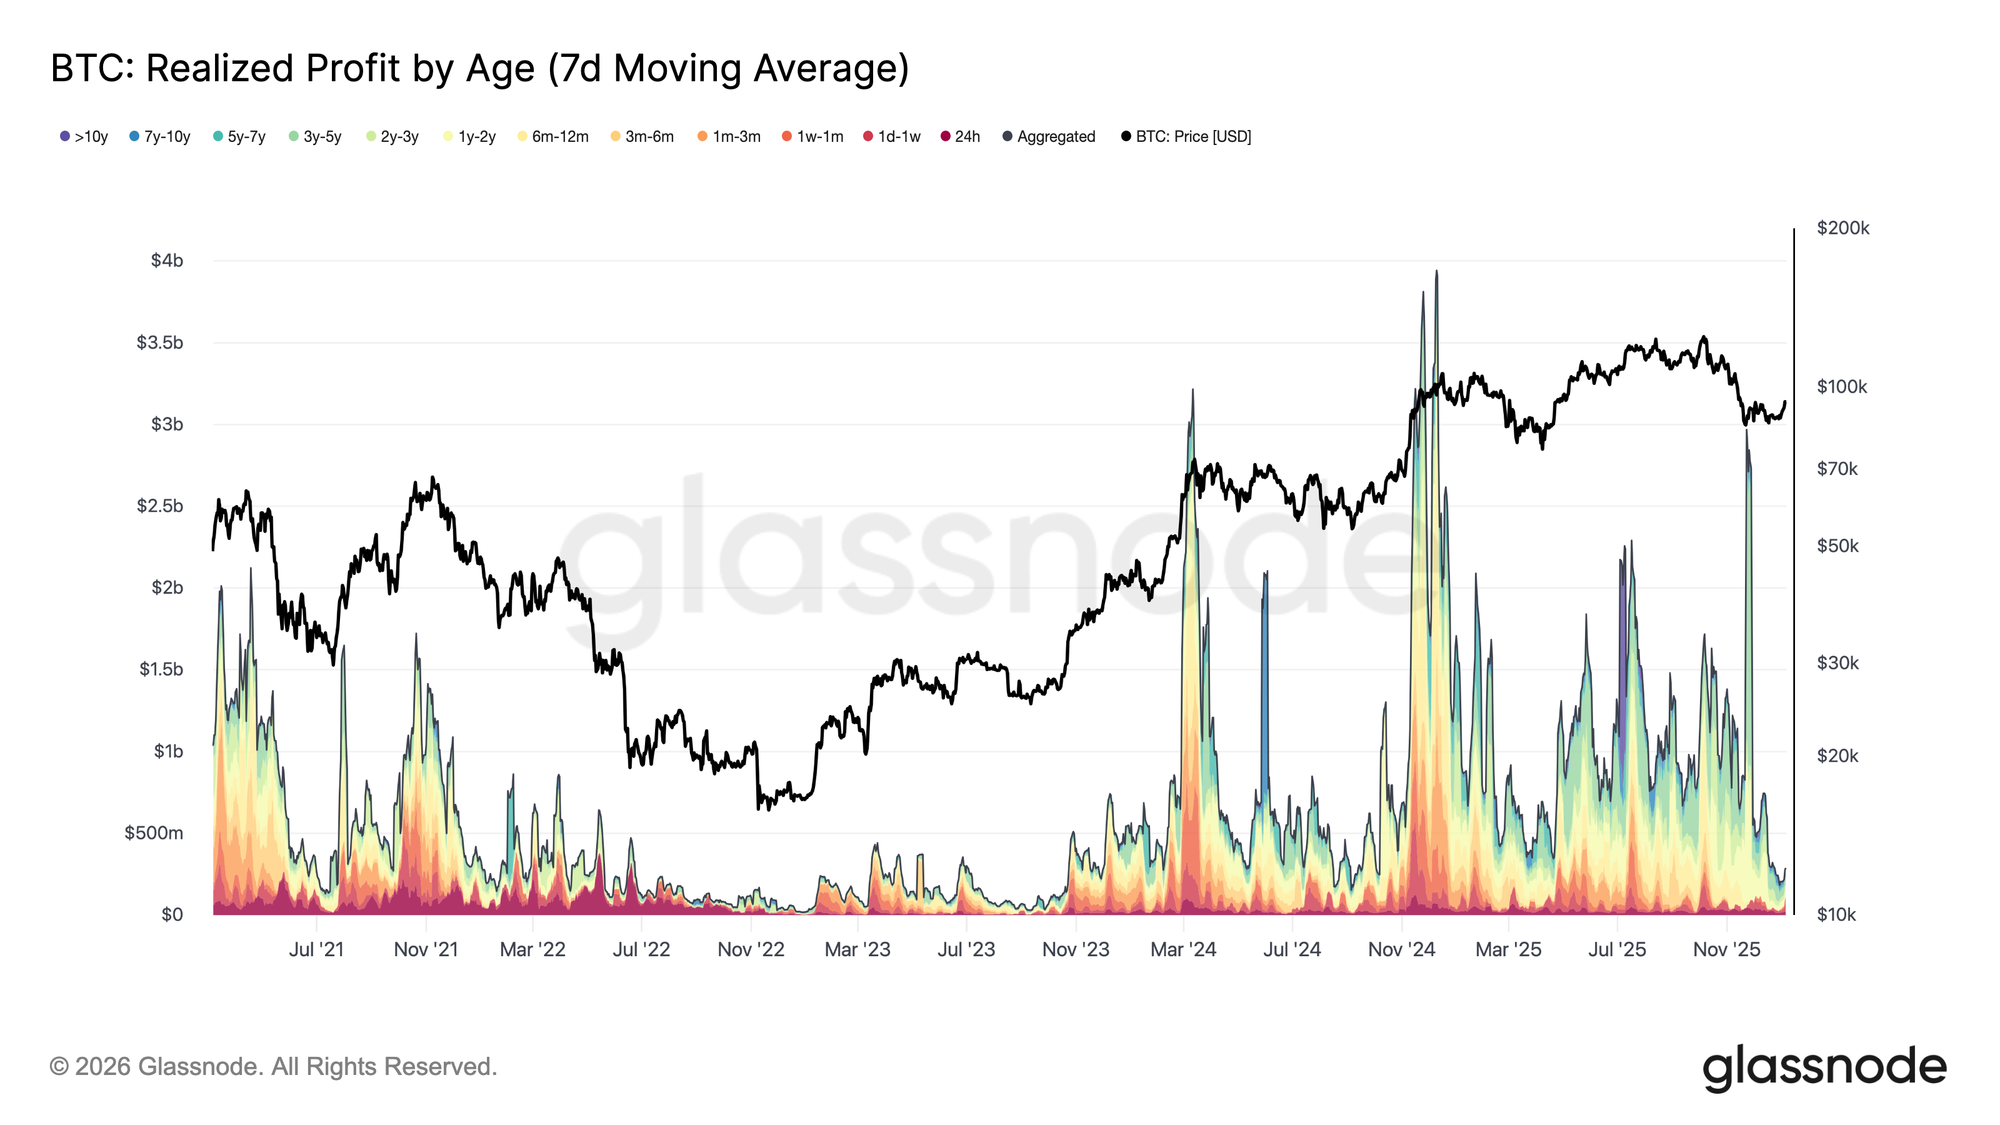
Over the first week of 2026, Bitcoin broke out from a prolonged compression around the ~$87k level, rallying by approximately 8.5% to reach $94.4k. This upside expansion followed a marked cooling in profit-taking pressure across the market. In late December 2025, Realized Profit (7D-SMA) declined sharply to $183.8M per day, down from the elevated levels above $1B per day observed through much of Q4.
This deceleration in realized gains, particularly among longer-term holders, signalled an exhaustion of distribution-side pressure that had been anchoring price action in the prior quarter. As sell-side intensity eased, the market was able to stabilize, regain composure, and support a renewed upside impulse. The early-January breakout thus reflects a market that had effectively reset its profit-taking pressure, allowing the price to move higher.
Facing Overhead Supply
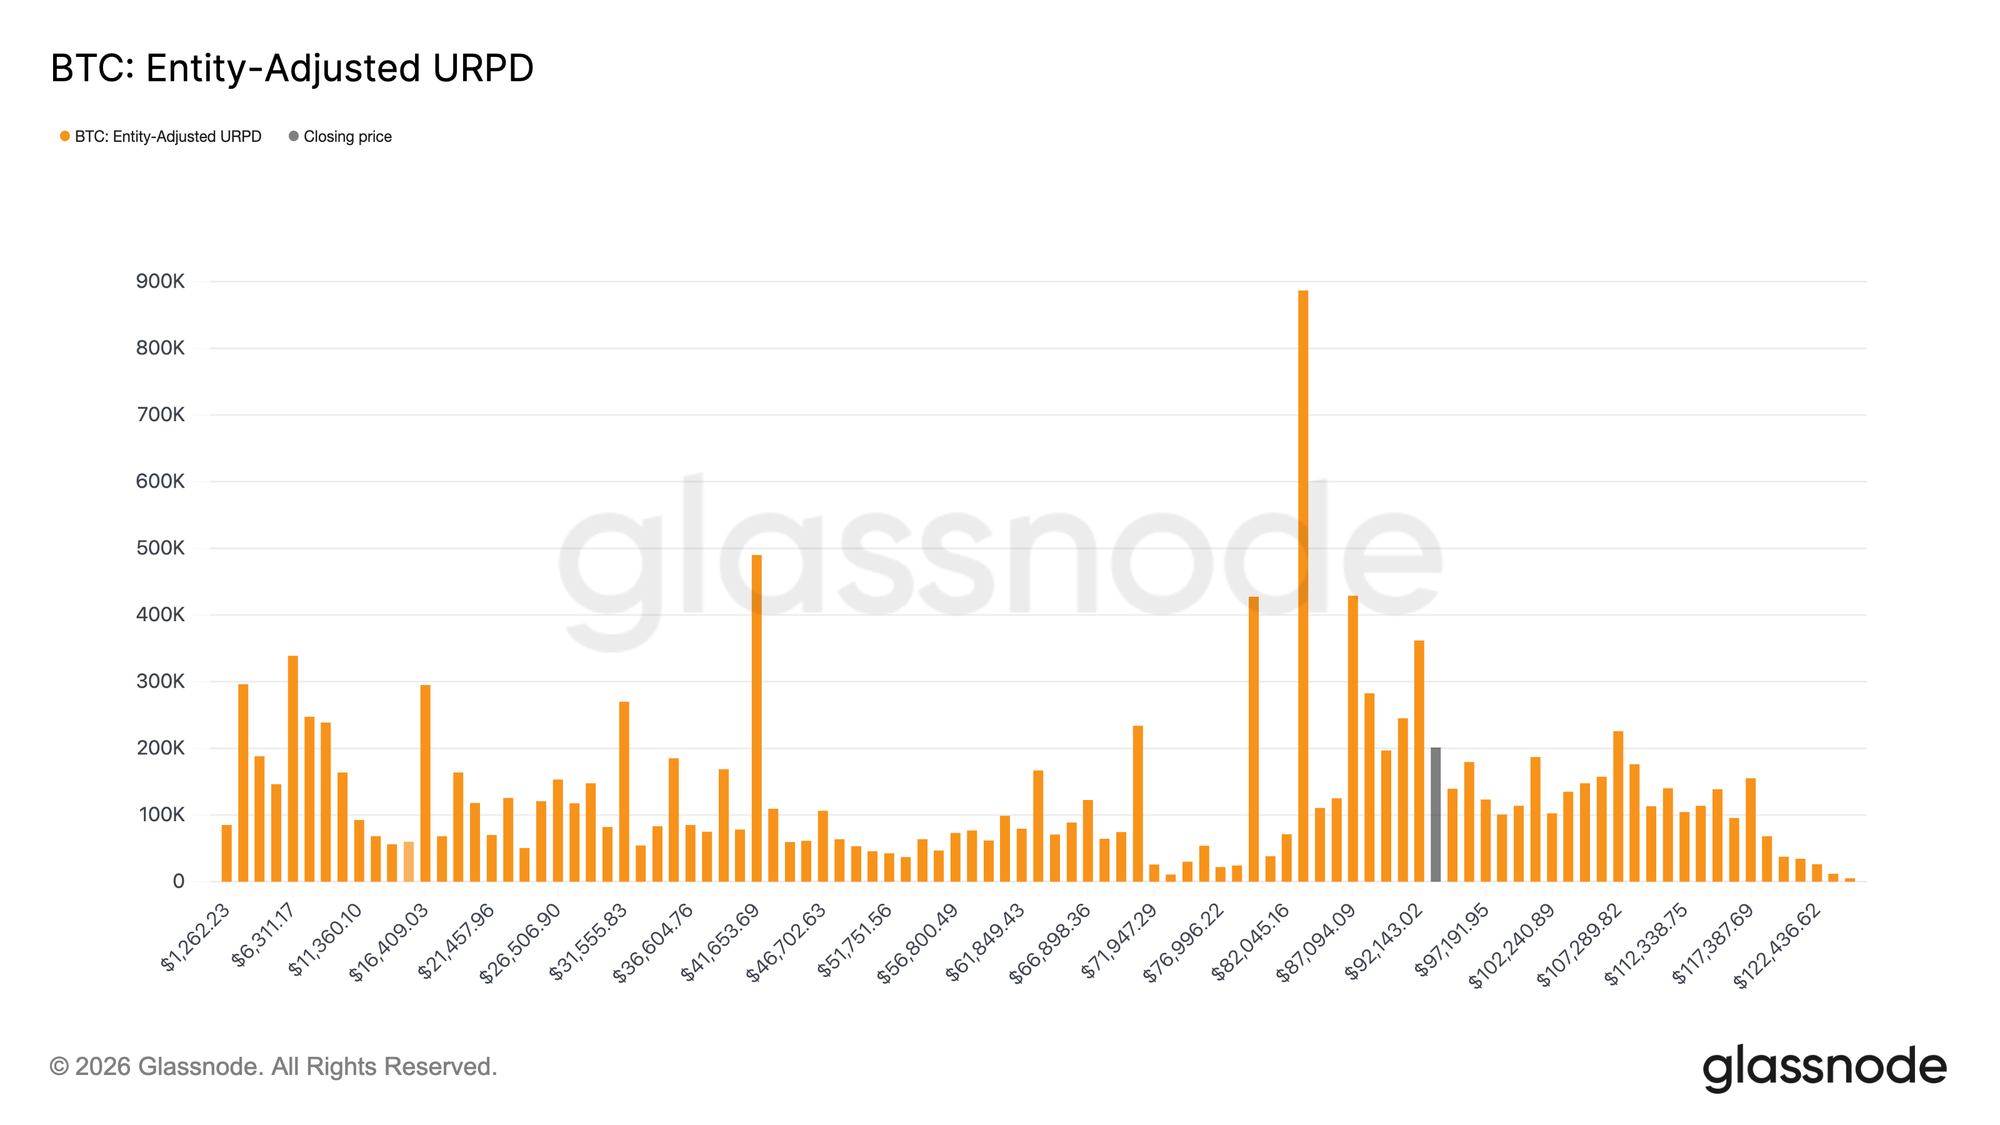
With profit-taking pressure easing, price has been able to extend higher, but this relief rally is now pushing into a structurally different supply regime. The market has entered a zone dominated by recent top buyers, whose cost basis is densely distributed between $92.1k and $117.4k. As highlighted by the UTXO Realized Price Distribution (URPD), this cohort accumulated heavily near the cycle highs and held through the drawdown from the ATH to ~$80k, before experiencing the ongoing rebound.
As a result, the market now faces rising breakeven sell-side pressure, as these investors regain the opportunity to exit positions without realizing losses. This creates a natural friction point for further upside. Consequently, any attempt to revive a sustained bull phase will likely require time and resilience to absorb this overhead supply, allowing price to progress beyond the recent buyers’ distribution zone.
Key Recovery Threshold
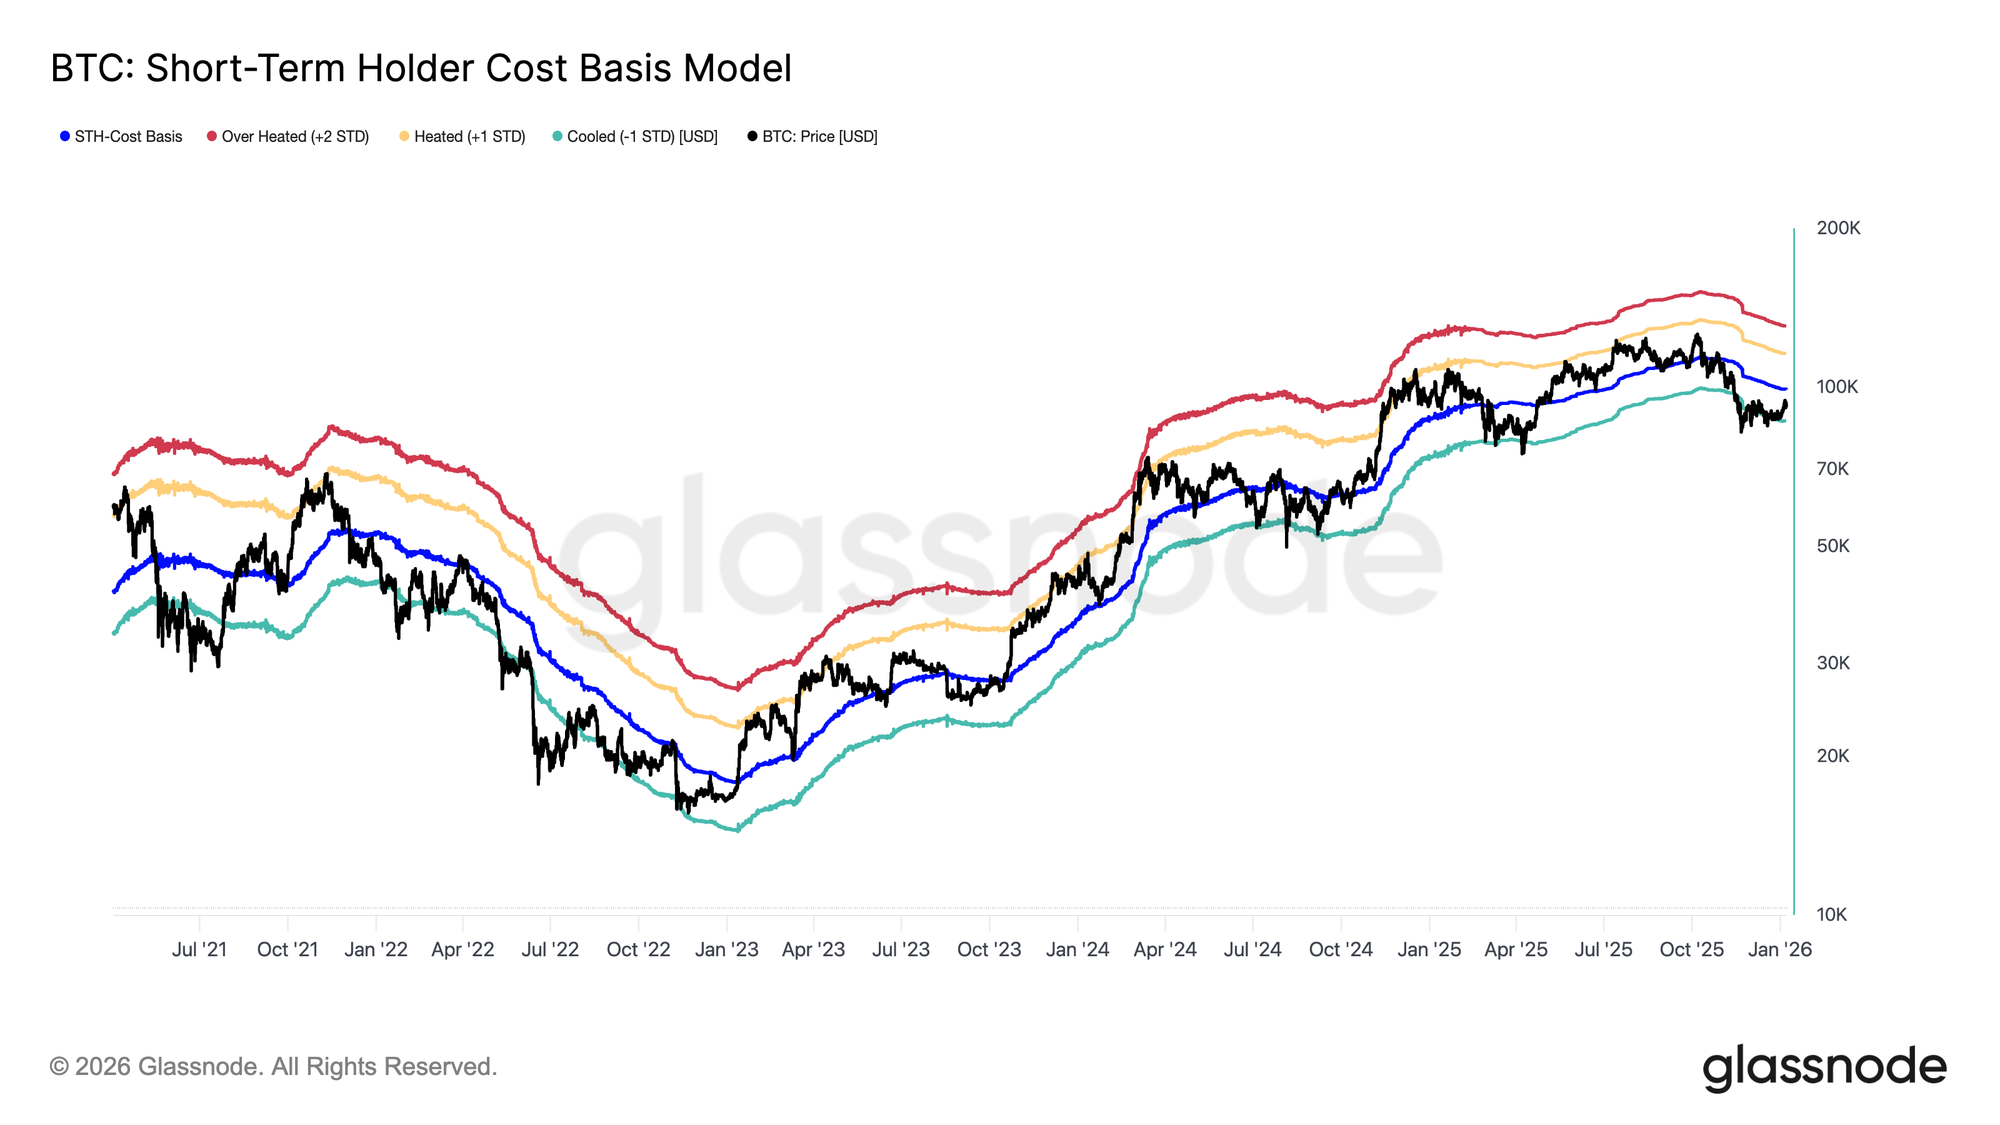
As the market contends with rising overhead supply, a robust price framework is needed to assess whether the recent rebound represents a full transition out of the prior bearish phase and into a regime of durable demand. In this context, the Short-Term Holder Cost Basis model remains a critical navigational tool during transitional periods.
Interestingly, December’s fragile equilibrium was formed around the lower bound of this model, near the −1 standard deviation band, reflecting heightened downside sensitivity and weak conviction among recent buyers. The subsequent rebound has carried price back toward the model’s mean, corresponding to the Short-Term Holder Cost Basis at $99.1k.
Accordingly, the first meaningful confirmation of recovery would be a sustained reclaim of Short-Term Holder Cost Basis, signalling renewed confidence among newer market participants and a shift toward more constructive trend dynamics.
Profitability or Prolonged Pain
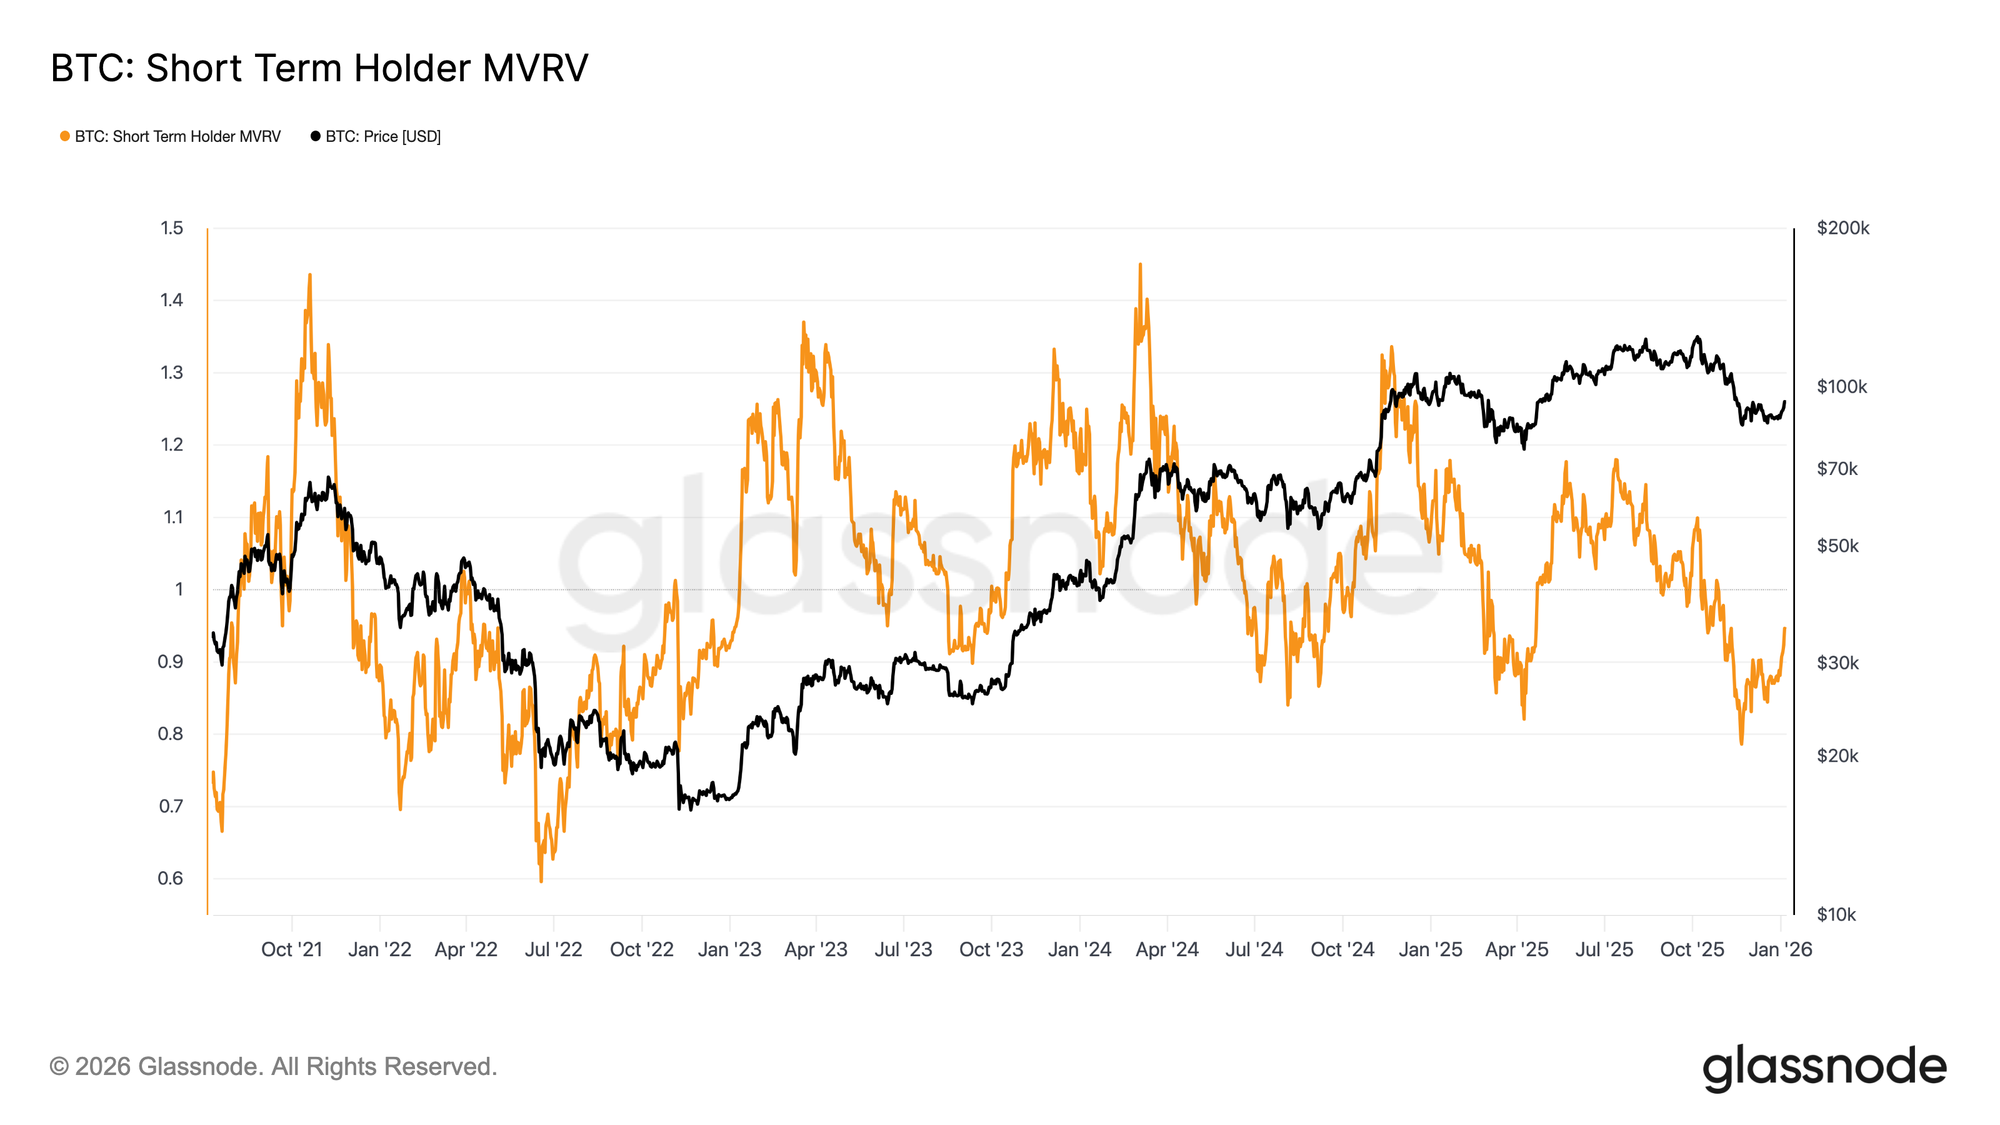
As attention turns to whether bulls can reclaim the Short-Term Holder Cost Basis, the broader structure begins to resemble earlier transitional failures. Similar to the Q1 2022 period, prolonged inability to recover above this level would materially increase the risk of a deeper bearish extension. If price remains capped below this threshold, confidence-driven demand may continue to erode.
This dynamic is clearly reflected in the Short-Term Holder MVRV metric, which compares spot price to the cost basis of recent buyers. Historically, sustained trading below the cost basis keeps STH-MVRV under 1, a regime where bears retain control. Currently, STH-MVRV has rebounded from a low of 0.79 to 0.95, indicating that recent investors remain at an average unrealized loss of approximately 5%. Without a decisive and sustained return to profitability, STH-MVRV > 1, the probability of further bear market continuation increases, making this a critical metric to monitor in the weeks ahead.
Off-Chain Insights
Treasury Demand Backs Off
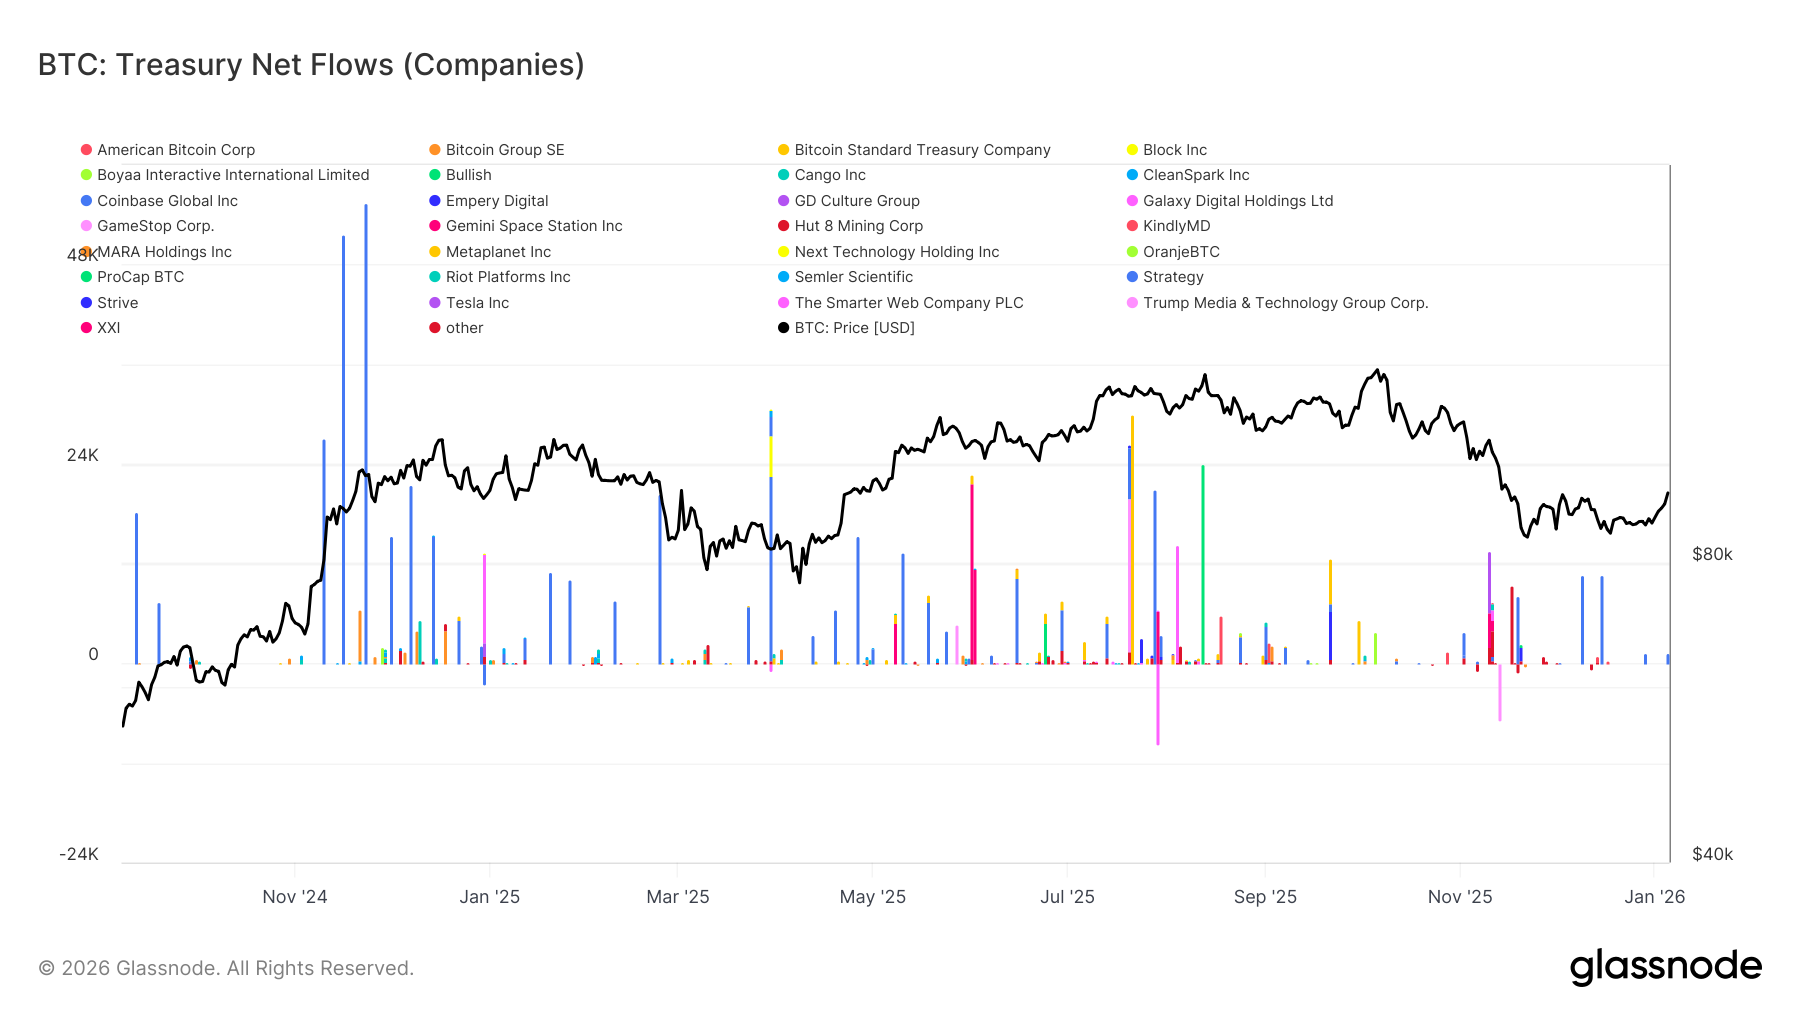
Corporate treasury flows continue to provide an important source of marginal demand; however, accumulation remains irregular and highly event-driven. Treasury entities have recorded repeated bursts of large net inflows, frequently exceeding multi-thousand BTC in a single week, but these episodes have failed to evolve into sustained, continuous accumulation.
Flow surges tend to cluster around local pullbacks and consolidation phases, indicating that treasury participation remains price-sensitive and opportunistic rather than structurally persistent. While the breadth of corporate participants has expanded beyond a single dominant buyer, net flows remain lumpy and separated by prolonged periods of inactivity.
In the absence of persistent treasury accumulation, corporate balance-sheet demand continues to act as a stabilizing buffer beneath price rather than a durable driver of trend expansion, leaving broader market direction increasingly dependent on derivatives positioning and short-term liquidity conditions.
ETF Demand Is Re-Emerging
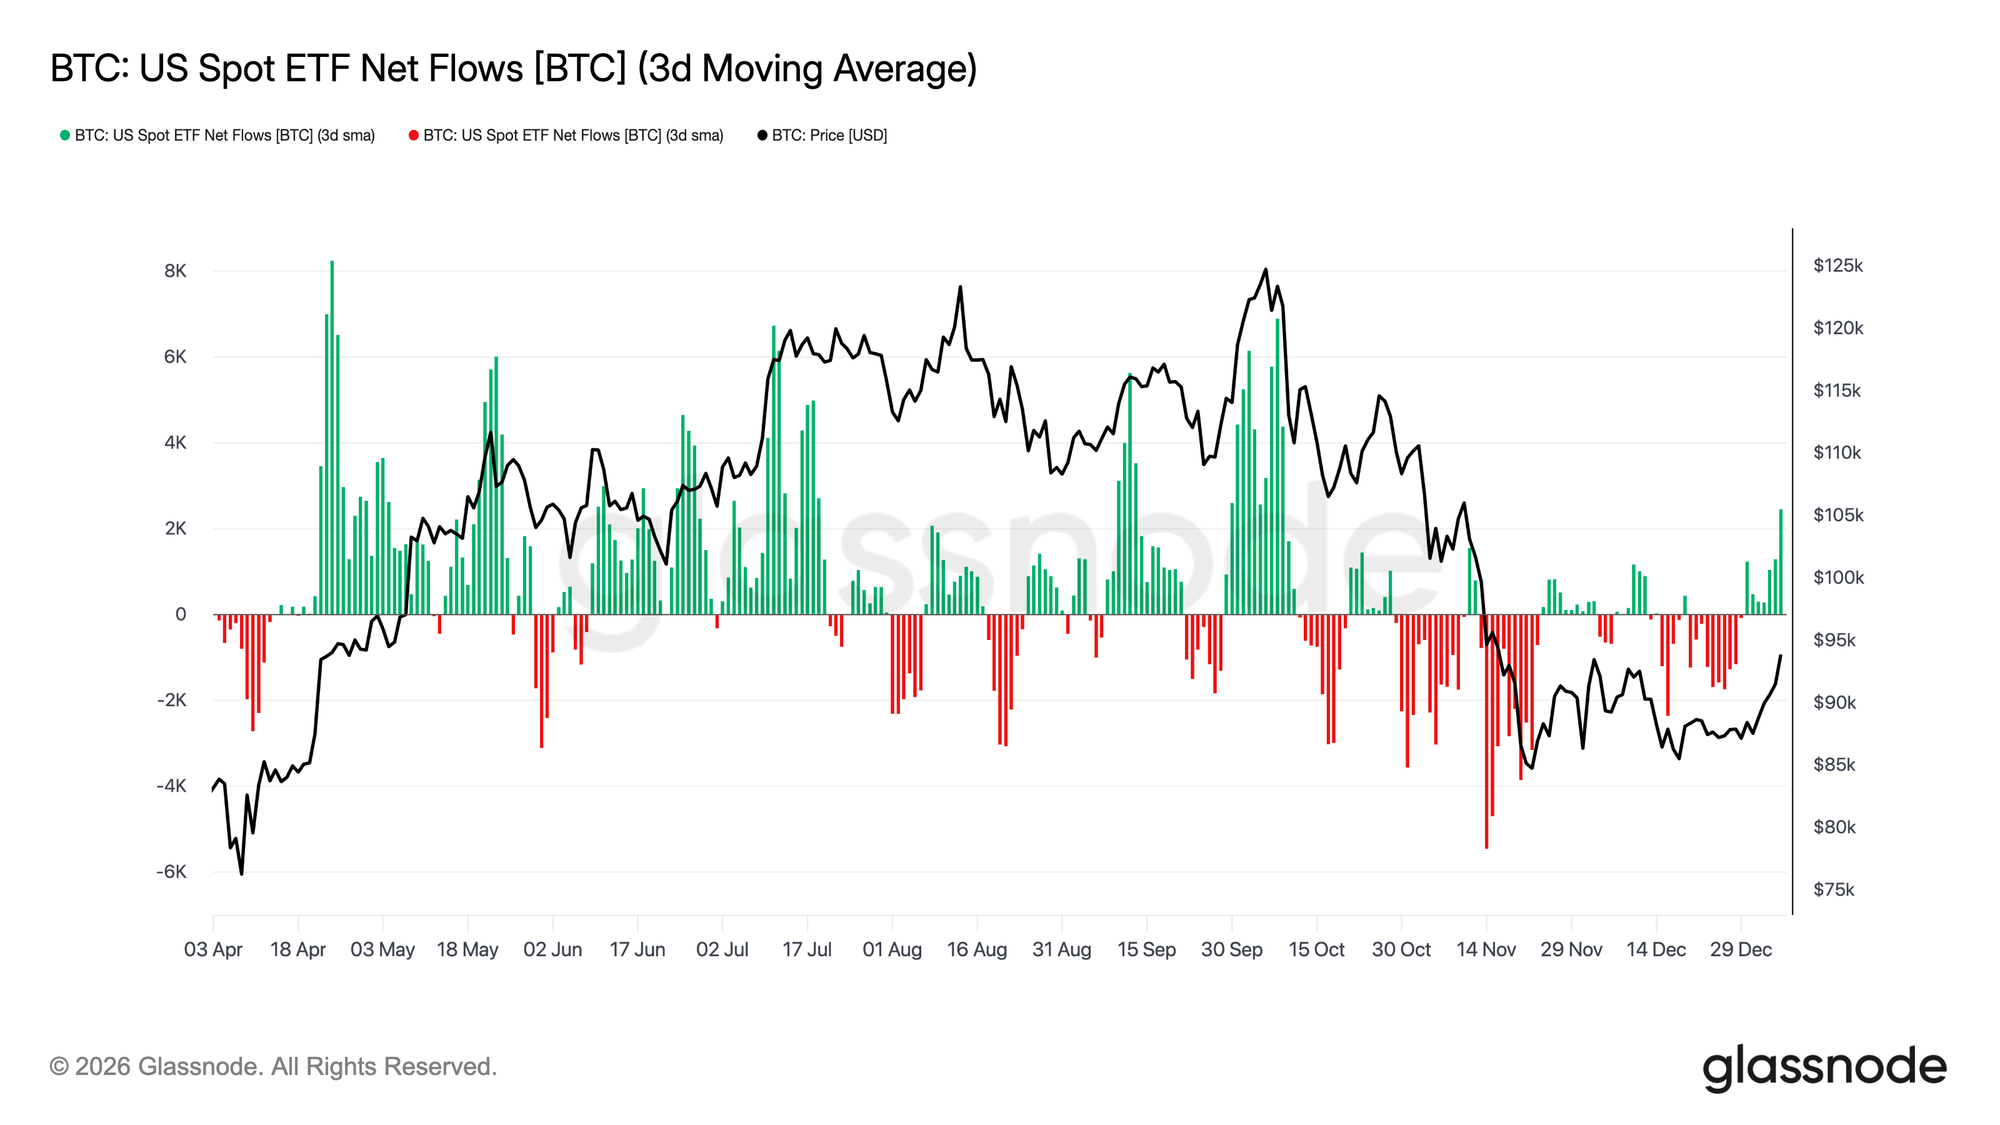
US spot ETF flows are beginning to show early signs of renewed institutional participation. Following a prolonged period of net outflows and subdued engagement through late-2025, recent weeks have marked a clear inflection back into positive net inflows, coinciding with price stabilization and recovery off the low-$80k range.
While the magnitude of inflows remains below the peak accumulation phases observed mid-cycle, the direction of flows has decisively turned higher. Positive impulses are becoming more frequent, indicating that ETF participants are once again transitioning from net distributors into marginal accumulators.
This shift suggests institutional spot demand is re-establishing itself as a constructive tailwind, rather than a source of sell-side liquidity, providing early structural support beneath price as market conditions stabilize into the new year.
Futures Participation Is Rebuilding
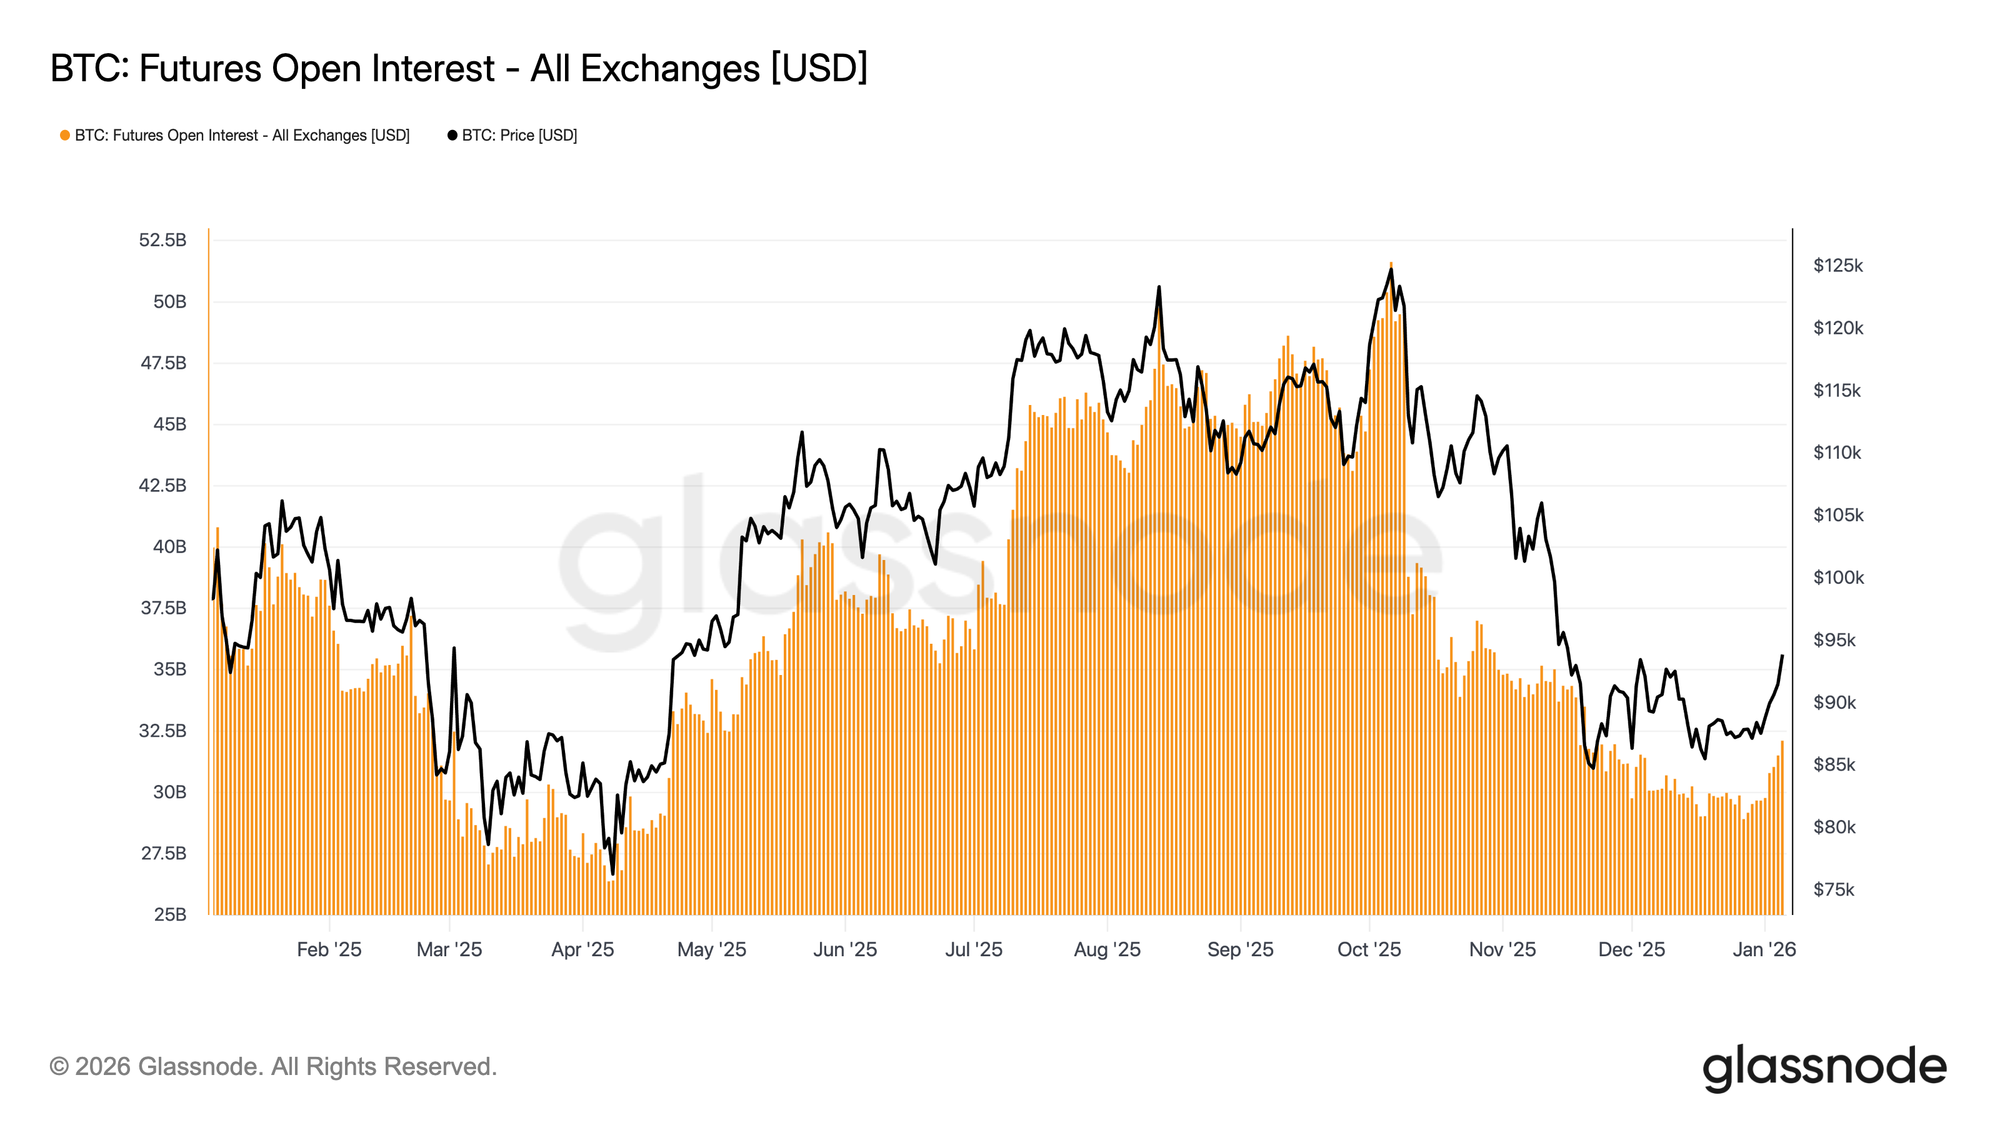
Aggregate futures open interest has begun to recover following the sharp deleveraging phase that accompanied the late-2025 drawdown. After contracting from cycle highs above $50B, open interest has recently stabilized and is now turning higher, indicating a renewed willingness among derivatives participants to redeploy risk.
This recovery in positioning has coincided with price stabilization in the high-$80k to low-$90k range, suggesting that traders are gradually rebuilding exposure rather than aggressively chasing upside. The pace of re-engagement remains measured, and current positioning sits well below prior cycle extremes, reducing immediate liquidation risk.
The minor re-expansion of open interest signals local improvement in risk appetite and a rebuilding derivatives bid, supporting near-term price discovery as liquidity conditions begin to normalize into the new year.
A Clean Slate for Positioning
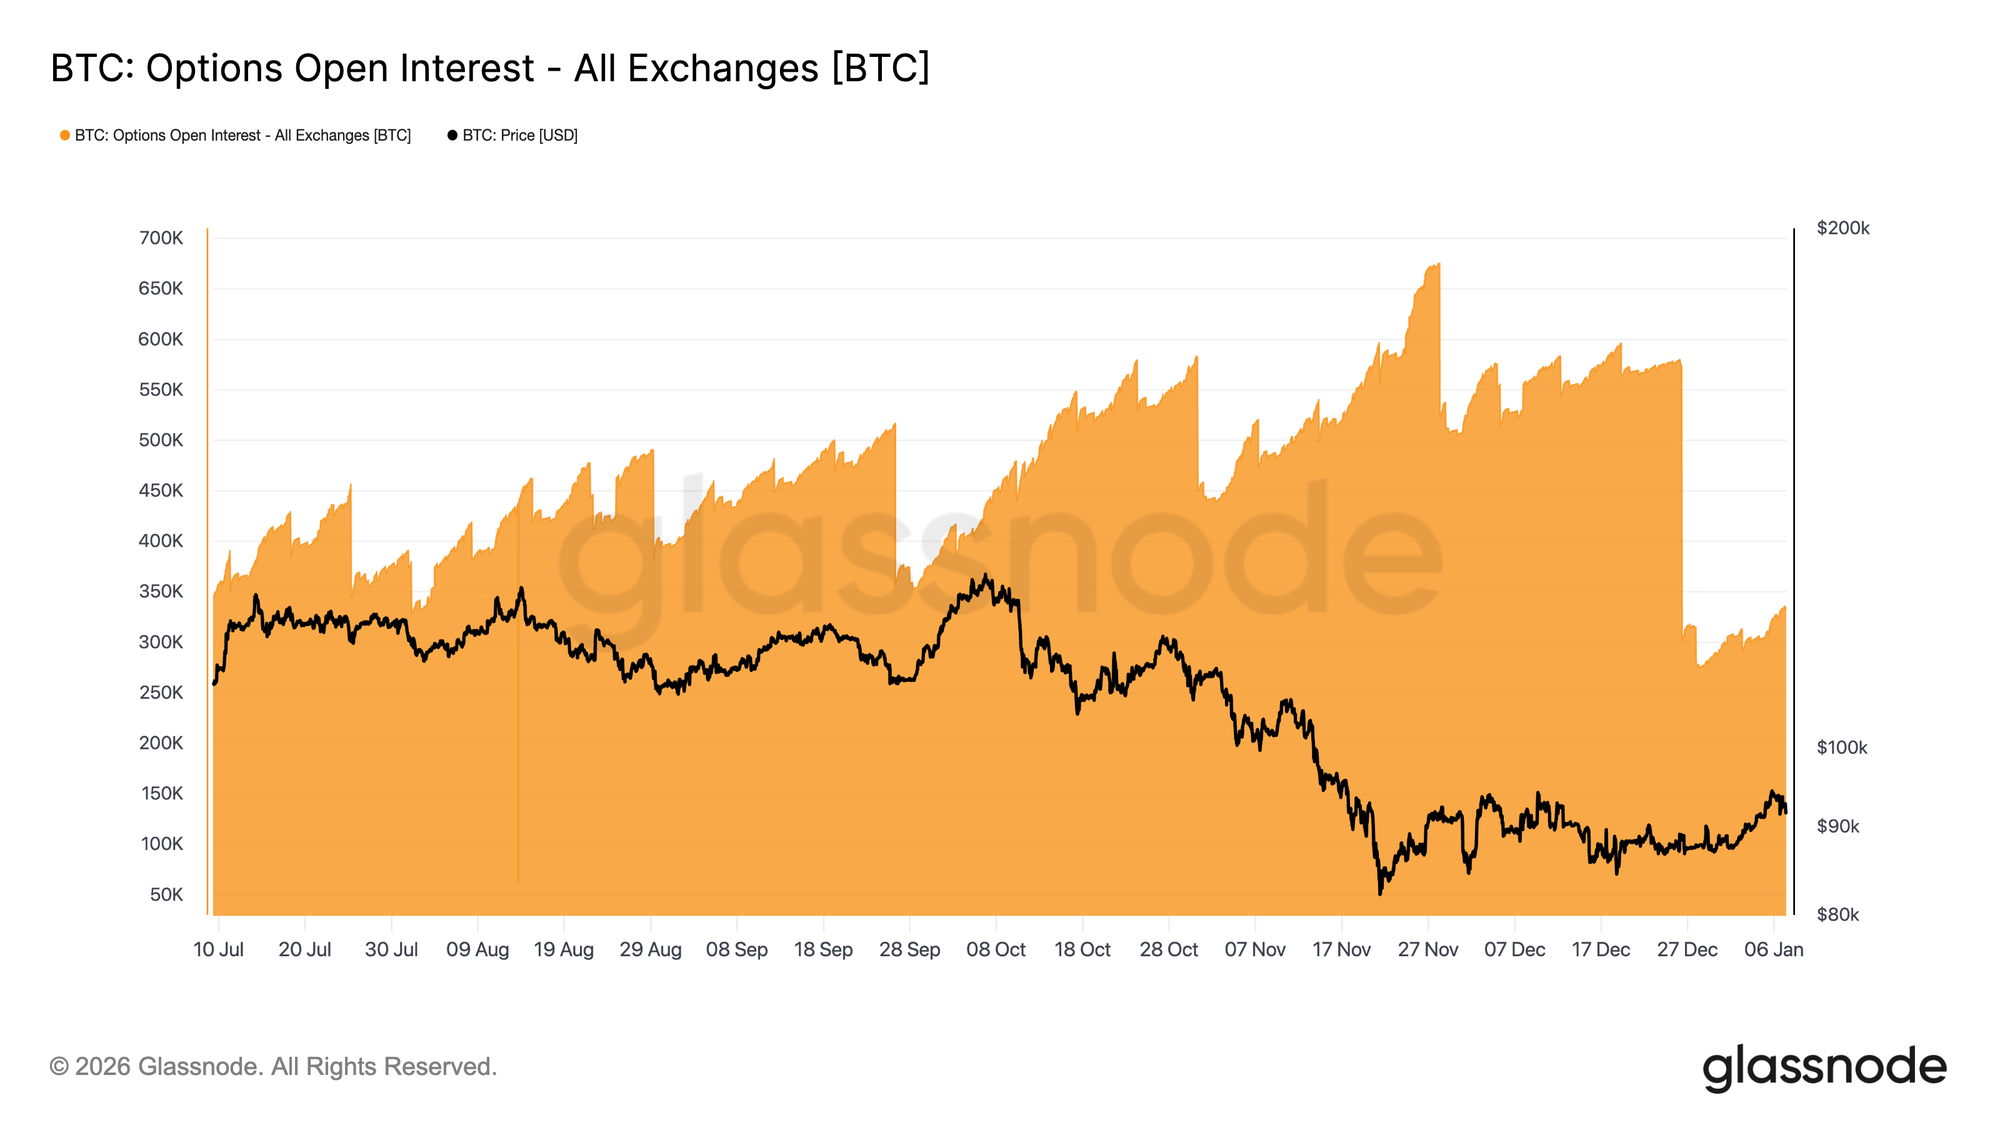
The end of 2025 marked the largest reset in Bitcoin options open interest on record. Open interest fell from 579,258 BTC on December 25 to 316,472 BTC following the December 26 expiry, erasing more than 45% of outstanding positioning.
Large open interest concentrations shape short-term price behaviour by embedding dealer hedging flows into the market. Into year-end, this positioning became increasingly concentrated, creating periods of structural price pinning as dealers carried long gamma exposure around key strikes.
That regime has now cleared. With late-year positioning rolled off, the market is no longer constrained by those hedging mechanics.
The post-expiry environment offers a cleaner read on sentiment, as new positions now reflect fresh premium being bought or sold rather than inherited exposure, leaving the early weeks of the year to provide a more direct signal of how traders are choosing to express risk going forward.
Implied Volatility Has Bottomed
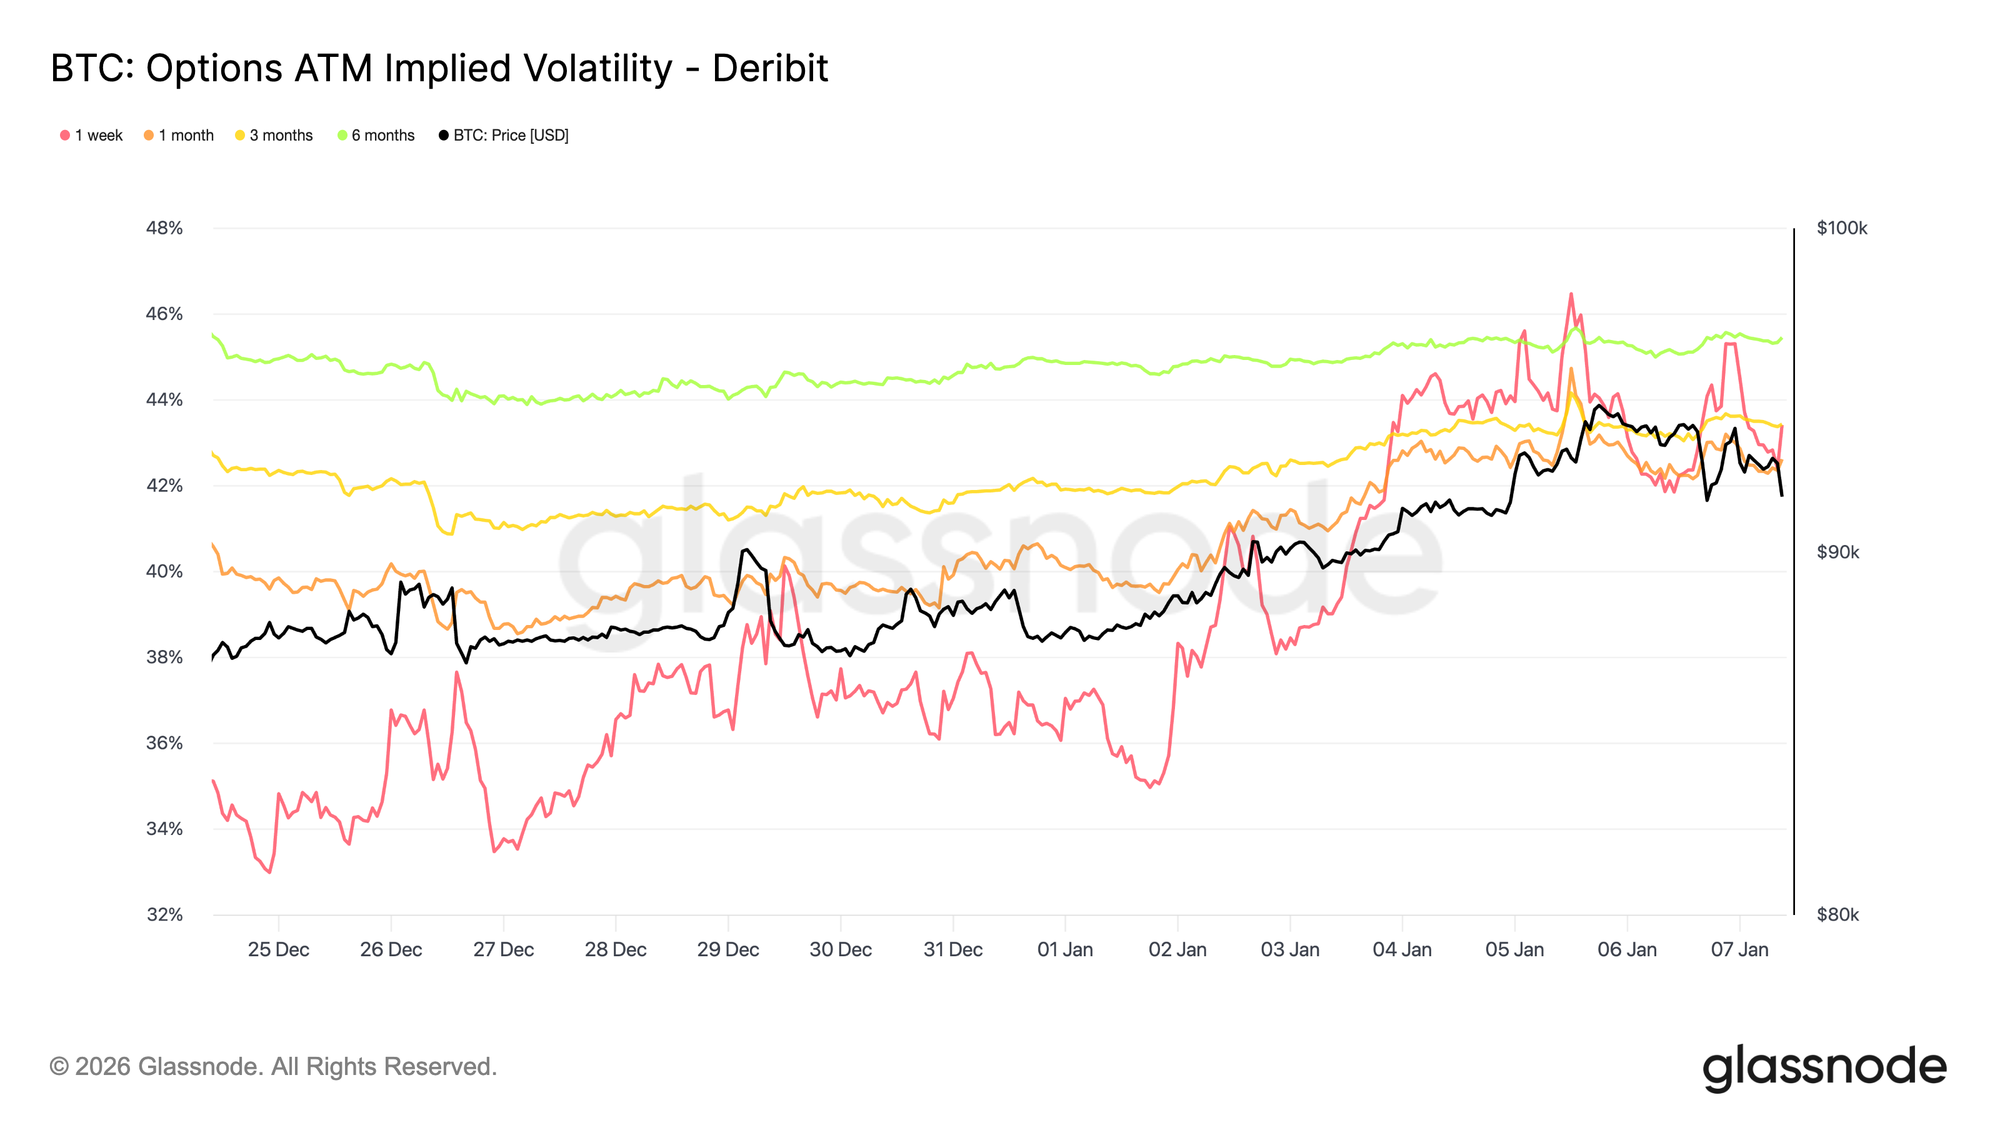
Following the open interest reset, implied volatility reached a short-term low during the Christmas period. Thin activity around the holidays coincided with one-week implied volatility printing its lowest level since late September.
Since then, taker interest has started to return, with early accumulation of long volatility positions, particularly on the upside, as traders position into the new year. This demand has gently lifted the volatility curve across maturities.
Despite the rebound, implied volatility remains compressed. The 1-week through 6-month expiries are clustered between 42.6% and 45.4%, indicating a relatively flat curve.
Volatility continues to trade near the lower end of its three-month range, with the recent pickup reflecting renewed engagement rather than a decisive repricing of risk.
Skew Continues to Normalize
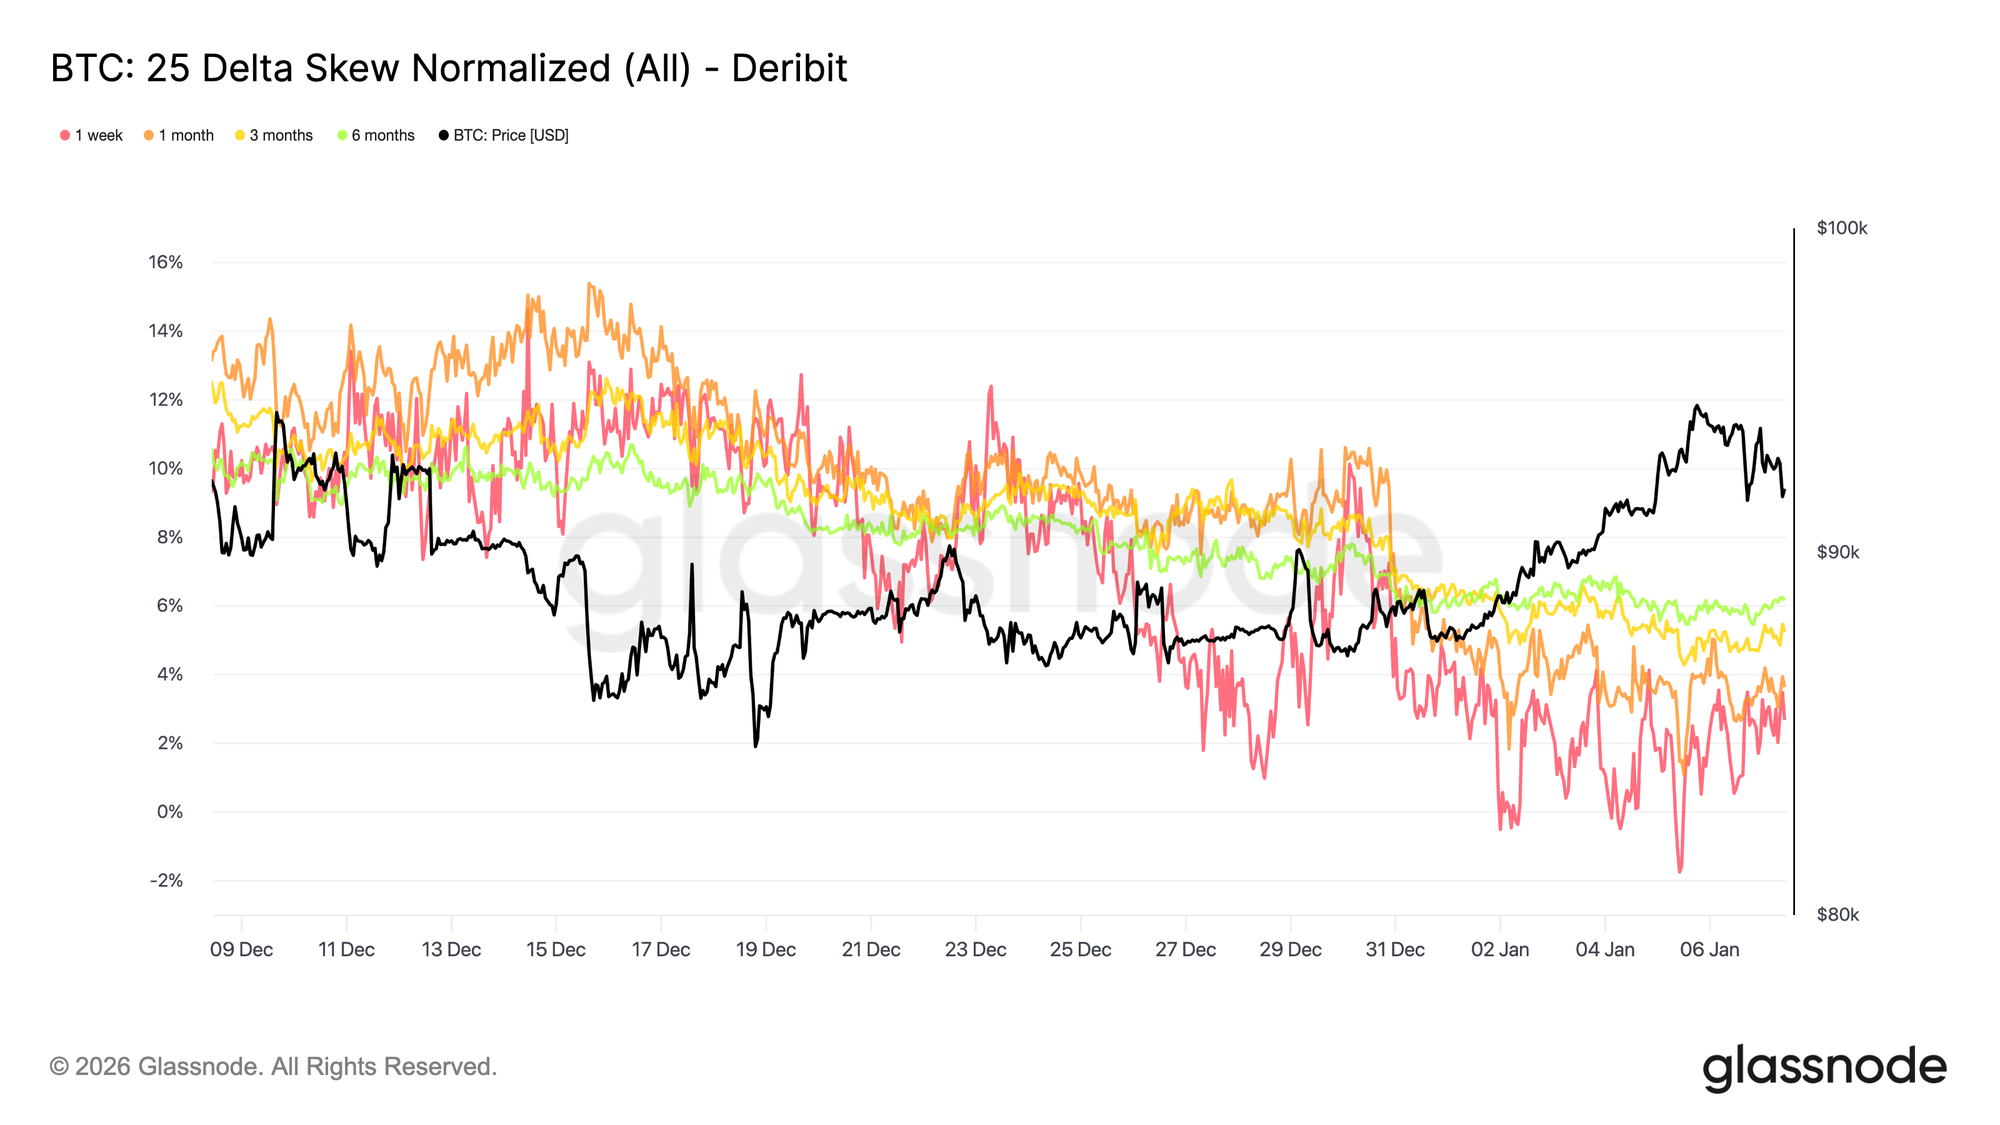
As implied volatility stabilizes, skew provides a clearer view of how traders are expressing directional risk. Over the past month, the relative richness of puts versus calls has declined across maturities, with 25-delta skew becoming progressively less negative along the curve.
This reflects a gradual rotation toward calls. Demand is shifting away from pure downside protection and toward upside participation, consistent with traders rebuilding exposure following the year-end reset.
At the same time, defensive positioning has eased. Some downside hedges have been unwound, reducing the premium paid for crash protection.
Overall, skew is signalling a market that is becoming more balanced in its risk expression, increasingly reflecting openness to upside price action or volatility expansion rather than tail-risk pricing.
New Year Flows Tilt Toward Calls
Flow data confirms the shift suggested by skew. Since the start of the year, activity has moved away from systematically selling upside volatility toward actively accumulating it.
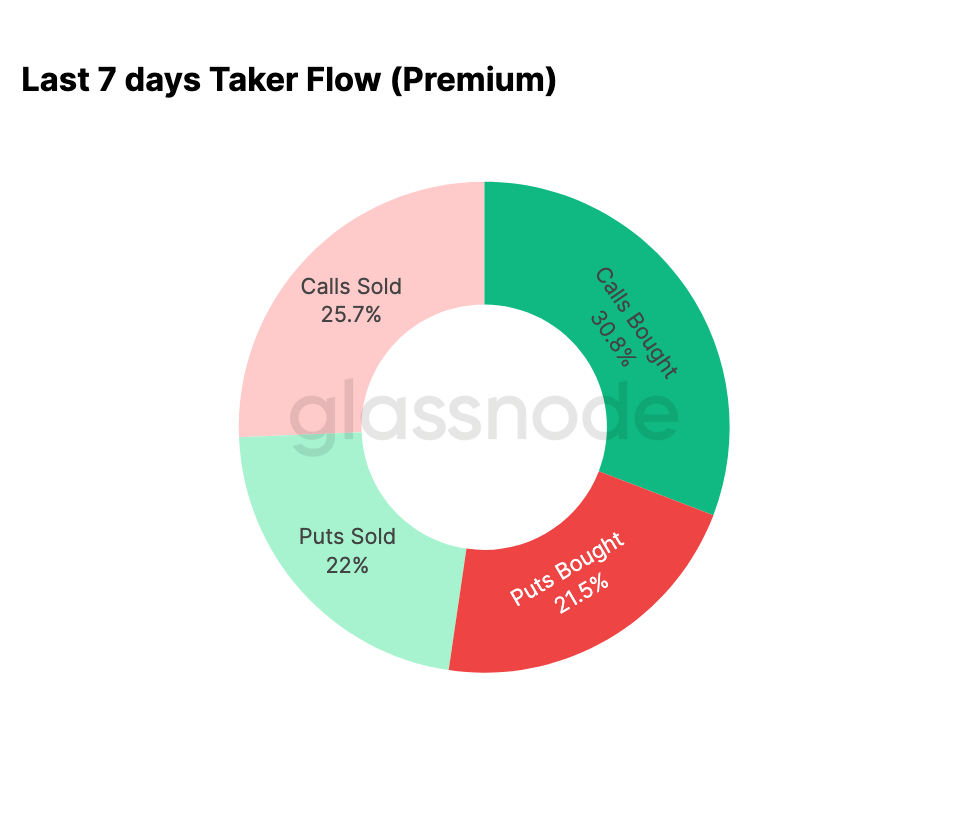
Over the past seven days, call buying has accounted for 30.8% of total options activity. This increase in call demand has been met by volatility sellers, who have taken advantage of higher implied volatility to sell calls, representing 25.7% of total activity.
Downside activity has accounted for 43.5% of total volume, a relatively modest share given recent price appreciation. This aligns with skew becoming more balanced and reflects reduced demand for immediate downside protection.
Dealer Gamma Flips Short in the Upper Range
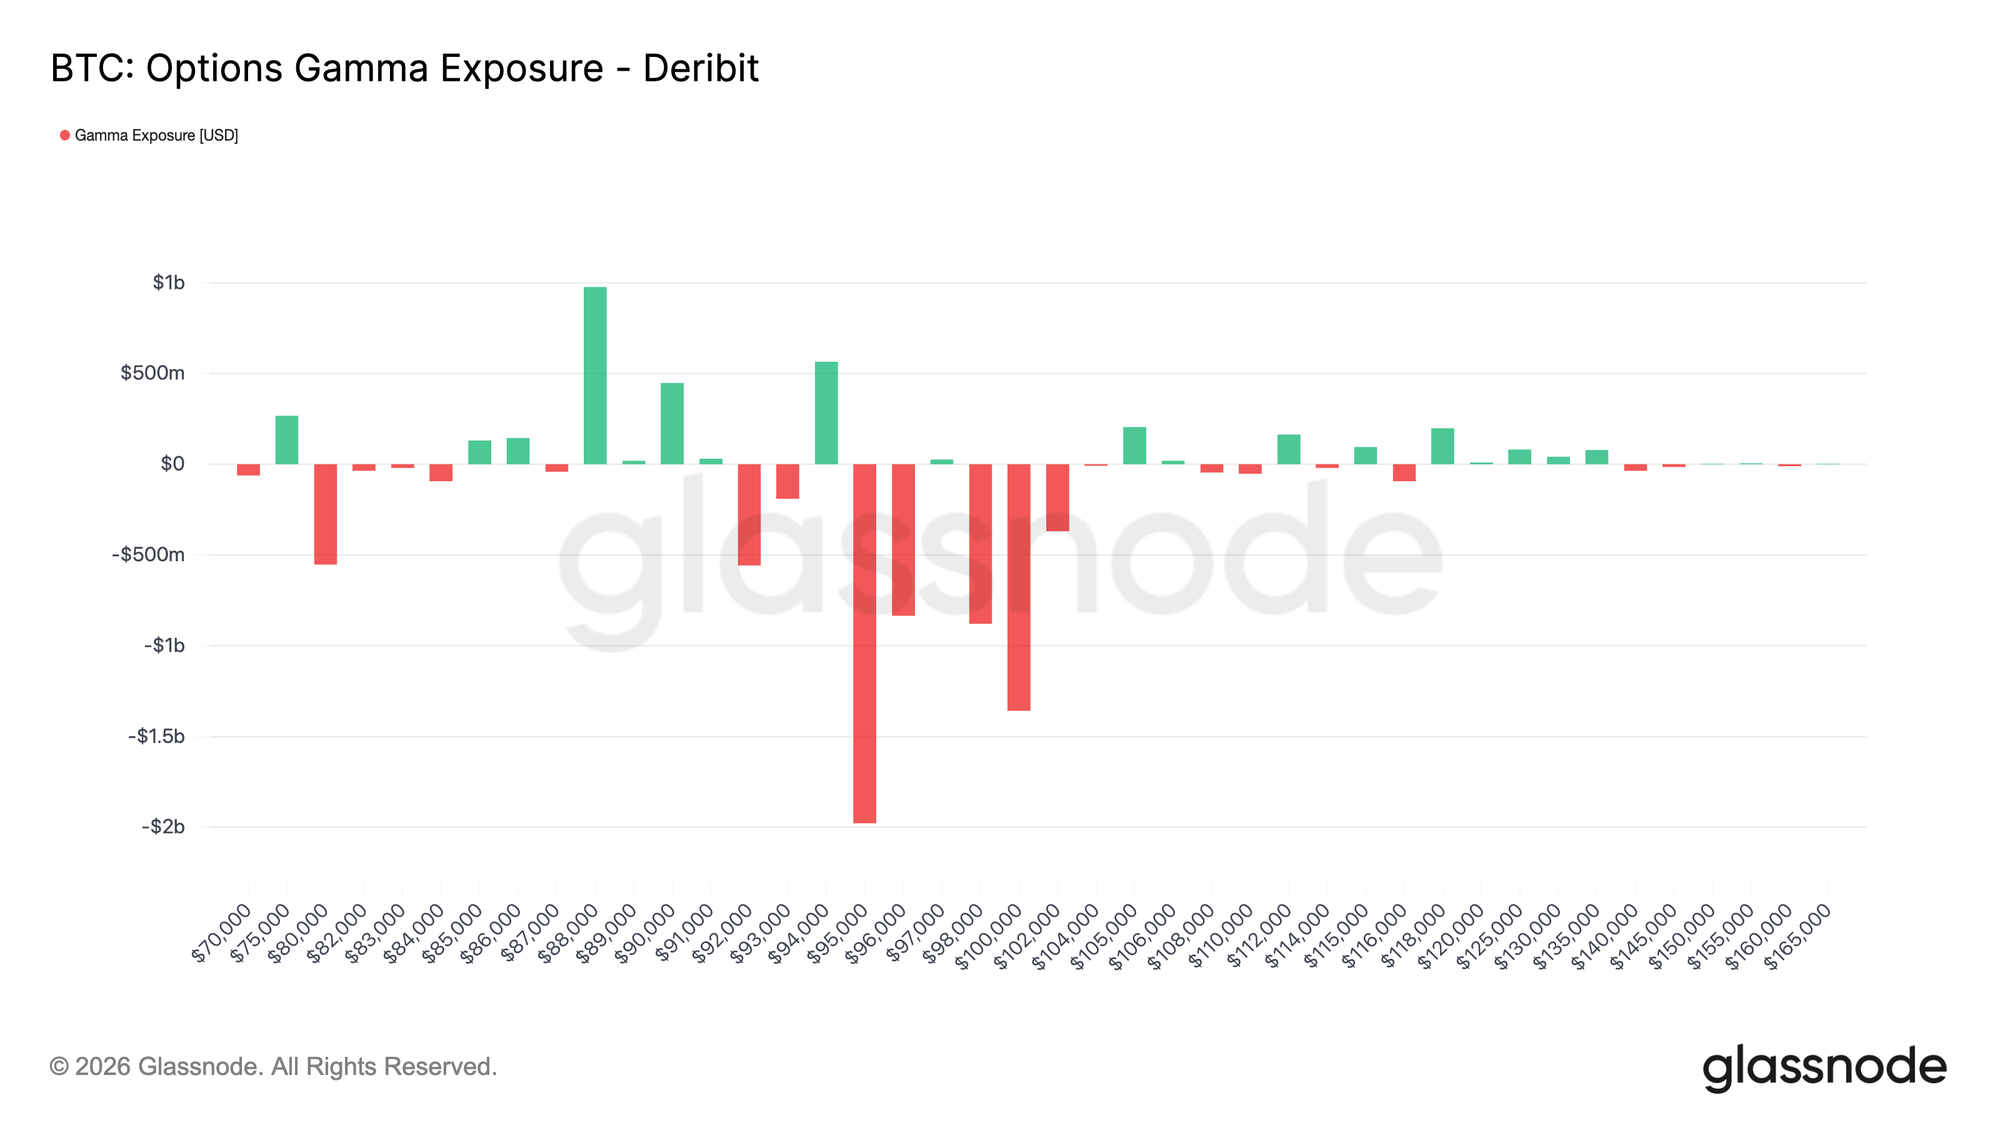
Following the call-heavy flow into the new year, dealer positioning has shifted accordingly. Dealers are now predominantly short gamma between $95K and $104K.
In this range, rising prices require dealers to buy spot or perpetuals to hedge, which can mechanically reinforce upside moves during periods of strength. This stands in contrast to the long-gamma conditions that prevailed into year-end.
The concentration of taker call buying between $95K and $100K across first-quarter expiries highlights a clear change in how risk is being expressed. Rather than suppressing price movement, current dealer positioning implies that hedging flows are no longer acting as a dampener in this zone.
Overall, the gamma profile reflects a pivot in market structure at the start of the year, shaped by renewed upside demand.
95K Call Premium Reflects Conviction
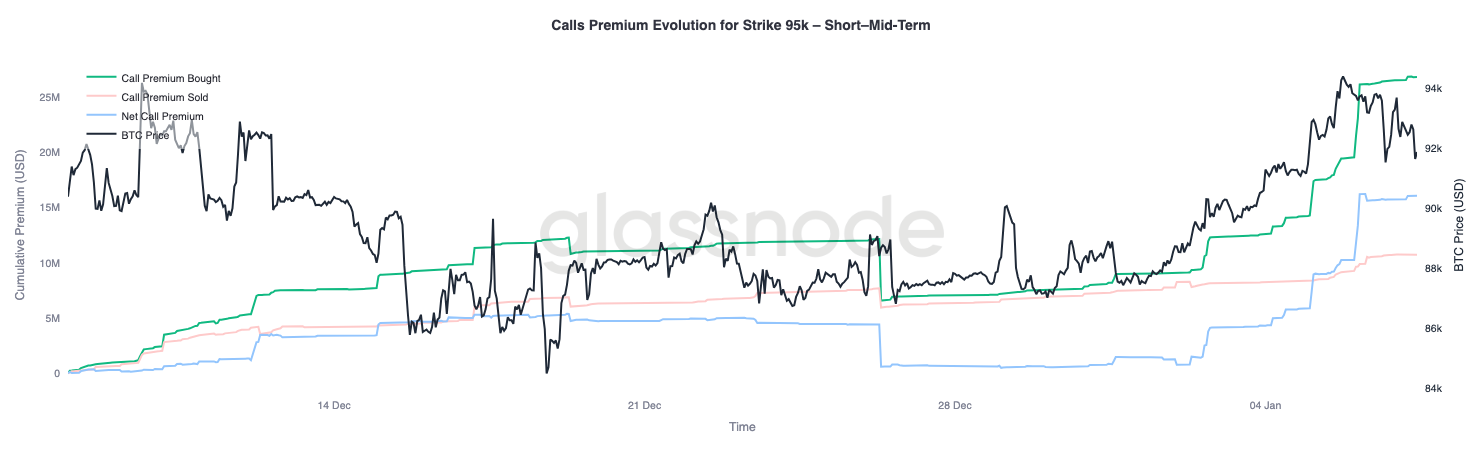
The 95K call strike provides a useful proxy for assessing market conviction as price action evolves. Call premium buying began to accelerate on January 1, when spot was near $87K, and increased steadily as price moved toward the recent local high around $94.4K.
Since then, call premium buying has flattened, indicating a pause rather than a reversal in interest. Importantly, this plateau has not been accompanied by a meaningful rise in call premium selling.
Profit-taking has therefore remained limited. Call premium sold has only increased modestly since the local top, suggesting that upside exposure is being maintained rather than actively unwound.
Overall, premium behaviour around $95K points to patience among upside participants, with traders appearing comfortable holding exposure instead of quickly monetising it.
Conclusion
Bitcoin enters the new year having cleared a significant portion of legacy positioning across spot, futures, and options markets. The late-2025 deleveraging event and year-end expiry cycle have effectively reset the market’s structural constraints, leaving behind a cleaner and more transparent signal environment.
Early signs of renewed engagement are now emerging. ETF flows have begun to stabilize, futures participation is rebuilding, and options markets show a clear shift toward upside participation, with skew normalizing, volatility bottoming, and dealer gamma flipping short across key upper-range strikes.
Together, these dynamics suggest the market is transitioning away from defensive, distribution-driven behaviour toward selective re-risking and rebuilding participation. While structural accumulation remains measured, the clearing of positioning overhangs and the re-emergence of upside expression indicate that Bitcoin begins 2026 on a cleaner footing, with improving internal market structure and renewed optionality for expansion.
Disclaimer: This report does not provide any investment advice. All data is provided for informational and educational purposes only. No investment decision shall be based on the information provided here, and you are solely responsible for your own investment decisions.
Exchange balances presented are derived from Glassnode’s comprehensive database of address labels, which are amassed through both officially published exchange information and proprietary clustering algorithms. While we strive to ensure the utmost accuracy in representing exchange balances, it is important to note that these figures might not always encapsulate the entirety of an exchange’s reserves, particularly when exchanges refrain from disclosing their official addresses. We urge users to exercise caution and discretion when utilizing these metrics. Glassnode shall not be held responsible for any discrepancies or potential inaccuracies.
Please read our Transparency Notice when using exchange data.