Chainlink – Why LINK must reclaim THIS level to breach $14 next

ambcryptoPublicado a 2025-12-19Actualizado a 2025-12-19

Resumen

Chainlink (LINK) is showing signs of stabilization despite recent price weakness, trading near a key demand zone around $12.22. Significant reserve growth, with over 92k LINK added to reach 1.23 million total, indicates long-term accumulation during the drawdown rather than reactive selling. Spot market data reveals consistent buy-side dominance, with buyers absorbing sell pressure even as the price declined from the $16-17 range. Leverage resets, dominated by long liquidations, suggest forced selling is exhausting rather than indicating a fresh bearish trend. The critical demand zone between $11.8 and $12.2 has been defended multiple times, capping downside risk. The RSI reading of 40.81 signals weakening bearish momentum. For a recovery, LINK must reclaim $13.02 to confirm short-term strength, which could then propel the price toward the next key liquidity cluster at $14.65. A break above that level would invalidate the current lower-high structure and open a path toward the primary resistance target of $16.66. Overall, the structure points to accumulation and a potential upward trajectory if key levels are reclaimed.

Chainlink’s [LINK] reserve activity continues to build quietly beneath ongoing market weakness. The latest update shows 92,946.23 LINK added, pushing total reserves to 1,232,139.92 LINK.

This accumulation occurred while LINK was trading near $12.22, at press time, close to a multi-week demand zone.

That timing carries weight. Reserves expanded during drawdown, not during upside momentum. This behavior reflects long-term conviction rather than reactive positioning.

Over time, reserve growth reduces circulating liquidity stress and strengthens the network’s defensive layer. Reserves rarely ignite instant rallies. Instead, they influence how the price reacts once demand returns.

As a result, while price action remains pressured, the underlying network structure continues to improve, a divergence often seen near late-stage corrective phases.

Spot buyers continue absorbing sell pressure

Spot market behavior reinforces the idea that selling pressure lacks strong organic conviction.

The 90-day Spot Taker CVD remains clearly buy-dominant, confirming that market buys continue to outweigh market sells, even as LINK slid from the $16–$17 range toward $12.

Buyers actively lift offers rather than waiting for deeper pullbacks. At the same time, derivatives activity distorts price signals, masking this underlying strength.

Forced selling from leveraged positions suppresses price despite consistent spot absorption. Still, persistent buy-side dominance points toward accumulation rather than distribution.

Under these conditions, downside moves typically lose momentum as price approaches demand zones.

Leverage resets as long liquidations dominate

Liquidation data confirms that forced positioning drove much of LINK’s recent downside. At the time of press, total liquidations reached roughly $213K, with short liquidations near $167.24K and long liquidations around $46.03K.

Binance alone recorded over $17K in short liquidations, while Bybit accounted for approximately $124K. These figures highlight aggressive leverage resets rather than renewed bearish conviction.

Repeated long flushes steadily reduce downside fuel. As longs exit, cascading sell-offs become harder to sustain. Meanwhile, expanding short exposure raises vulnerability to sharp counter-moves.

In this environment, liquidation behavior increasingly reflects exhaustion rather than fresh trend expansion.

Demand zone defense shapes the recovery setup

LINK continues to respect a clearly defined demand zone between $11.8 and $12.2, where buyers have now defended the price multiple times.

This area has repeatedly absorbed sell pressure, preventing any sustained breakdown below $11.8.

Importantly, at the time of writing, the RSI held at 40.81, with the signal line near 33.16, signaling bearish momentum is weakening rather than accelerating. This RSI behavior often appears during base-building phases.

As long as the price holds above demand, downside risk remains capped. However, LINK must reclaim $13.02 to confirm short-term strength.

A decisive push above $14.65 would invalidate the lower-high structure and expose $16.66 as the next major resistance. Therefore, sustained demand defense sets a clear recovery trajectory toward the $16 region.

Chainlink liquidity clusters point price toward higher levels

The Binance 24-hour liquidation heatmap highlights dense liquidity clusters between $12.6 and $13.2, with another notable concentration near $14.65.

These areas frequently act as short-term price magnets as forced liquidations trigger. Downside liquidity near $11.7 has already cleared, reducing immediate breakdown risk.

With leverage thinning and spot demand active, upside sensitivity increases. If LINK reclaims $13.02, price could accelerate toward $14.65 as short positions unwind.

Beyond that level, $16.66 stands as the next major resistance. Liquidity placement, therefore, aligns with a recovery trajectory rather than prolonged compression.

To sum up, Chainlink’s structure now reflects stabilization rather than continued deterioration. Reserve growth above 1.23 million LINK, steady spot-side buying, and easing liquidation pressure point to downside exhaustion.

As long as price holds the $11.8–$12.2 demand zone, risk tilts upward. A decisive reclaim of $13.02 would likely unlock a move toward $14.65, placing $16 firmly in focus as the primary recovery target.


Final Thoughts

  • Reserve accumulation and spot buying suggest downside exhaustion near the $12 demand zone.
  • Clearing $13.02 could shift momentum toward $14.65 and reopen the $16 target.

Criptos en tendencia

Preguntas relacionadas

QWhat is the significance of Chainlink's reserve activity according to the article?

AChainlink's reserve activity, with 92,946.23 LINK added to reach 1,232,139.92 LINK, is significant because it occurred during a price drawdown, reflecting long-term conviction rather than reactive positioning. This growth reduces circulating liquidity stress and strengthens the network's defensive layer, often indicating a late-stage corrective phase.

QWhat does the 90-day Spot Taker CVD data show about the market for LINK?

AThe 90-day Spot Taker CVD remains buy-dominant, confirming that market buys continue to outweigh market sells even as the price declined from the $16–$17 range to $12. This suggests buyers are actively absorbing sell pressure, pointing toward accumulation rather than distribution.

QHow did liquidation data contribute to the recent downside price movement of LINK?

ALiquidation data shows that forced selling from leveraged positions, not renewed bearish conviction, drove much of the recent downside. Total liquidations were $213K, with long liquidations ($46.03K) being a key factor. This represents a leverage reset, steadily reducing downside fuel and making cascading sell-offs harder to sustain.

QWhat is the key demand zone for LINK's price, and why is it important?

AThe key demand zone is between $11.8 and $12.2. It is important because buyers have defended this price level multiple times, absorbing sell pressure and preventing a sustained breakdown. Holding above this zone caps downside risk and is crucial for the recovery setup.

QWhat price levels must LINK reclaim to confirm a recovery toward $16, according to the liquidity clusters?

ALINK must first reclaim $13.02 to confirm short-term strength. A decisive push above $14.65 would then invalidate the lower-high structure and expose the next major resistance at $16.66, aligning with dense liquidity clusters that act as price magnets.

Lecturas Relacionadas

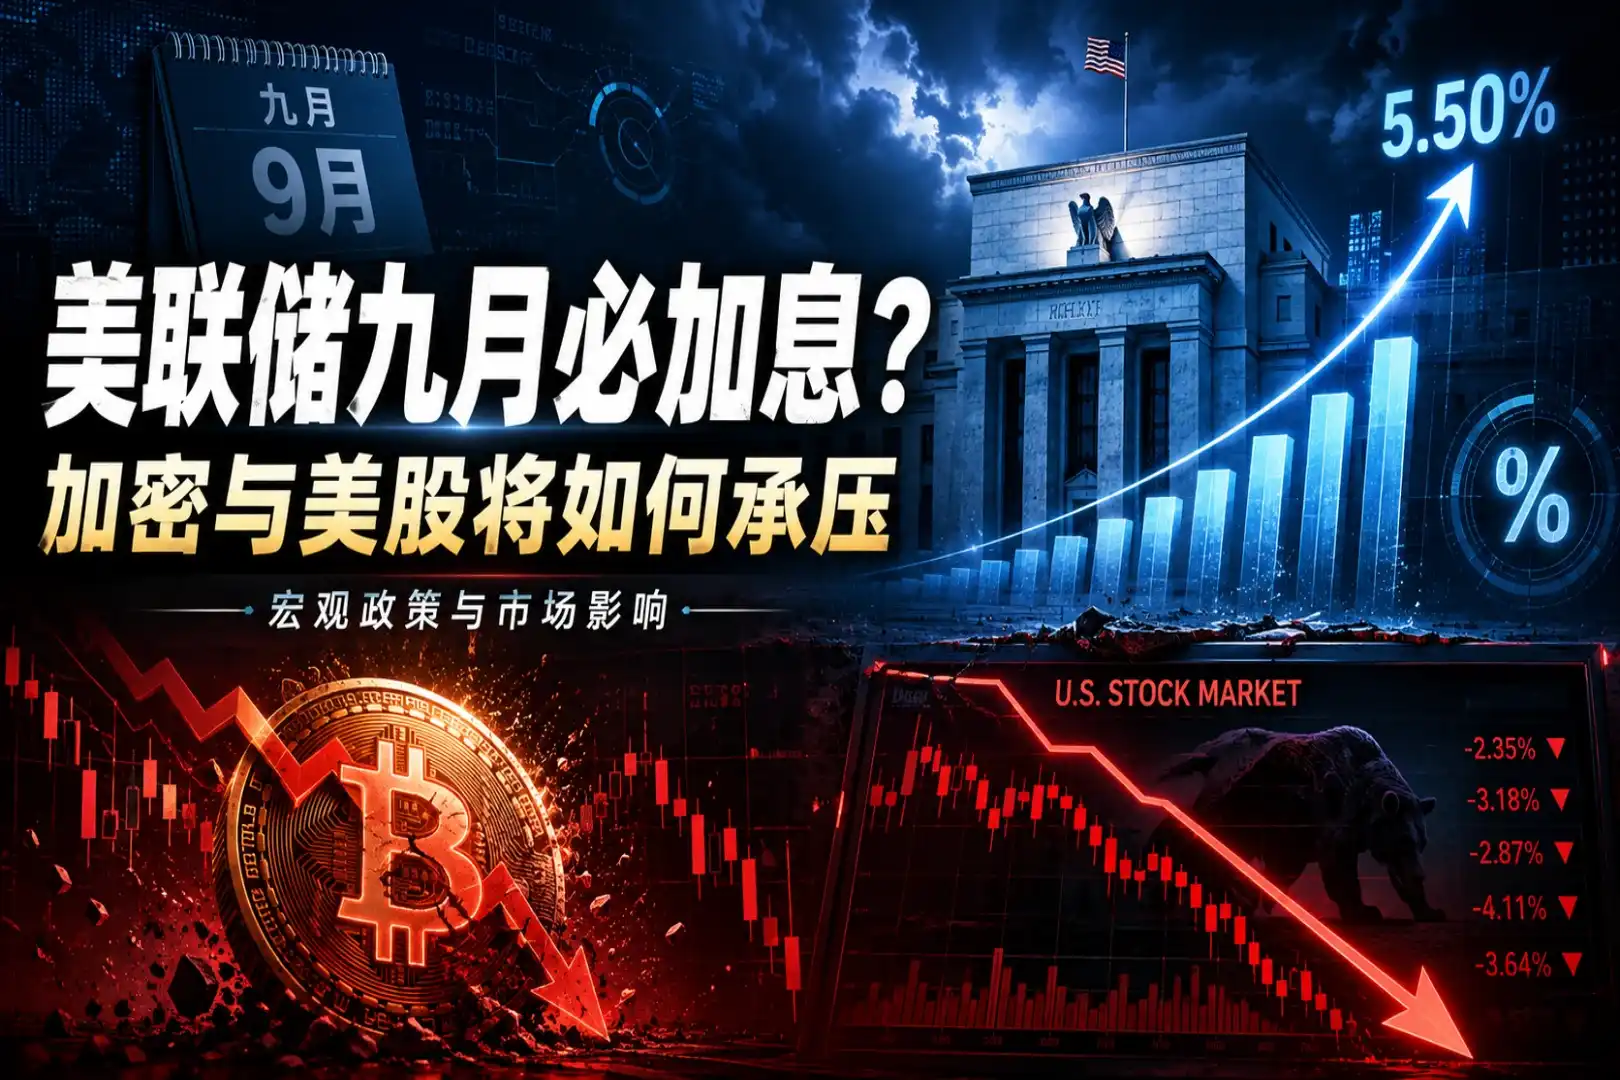
Will the Fed Definitely Raise Interest Rates in September? How Will Crypto and U.S. Stocks Withstand the Pressure?

The market's expectation for a September Fed rate hike surged dramatically in early August, jumping from under 50% to over 80% within a week. This shift followed a contentious July FOMC meeting, where a 9-3 vote to hold rates revealed growing dissent from hawkish members advocating for an immediate hike to combat persistent inflation. The primary catalyst for this repricing is rising oil prices, driven by renewed geopolitical tensions around the Strait of Hormuz, which threaten global supply. Energy costs directly influence inflation metrics, making the upcoming July CPI report (due August 12th) a critical data point. If it shows inflation reaccelerating, the probability of a September hike will solidify. For Bitcoin and crypto assets, this is typically bearish news. Bitcoin continues to behave as a high-beta, liquidity-sensitive risk asset. A rate hike raises the opportunity cost of holding non-yielding assets and could drive capital toward money markets, pressuring crypto prices in the short term. However, historical patterns suggest that if a hike is perceived as the end of a tightening cycle rather than the start, any negative price impact may be brief. U.S. stocks, particularly crypto-linked equities like Coinbase and growth-oriented tech stocks, are also vulnerable. Higher rates increase discount rates in valuation models, putting pressure on high-multiple companies. This coincides with a pivotal tech earnings season where investor focus has shifted from massive AI capital expenditure to tangible revenue and cash flow generation. Companies with negative cash flow and weak growth narratives could face heightened volatility if borrowing costs rise in September. In summary, a September Fed hike has evolved into a mainstream market scenario. Key factors to watch are oil prices, the July CPI report, and Fed communications, which will determine the final decision and its impact on volatile crypto and equity markets.

marsbitHace 2 min(s)

Will the Fed Definitely Raise Interest Rates in September? How Will Crypto and U.S. Stocks Withstand the Pressure?

marsbitHace 2 min(s)

A 'Overlooked' Market Event: Joint US-Japan-South Korea Intervention, Rare US Treasury Involvement, and Bessent's Quiet 'Market Rescue'?

Summary: The United States, Japan, and South Korea executed their largest coordinated foreign exchange intervention in nearly 30 years. The action targeted depreciation pressure on the Japanese yen and South Korean won. This move is seen as a significant effort by the US to stabilize the financial markets of its key allies and prevent the spillover of risks. Key details: * Japan reportedly intervened on July 30 using approximately 8.45 trillion yen (about $52.8 billion). South Korean authorities also intervened that day, selling dollars to support the won. * Notably, the US Treasury Department intervened directly in yen markets for the first time in roughly 30 years. The New York Fed, reportedly acting on behalf of the Treasury, sold euros to buy yen via Goldman Sachs and Morgan Stanley on July 31. Analysts view the use of the euro-yen pair as a way to alleviate yen pressure without adding selling pressure to the US dollar. * Prior to the action, the New York Fed conducted "rate checks" on both USD/JPY and EUR/JPY, a newer signaling tool that falls between verbal and physical intervention. The intervention is interpreted as going beyond traditional currency stabilization. Analysts, such as Michael Hartnett of Bank of America, suggest it resembles a "Price Keeping Operation" for the AI era. The core US objectives are perceived to be: 1. Preventing rapid yen depreciation from triggering a sharp rise in Japanese government bond yields. 2. Containing financial stress from spreading across Asian markets like South Korea and Japan. 3. Reducing the risk of disorderly capital flows impacting the US bond market. This coordinated action underscores the importance of Japan and South Korea as critical partners in the US semiconductor and AI supply chain. Stabilizing their financial markets is seen as vital to mitigating risks to the broader tech industry and the US market itself. The intervention coincides with market pressures, including the KOSDAQ index hitting a low since October 2022. While seen as a move to control volatility, some analysts caution it may not fundamentally reverse existing market trends.

marsbitHace 6 min(s)

A 'Overlooked' Market Event: Joint US-Japan-South Korea Intervention, Rare US Treasury Involvement, and Bessent's Quiet 'Market Rescue'?

marsbitHace 6 min(s)

Will the Federal Reserve Definitely Raise Interest Rates in September? How Will Cryptocurrencies and US Stocks Bear the Pressure?

In early August 2024, market expectations for a September Federal Reserve rate hike surged dramatically, from below 50% to over 80%, driven by renewed inflation concerns. This shift followed a contentious July FOMC meeting where a 9-3 vote to hold rates revealed a growing hawkish faction advocating for an immediate hike, citing prolonged above-target inflation. The key catalyst is escalating conflict near the Strait of Hormuz, which has pushed oil prices up approximately 20% in July, threatening to reignite inflation. The next critical data point is the July CPI report on August 12th; a hot reading could solidify hike expectations. For crypto assets, particularly Bitcoin, this represents near-term pressure. Bitcoin continues to exhibit high-beta, risk-on characteristics, making it sensitive to tightening liquidity and higher opportunity costs. However, historical precedent suggests that if a hike is perceived as the cycle's end rather than its start, the negative impact may be brief, with markets quickly pivoting to anticipate future rate cuts. U.S. stocks, especially crypto-linked equities like Coinbase and high-valuation tech stocks, face amplified volatility. Higher rates increase discount rates in valuation models, pressuring growth stocks. This coincides with a pivotal tech earnings season where investor focus has shifted from massive AI capital expenditures to demonstrable revenue and cash flow generation. Companies with negative cash flows and weak growth narratives could see severe pressure if a September hike materializes, as financing costs would rise. Key indicators to watch include oil prices, upcoming inflation data, and Fed commentary at events like the Jackson Hole symposium.

Odaily星球日报Hace 6 min(s)

Will the Federal Reserve Definitely Raise Interest Rates in September? How Will Cryptocurrencies and US Stocks Bear the Pressure?

Odaily星球日报Hace 6 min(s)

Trading

Spot

Artículos destacados

Cómo comprar LINK

¡Bienvenido a HTX.com! Hemos hecho que comprar ChainLink (LINK) sea simple y conveniente. Sigue nuestra guía paso a paso para iniciar tu viaje de criptos.Paso 1: crea tu cuenta HTXUtiliza tu correo electrónico o número de teléfono para registrarte y obtener una cuenta gratuita en HTX. Experimenta un proceso de registro sin complicaciones y desbloquea todas las funciones.Obtener mi cuentaPaso 2: ve a Comprar cripto y elige tu método de pagoTarjeta de crédito/débito: usa tu Visa o Mastercard para comprar ChainLink (LINK) al instante.Saldo: utiliza fondos del saldo de tu cuenta HTX para tradear sin problemas.Terceros: hemos agregado métodos de pago populares como Google Pay y Apple Pay para mejorar la comodidad.P2P: tradear directamente con otros usuarios en HTX.Over-the-Counter (OTC): ofrecemos servicios personalizados y tipos de cambio competitivos para los traders.Paso 3: guarda tu ChainLink (LINK)Después de comprar tu ChainLink (LINK), guárdalo en tu cuenta HTX. Alternativamente, puedes enviarlo a otro lugar mediante transferencia blockchain o utilizarlo para tradear otras criptomonedas.Paso 4: tradear ChainLink (LINK)Tradear fácilmente con ChainLink (LINK) en HTX's mercado spot. Simplemente accede a tu cuenta, selecciona tu par de trading, ejecuta tus trades y monitorea en tiempo real. Ofrecemos una experiencia fácil de usar tanto para principiantes como para traders experimentados.

1.1k Vistas totalesPublicado en 2024.12.13Actualizado en 2026.06.02

Cómo comprar LINK

Discusiones

Bienvenido a la comunidad de HTX. Aquí puedes mantenerte informado sobre los últimos desarrollos de la plataforma y acceder a análisis profesionales del mercado. A continuación se presentan las opiniones de los usuarios sobre el precio de LINK (LINK).

活动图片