BTC Thrice Rejected at $80,000 Threshold, HYPE Reaches New Highs Signaling Opportunity | Guest Analysis

marsbitPublicado a 2026-05-26Actualizado a 2026-05-26

Resumen

**Bitcoin (BTC) Struggles at $80k; HYPE Reaches New Highs | Key Analysis & Strategy** Bitcoin faces continued resistance in the $78.5k - $79.5k zone after failing to sustain a break above its daily chart rising channel. It has retreated to the channel's midline. A failure to hold here could see a test of the $73.5k - $75k support area. The 4-hour chart shows a complex corrective structure. The strategy is neutral for mid-term positions. For short-term trading, two scenarios are outlined: **A)** Selling on a failed rally into the $78.5k-$79.5k resistance, and **B)** Selling on a confirmed breakdown below the $73.5k-$75k support, both with tight risk management. Meanwhile, **HYPE** has posted consecutive highs. The 4-hour chart indicates its current uptrend may be weakening near $65, with models showing potential bearish divergence. The view is that a short-term top could be forming. The strategy advises against chasing the rally and instead looking for a potential long entry on a pullback to the $47.5 - $50 support zone, provided clear reversal signals appear. Last week, a disciplined short BTC trade based on model signals yielded a 2.78% profit. The article emphasizes that all analysis is for informational purposes only and not investment advice, highlighting the importance of strict stop-loss discipline and dynamic position management in a volatile market. *(Note: The text references proprietary models like the "Price Difference Trading Model" and "Momentum Quantificatio...

Continuing our consistent structured analysis framework this week, we focus on two key assets, Bitcoin and HYPE, dissecting the current price action across multiple timeframes. We will examine the ongoing battle between bulls and bears at critical resistance and support zones and formulate specific, actionable operational plans accordingly.

Last week's short position successfully realized a gain of 2.78%, once again validating the trading logic of "signal-driven, disciplined execution." However, a single profitable trade never implies the market direction is definitively correct—the market always retains the potential to move beyond expectations.

The core variable for this week remains the struggle between the resistance zone of $78,500~$79,500 and the support zone of $73,500~$75,000. The outcome will be left for the market to decide.

Summary of This Week's Core Trading Views:

• Analysis of BTC's Multi-Timeframe Price Structure. (Detailed in Part 1)

• BTC Market Forecast and Medium-/Short-Term Trading Strategies for This Week. (Detailed in Part 2)

• Analysis of HYPE's Hourly Chart Price Structure. (Detailed in Part 3)

• HYPE Market Forecast and Short-Term Trading Strategy for This Week. (Detailed in Part 4)

Verification of Last Week's Trading Strategy and Core Views:

• BTC Short-Term Trade Performance: Bitcoin executed one short-term short trade last week (1x leverage), successfully achieving a return of approximately 2.78%. (Detailed in Table 1)

• Market Verification of BTC Trend Forecast: In last week's article, we stated: If the price effectively breaks below the support zone of $78,500~$79,500, it will test the support strength near $75,000. The current market movement has verified our previous forecast.

1. Analysis of Bitcoin's Multi-Timeframe Price Structure

1.1 BTC Daily Chart Structure Analysis

Bitcoin _ Daily Chart:
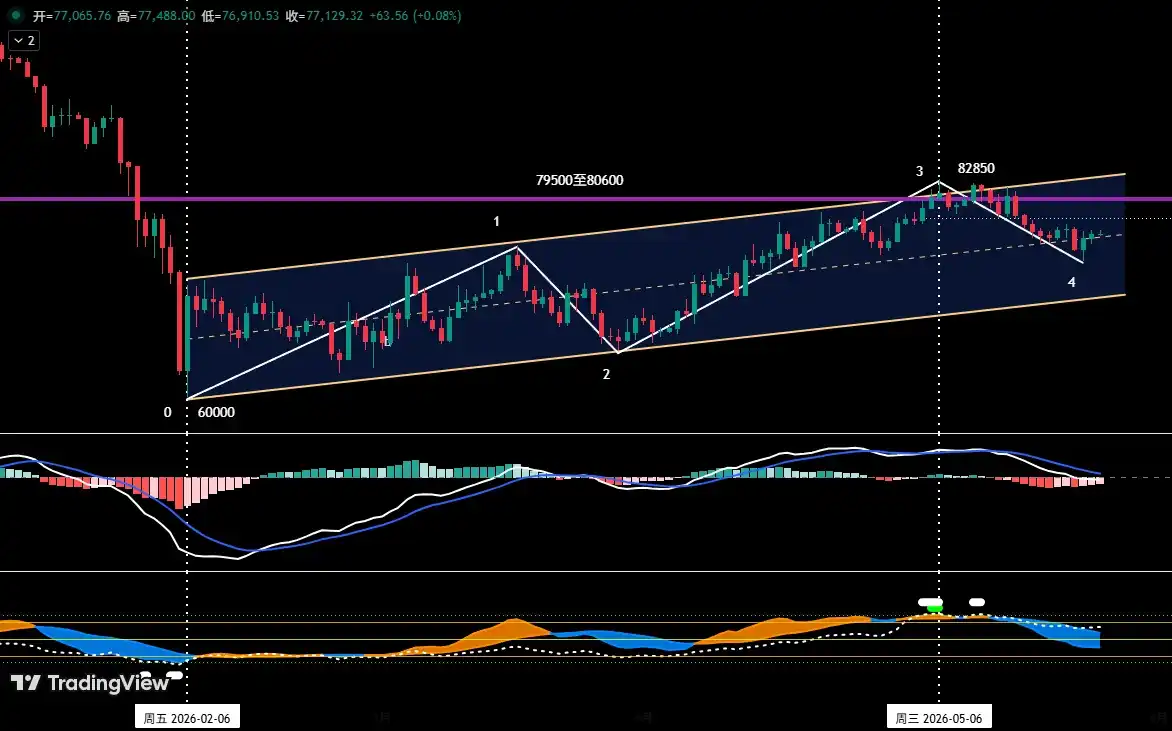
Figure 1

• As shown in (Figure 1), since establishing a significant low near $60,000 on February 6, 2026, Bitcoin's daily chart has constructed and maintained a clearly defined ascending channel: its lower boundary is formed by connecting the lows of February 6 and March 29, while the upper boundary is drawn parallel to the lower boundary through the high of March 17.

• In our weekly review on April 27, we pointed out: "The current price is facing dual resistance from the channel's upper boundary and the $79,500 to $80,600 resistance zone. A breakout is expected to be difficult." Subsequent market action validated this view. After nearly 20 days of struggle between bulls and bears, although a new rebound high of $82,850 was reached on May 6, the price failed to decisively break above this resistance area and subsequently began a corrective pullback.

From the current structure, the price has retraced from near the channel's upper boundary to the mid-channel area. If the price fails to find effective support near the mid-channel and resume its uptrend, the probability of it seeking support at the channel's lower boundary increases.

1.2 In-Depth Analysis of BTC's Hourly Chart Structure

Bitcoin _ 4-Hour Chart
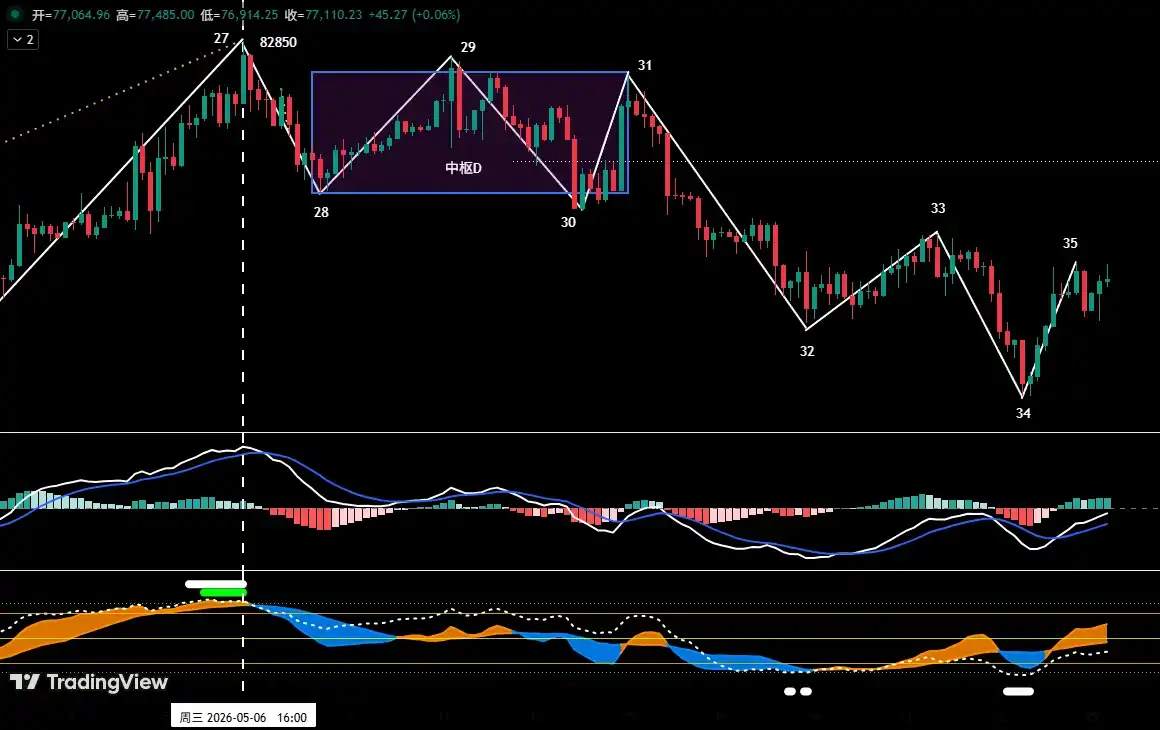
Figure 2

As shown in (Figure 2), from the high of $82,850 on May 6 to the present correction:

• The 4-hour chart shows it can be subdivided into an 8-segment corrective structure: "segment 27-28" to "segment 34-35". Center D: Segments 28-29, 29-30, and 30-31 overlap, constituting Center D.

• From the 4-hour price structure, segment 34-35 is about to rebound to the $78,500~$79,500 zone. If the rebound faces rejection upon reaching this area and fails to form a decisive breakout, the market is likely to continue its current corrective consolidation pattern and test the core support band of $73,500~$75,000 again.

2. Bitcoin Market Forecast and Trading Strategy for This Week

2.1 BTC Market Trend Forecast for This Week:

This week's core view: Focus on the outcome of the battle between bulls and bears over the $78,500~$79,500 resistance zone and the $73,500~$75,000 support zone.

2.2 Core Resistance Levels:

• Primary Resistance Zone: $78,500~$79,500 area (near the boundaries of two centers)

• Secondary Resistance Zone: $83,500~$84,500 area (previous high-volume trading congestion zone)

2.3 Core Support Levels:

• Primary Support Zone: $73,500~$75,000 area (previous significant support level)

• Secondary Support Zone: $69,500~$70,500 area (previous significant support level)

2.4 Trading Strategy for This Week (Excluding Impact of Sudden News)

1. Medium-Term Strategy:

Bitcoin _ Daily Chart: (Position Monitoring Model)
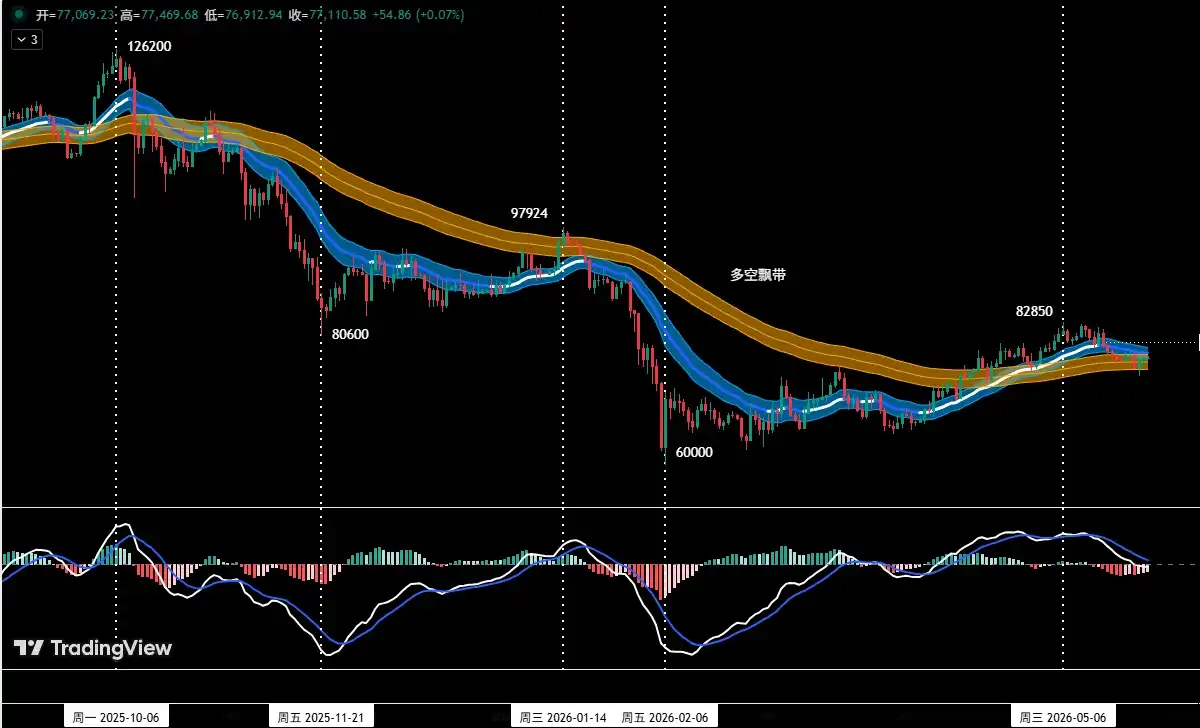
Figure 3

Position Monitoring Model: As shown in (Figure 3), based on trading rules, the medium-term market direction is not yet clear. Maintain a neutral/观望 stance for medium-term positions this week.

2. Short-Term Strategy: Utilize 30% of capital, set stop-losses, and look for "spread" trading opportunities based on support and resistance levels. (Using 30-minute/60-minute charts as the operational timeframe).

3. For short-term operations, to dynamically adapt to the market's complex evolution, we have pre-formulated two specific operational plans: A/B.

Plan A: Rebound Faces Resistance, Sell High.

• Entry: When the price rebounds to the $78,500~$79,500 zone and encounters resistance, combined with a top signal from the quantitative model, a short position of less than 30% can be established.

• Risk Control: Initial stop-loss set above $80,600.

• Exit: When the correction approaches important support levels combined with model signals, gradually close the position to take profits.

Plan B: Support Breached Effectively, Follow the Trend Short.

• Entry: When the price effectively breaks below the $73,500~$75,000 support zone combined with a model top signal, a short position of less than 30% can be established.

• Risk Control: Initial stop-loss set above $76,500.

• Exit: When the decline reaches important support levels combined with model signals, gradually close the position to take profits.

3. Analysis of HYPE's Price Structure

HYPE_4-Hour Chart
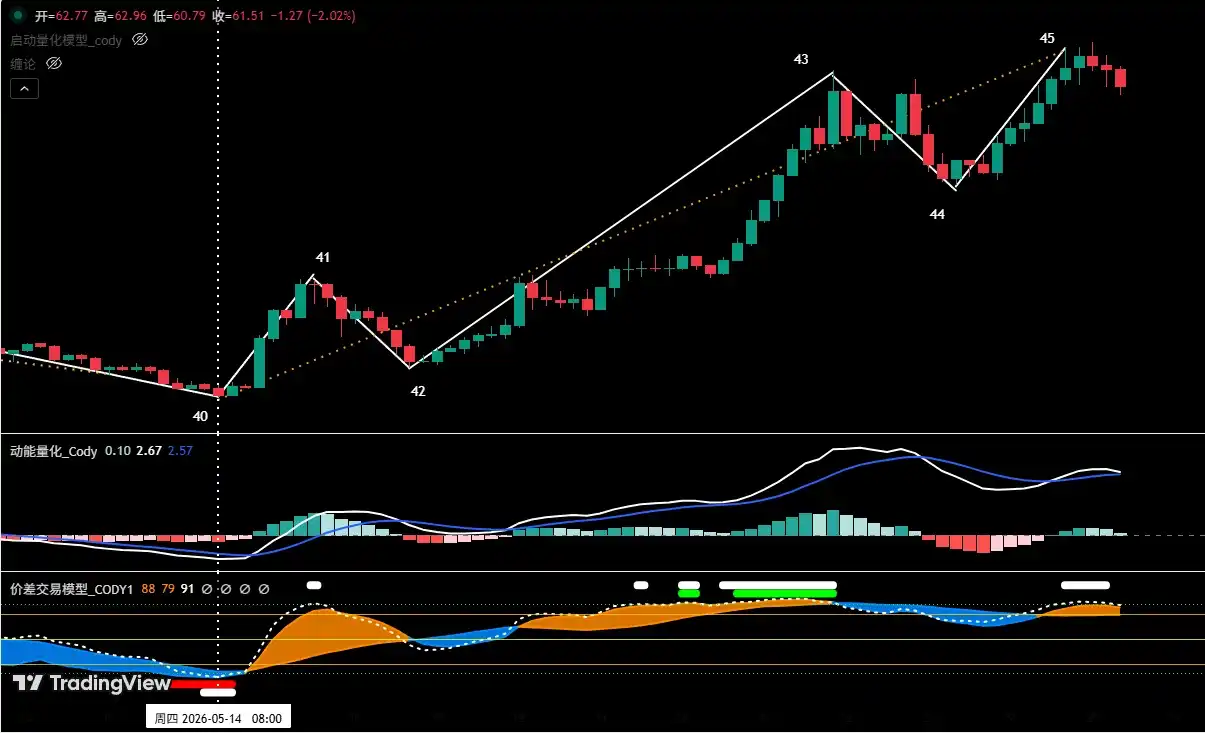
Figure 4

1. As shown in (Figure 4), the rally in HYPE from the low of $38.14 on May 14, on the 4-hour chart, can be divided into a five-segment structure: 40-41, 41-42, 42-43, 43-44, 44-45.

2. Our proprietary "Spread Trading Model" shows that near endpoint 45, a top warning signal (white dot) has been triggered.

3. From the perspective of the "Momentum Quantitative Model," the rising segment (44-45) near $65 has shown signs of waning upward momentum.

4. If a bearish momentum divergence forms at the "endpoint 45" position, overlapping with the top warning signal from the "Spread Trading Model," creating a共振 (resonance), the probability of the price forming a short-term high here increases significantly.

4. HYPE Market Forecast and Short-Term Trading Strategy for This Week

4.1 HYPE Market Trend Forecast for This Week:

This week's core HYPE view:

• Observe whether "endpoint 45" can form a short-term high since the rally began on May 14.

• If a short-term high forms, subsequently look for short-term long opportunities after the price pulls back to a key support area (e.g., $47.5 to $50) and shows clear signs of stabilization.

4.2 HYPE Short-Term Trading Strategy for This Week: (Buy on Support)

Currently, adhere to the strategy of "avoid盲目追涨 (blindly chasing rallies), buy on dips." If the price corrects to the $47.5 to $50 zone, finds support, and shows stabilization signals, combined with bottom signals triggered by both models, consider a light long position. Position size must be controlled below 30%, with strict stop-loss discipline.

5. Trade Review

5.1 Short-Term Trade Review:(See Table 1)

Strictly following the operational plan, based on trading signals from our proprietary "Spread Trading Model" and "Momentum Quantitative Model," we completed one short-term (short) trade last week, achieving a profit of 2.78%.

5.1 Bitcoin Short-Term Trade Details Summary: (Leverage*1x)
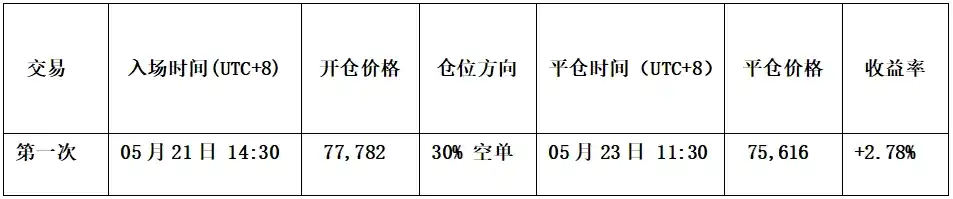
Table 1

5.2 Short-Term Trade Review: (See Figure 5)

• Entry Strategy:

a. When the price rebounded to near $78,500, encountered resistance, and showed bearish pressure signals, with the candlestick forming a "top reversal" bearish signal;

b. The "Spread Trading Model" triggered a top warning signal (white dot), and the "Momentum Quantitative Model" formed a bearish momentum divergence signal.

Therefore, we established a 30% short position at $77,782.

• Exit Strategy:

a. When the price fell to near $75,000 and found support, with the candlestick forming a "bottom reversal" signal;

b. The "Spread Trading Model" triggered a strong bottom warning signal (red dot + white dot), forming a bottom共振 (resonance) signal with the "Momentum Quantitative Model."

Therefore, we closed the entire position near $75,616.

• Summary: This trade successfully realized a profit of approximately 2.78%.

BTC_30 Minute Chart: (Momentum Quantitative Model + Spread Trading Model)
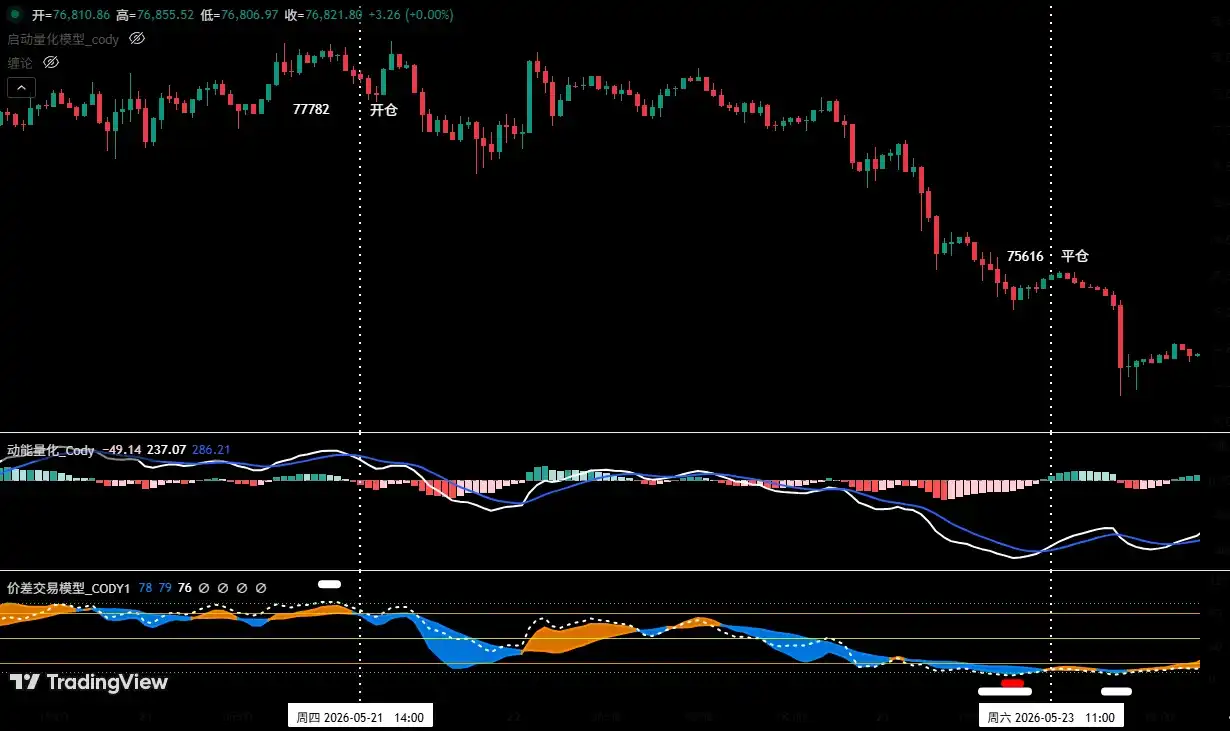
Figure 5 (Short-Term Trade Illustration)

6. Special Reminders:

1. Upon Entry: Immediately set the initial stop-loss.

2. When Profit Reaches 1%: Move the stop-loss to the entry price (breakeven point) to ensure principal safety.

3. When Profit Reaches 2%: Move the stop-loss to the 1% profit level.

4. Continuous Tracking: Thereafter, for every additional 1% profit, move the stop-loss up by 1%, dynamically protecting and locking in profits.

Financial markets are瞬息万变 (constantly changing). All market analysis and trading strategies require dynamic adjustment. All views, analytical models, and operational strategies mentioned in this article are derived from personal technical analysis, intended solely for personal trading journal purposes. They do not constitute any investment advice or operational basis. The market involves risks; invest with caution. Do not make decisions based solely on this content.


Criptos en tendencia

Preguntas relacionadas

QWhat is the core resistance zone that Bitcoin (BTC) is struggling to break through according to the article?

AAccording to the article, Bitcoin (BTC) is struggling to break through the core resistance zone of $78,500 to $79,500. This area has acted as a key barrier, with BTC facing it three times already.

QWhat are the two specific short-term operation plans outlined for Bitcoin in the article?

AThe article outlines two short-term operation plans for Bitcoin (BTC): Plan A: 'Rebound meets resistance, sell high' - open a short position if the price rebounds to the $78,500-$79,500 resistance zone and shows signs of pressure. Plan B: 'Effectively breaks support, follow the trend to sell short' - open a short position if the price effectively breaks below the $73,500-$75,000 support zone.

QWhat is the key support area to watch for HYPE according to the analysis?

AThe key support area to watch for HYPE, as per the article, is the $47.5 to $50 region. The strategy suggests looking for short-term buying opportunities if the price falls back to this zone, shows signs of stabilization, and is accompanied by bottom signals from their trading models.

QWhat trading models does the article mention were used for the successful short-term BTC trade last week?

AThe article mentions that last week's successful short-term BTC trade was executed based on signals from two proprietary models: the 'Price Difference Trading Model' and the 'Dynamic Energy Quantification Model'.

QWhat is the overall stance for Bitcoin's medium-term strategy this week according to the 'Position Monitoring Model'?

AAccording to the 'Position Monitoring Model' shown in the article, the medium-term strategy for Bitcoin (BTC) this week is to maintain an empty position and adopt a wait-and-see approach, as the medium-term market direction is not yet clear.

Lecturas Relacionadas

After Aave's Exit and TVL's Sharp Fluctuation, Where Does MegaETH's Valuation Anchor Lie?

Following the withdrawal of Aave and a sharp drop in its Total Value Locked (TVL), the valuation of the high-performance DeFi blockchain MegaETH faces scrutiny. Once a highly anticipated project with a fully diluted valuation (FDV) reaching around $2 billion, MegaETH saw its TVL plummet from a May peak of $245 million to just over $30 million in July, a roughly 70% decline. Its native token, MEGA, currently trades around $0.048 with a market cap of approximately $54 million and an FDV of about $480 million. The report identifies a core vulnerability: MegaETH's TVL was heavily dependent on a single protocol, Aave V3, which at its peak contributed around 90% of the chain's TVL. A significant portion of this capital is attributed to leveraged yield-farming strategies involving stablecoins like USDe. When the profitability of these strategies diminished, capital rapidly exited, exposing the lack of diversified, sustainable activity. Three key mismatches between MegaETH's valuation and its fundamentals are highlighted: 1. **Valuation vs. Real Usage:** With an FDV of ~$4.8B but only ~$1M in annualized protocol revenue and ~2,600 daily active addresses, the valuation appears disconnected from current economic activity. 2. **Token Narrative vs. Ecosystem Reality:** Despite its DeFi narrative, nearly 80% of the chain's recent protocol revenue comes from a trading card game, Monster, not from core DeFi applications like Aave. The chain's native stablecoin, USDM, also shows low trading volume and a declining market cap. 3. **Short-Term Hype vs. Long-Term Delivery:** Initial hype from token generation, blue-chip integrations, and influencer support has faded. Major protocols like Uniswap now hold minimal TVL on the chain, indicating that early capital was largely transient and driven by incentives rather than organic demand. The situation reflects a broader market trend where investors are becoming less tolerant of valuations based on inflated TVL and narrative, demanding clearer evidence of sustainable transactions, revenue, and ecosystem development. While MEGA's price may experience short-term rebounds from market sentiment, a fundamental re-rating likely depends on the team's ability to convert its remaining resources into tangible, user-retaining applications and genuine ecosystem growth.

链捕手Hace 1 hora(s)

After Aave's Exit and TVL's Sharp Fluctuation, Where Does MegaETH's Valuation Anchor Lie?

链捕手Hace 1 hora(s)

Goldman Sachs In-Depth Report: Who Will Be the Long-Term Winners in China's AI Large Model Industry?

Goldman Sachs Report: China's AI Models at an Inflection Point China's open-source/open-weight large language models (LLMs) have reached performance parity with top global proprietary models, according to a Goldman Sachs report. This is driven by architectural innovations and higher parameter efficiency, allowing Chinese models to achieve comparable capabilities at 2%-10% the parameter size and significantly lower cost. The market is evolving into a two-tiered structure: a high-end segment (e.g., GLM5.2, Qwen3.7 Max) with premium pricing and a low-end, price-sensitive segment for global SMEs and individual users. Key points: * **Cost & Performance:** Innovations like Mixture of Experts (MoE) enable high performance with smaller models. Projects like Meituan's LongCat 2.0, trained on domestic hardware, highlight progress in tech self-sufficiency. * **Open-Source Strategy:** Most Chinese players use open-source/open-weight models for flexibility and ecosystem growth. However, Goldman notes this may underreport actual deployment and revenue. A shift toward "open-weight + community license" models with revenue sharing (e.g., MiniMax) could improve monetization. * **Market Shift & Global Expansion:** Enterprise AI adoption is shifting from "token maximization" to "ROI-first." International expansion, especially in non-US markets, is a major growth driver. Chinese models are increasingly available on global platforms like AWS Bedrock and Microsoft Copilot. * **Competitive Landscape:** Using a framework based on pricing power, cost advantage, and financial strength, Goldman identifies **Zhipu AI and DeepSeek** as the strongest in foundational text models, and **ByteDance** as the leader in multimodal/video generation. The report maintains Buy ratings on MiniMax and Kuaishou. * **Market Growth:** China's AI model API and subscription revenue is projected to grow from an estimated ¥35 billion in 2026 to ¥879 billion by 2030.

marsbitHace 2 hora(s)

Goldman Sachs In-Depth Report: Who Will Be the Long-Term Winners in China's AI Large Model Industry?

marsbitHace 2 hora(s)

Goldman Sachs Deep Dive Report: Who Will Become the Long-Term Winners in China's AI Large Model Industry?

Goldman Sachs Report: Who Will Be the Long-Term Winners in China's AI Large Model Industry? China's AI large model sector is at a historic inflection point. Goldman Sachs argues that the intelligence of Chinese open-source/open-weight models is approaching top global proprietary models. Rapid adoption by domestic enterprises and global SMEs is creating a data flywheel effect that will further drive model iteration. The evolution is summarized as moving from "DeepSeek's cost-efficiency moment last year to GLM's model-intelligence moment this year." Chinese models achieve near-state-of-the-art performance at significantly lower cost, primarily due to architectural innovations like Mixture of Experts (MoE) and higher parameter efficiency. Models like DeepSeek V4 Pro (1.6T params), GLM5.2 (0.7T), and MiniMax M3 (0.4T) are much smaller than global leaders. Recent advancements in coding capability are attributed to better data curation and RLHF. Landmarks like Meituan's LongCat 2.0, trained fully on domestic AI chips, demonstrate progress in hardware stack independence. The market is forming a "two-tiered structure." The high-end tier (e.g., GLM5.2, Alibaba's Qwen3.7 Max) prices around $1 per million tokens, about 10-25% of US top models, with estimated inference gross margins of 10-20%. The low-end tier (priced as low as $0.06-$0.2 per million tokens) targets price-sensitive global SMEs and individuals. MiniMax derives 60-70% of revenue overseas. Goldman forecasts China's AI model API/subscription revenue to grow from an estimated RMB 35bn in 2026 to RMB 879bn by 2030. Most Chinese players adopt open-source/open-weight strategies for deployment flexibility and community feedback, though this limits monetization as deployments on third-party platforms (e.g., Alibaba Cloud) may not generate direct revenue. A shift towards "open-weight + community license" models with revenue-sharing agreements (like MiniMax's approach) could improve unit economics. International expansion, particularly in non-US markets, is the key growth driver. The global enterprise AI paradigm is shifting from "token maximization" to "ROI prioritization." Chinese models are already hosted on major global platforms like AWS Bedrock and are under consideration for integration into Microsoft Copilot. Using a competitive framework based on pricing power, cost advantage, and financial strength, Goldman identifies the strongest players: In foundational text models, Zhipu AI (initiated coverage) and DeepSeek lead. In multimodal/video generation, ByteDance's Seed is the frontrunner, with Kuaishou's Kling and MiniMax's Hailuo also well-positioned. Goldman maintains a Buy rating on MiniMax, citing its attractive valuation.

链捕手Hace 2 hora(s)

Goldman Sachs Deep Dive Report: Who Will Become the Long-Term Winners in China's AI Large Model Industry?

链捕手Hace 2 hora(s)

Trading

Spot

Artículos destacados

Cómo comprar HYPE

¡Bienvenido a HTX.com! Hemos hecho que comprar Hyperliquid (HYPE) sea simple y conveniente. Sigue nuestra guía paso a paso para iniciar tu viaje de criptos.Paso 1: crea tu cuenta HTXUtiliza tu correo electrónico o número de teléfono para registrarte y obtener una cuenta gratuita en HTX. Experimenta un proceso de registro sin complicaciones y desbloquea todas las funciones.Obtener mi cuentaPaso 2: ve a Comprar cripto y elige tu método de pagoTarjeta de crédito/débito: usa tu Visa o Mastercard para comprar Hyperliquid (HYPE) al instante.Saldo: utiliza fondos del saldo de tu cuenta HTX para tradear sin problemas.Terceros: hemos agregado métodos de pago populares como Google Pay y Apple Pay para mejorar la comodidad.P2P: tradear directamente con otros usuarios en HTX.Over-the-Counter (OTC): ofrecemos servicios personalizados y tipos de cambio competitivos para los traders.Paso 3: guarda tu Hyperliquid (HYPE)Después de comprar tu Hyperliquid (HYPE), guárdalo en tu cuenta HTX. Alternativamente, puedes enviarlo a otro lugar mediante transferencia blockchain o utilizarlo para tradear otras criptomonedas.Paso 4: tradear Hyperliquid (HYPE)Tradear fácilmente con Hyperliquid (HYPE) en HTX's mercado spot. Simplemente accede a tu cuenta, selecciona tu par de trading, ejecuta tus trades y monitorea en tiempo real. Ofrecemos una experiencia fácil de usar tanto para principiantes como para traders experimentados.

239 Vistas totalesPublicado en 2024.12.11Actualizado en 2026.06.02

Cómo comprar HYPE

Discusiones

Bienvenido a la comunidad de HTX. Aquí puedes mantenerte informado sobre los últimos desarrollos de la plataforma y acceder a análisis profesionales del mercado. A continuación se presentan las opiniones de los usuarios sobre el precio de HYPE (HYPE).

活动图片