This week, the market is in a critical phase of structural validation: whether BTC's daily adjustment can bottom out and stabilize above $60,950, and whether HYPE can effectively hold above the $58~$58.5 resistance zone to form a breakout segment, are the two core focal points determining the subsequent market direction. The following are this week's core viewpoints and detailed technical analysis.
Summary of This Week's Core Trading Views:
- BTC Multi-Cycle Trend Structure Analysis (Details in Part 1)
- BTC Market Forecast and Mid-/Short-term Trading Strategies for This Week (Details in Part 2)
- HYPE Hourly Trend Structure Analysis (Details in Part 3)
- HYPE Market Forecast and Short-term Trading Strategy for This Week (Details in Part 4)
Market Verification of Last Week's Trading Strategy and Core Views:
- Verification of BTC Market Outlook: Last week's article emphasized: The probability of the daily short-term adjustment completing its termination above the $60,900-$61,500 zone is relatively high. Currently, actual market movements align with our forecast.
- Verification of HYPE Market Outlook: Review from last week's article: A daily-level rebound probability was significant at the convergence of triple technical supports (long-term uptrend line, short-term descending channel lower rail, and the $50~$52 zone). The current actual price action is highly consistent with our analytical view.
I. Bitcoin Multi-Cycle Trend Structure Analysis
1. Bitcoin Daily Level Trend Structure Analysis: (Based on post-May 6th price action)
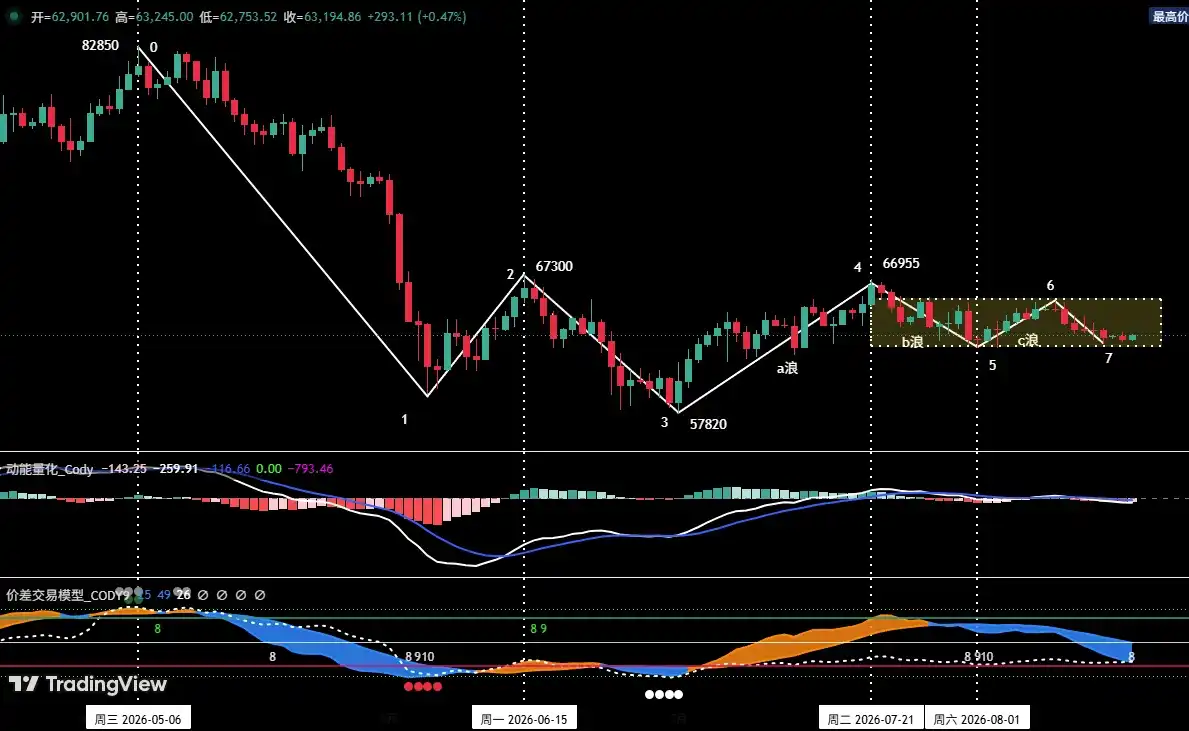
Figure 1 Bitcoin Daily K-line Chart
1. As shown in (Figure 1): The correction initiated from the May 6th high of $82,850 has presented a seven-segment corrective structure on the daily chart: (0-1), (1-2), (2-3), (3-4), (4-5), (5-6), (6-7).
2. Daily Structure Analysis: Regarding the price action since the rebound from the July 1st low of $57,820, the market may evolve in the following three potential paths:
Path One: Maintain the previous view, continue the daily Wave C rebound. Assume the daily Wave B correction ended at the August 1st low of $62,268, and the current price action is in the Wave C rebound phase. The primary target for this path is the $67,300 resistance zone. If effectively broken, the next target is the $69,500~$71,000 zone.
Path Two: Range consolidation followed by a breakout. Price finds support above $60,950, maintaining a range-bound consolidation pattern between $60,950~$65,500 (forming an upward consolidation zone). After the formation completes, price breaks above the range upper rail, testing the $67,300 key resistance again.
Path Three: Breakdown and initiation of a secondary bottom. Price effectively breaks below the strong support zone of $60,950~$61,500, and the market will initiate a secondary bottoming process.
3. Based on analysis from a self-constructed quantitative model, the probability of the market following the first two paths is higher.
2. In-depth Analysis of Bitcoin Hourly Level Trend Structure: (Using the 4-hour cycle as analysis timeframe)
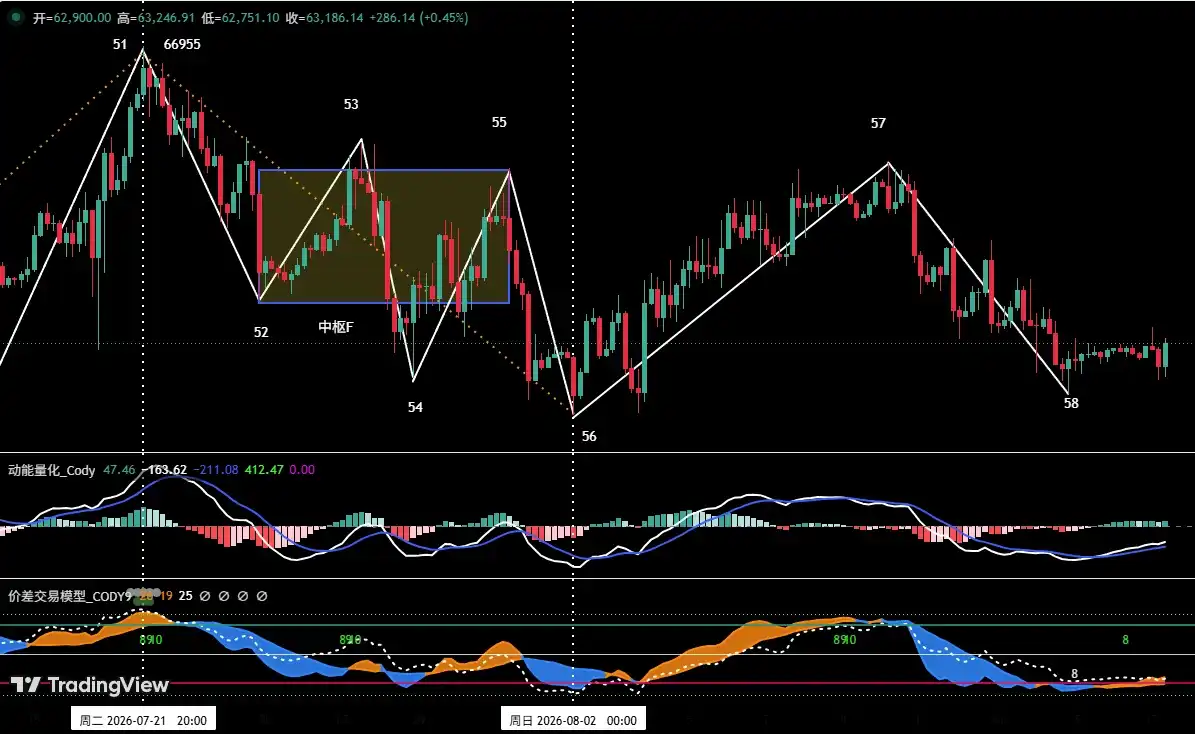
Figure 2 Bitcoin 4-hour K-line Chart
1. The daily adjustment initiated from the July 21st high of $66,955 can be clearly decomposed into seven segments from (51-52) to (57-58) on the 4-hour chart.
2. Based on the 4-hour framework analysis, the correction starting from "Endpoint 51" (approx. $69,550) to "Endpoint 56" (approx. $62,268) has presented a complete five-segment structure. If the subsequent "Endpoint 58" is lower than "Endpoint 56", the correction extends into a seven-segment structure. Considering both the trend structure and the corrective depth, this phase of adjustment is nearing its end. The current price resonates with the strong support zone of $60,950~$61,500, and the probability of the price ending the correction above $60,950 is significantly increased.
II. Bitcoin Market Forecast and Trading Strategy for This Week
1. BTC Market Trend Forecast for This Week:
Core View This Week: Closely monitor whether the daily adjustment can bottom out and stabilize above $60,950.
2. Key Resistance Levels:
• First Resistance Zone: Around $65,500 (previous important resistance area)
• Second Resistance Zone: Around $67,300 (previous important resistance area)
• Third Resistance Zone: $69,500~$71,000 area (previous important resistance area)
3. Key Support Levels:
• First Support Level: Around $62,268 (previous important support level)
• Second Support Level: $60,950~$61,500 area (previous important support level)
• Third Support Level: Around $57,820 (previous important support level)
4. Trading Strategy for This Week (Excluding Impact of Unexpected News)
1. Medium-term Strategy: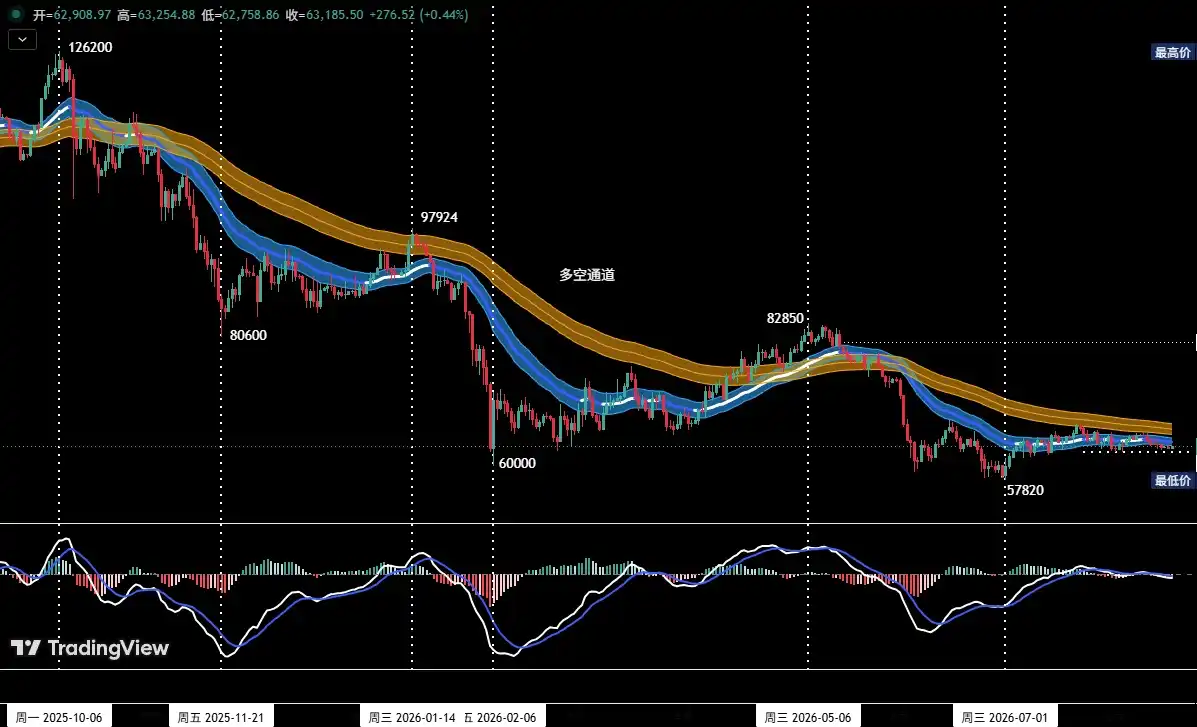
Figure 3 Bitcoin Daily K-line Chart: (Position Monitoring Model)
Position Monitoring Model: As shown in (Figure 3), the current price has effectively broken below the "Bull-Bear Channel", confirming the market structure has shifted to bear-dominated. The current medium-term short position is around 20%.
• If this week the price effectively breaks the $67,300 resistance, continues to rebound to the $69,500~$71,000 area showing clear signs of stagnation, and the quantitative model simultaneously issues a short signal, then increase the medium-term short position to 50%.
2. Short-term Strategy:
Utilize 30% of the position, set stop-loss points, and seek opportunities for "spread trading" based on support and resistance levels. (Use 30-minute/60-minute as the operation cycle).
3. In short-term operations, to dynamically respond to complex market evolutions, we have prepared two specific operation plans in advance, A and B.
• Plan A: Test short selling in strong resistance zones.
• Entry: If this week the price rebound effectively breaks the $67,300 resistance, rises to the $69,500~$71,000 area showing clear signs of stagnation, and combined with the quantitative model signal, a short position of around 30% can be established.
• Risk Control: Set an initial stop-loss level.
• Exit: When the adjustment approaches important support levels and combined with the quantitative model signal, gradually close the position to take profits.
• Plan B: Light long position testing in strong support zones.
• Entry: If the price shows signs of bottoming out and stabilizing above the $60,950~$61,500 area, combined with the quantitative model's bottom signal, a long position of around 15% can be established.
• Risk Control: Set an initial stop-loss level.
• Exit: When the rebound approaches important resistance levels and combined with the model signal, gradually close the position to take profits.
III. HYPE Hourly Level Trend Structure Analysis
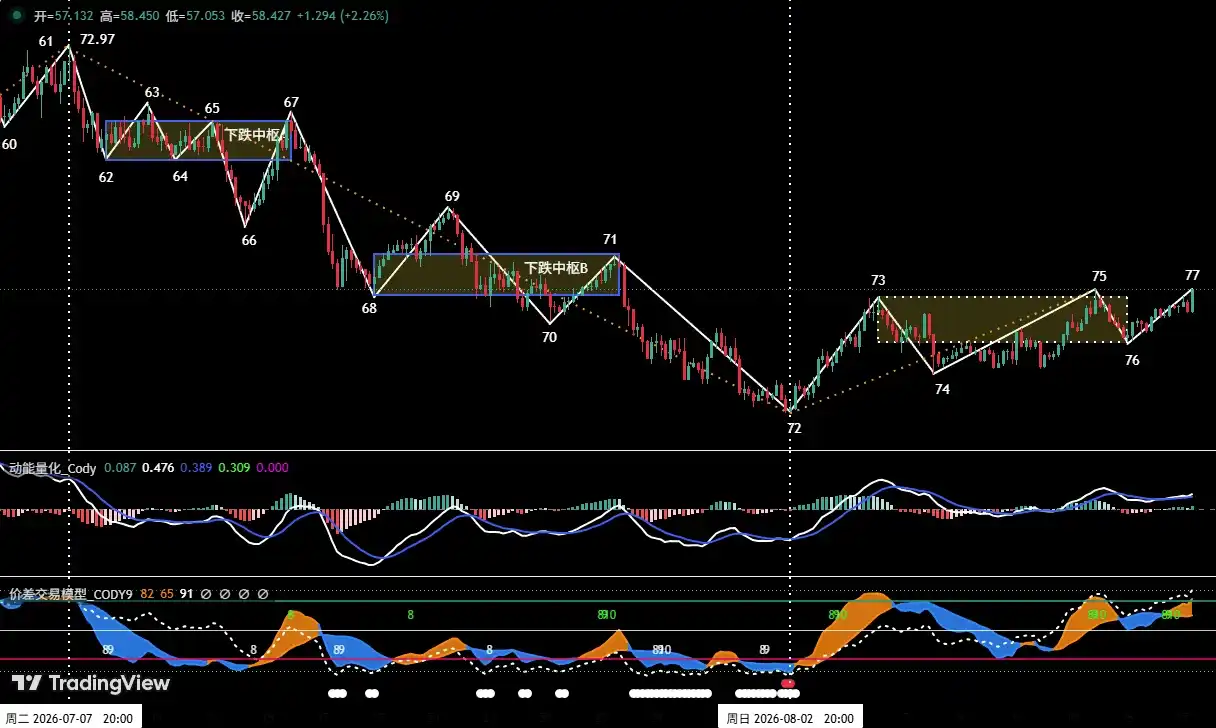
1. As shown in (Figure 4): HYPE initiated a daily-level rebound from the August 2nd low of $51.11, clearly divided into a five-segment upward structure from (72-73) to (76-77) on the 4-hour chart. Segments (73-74), (74-75), and (75-76) have overlapping ranges, forming an upward consolidation zone.
2. The market is currently running the (76-77) rebound segment. Subsequent price action may evolve in two ways:
Mode One: Formation of the breakout segment. If the price can effectively break and hold above the $58~$58.5 resistance zone and continue to rebound, then (76-77) will constitute the breakout segment. At that point, it's necessary to observe the momentum strength of the entry segment (72-73) versus the breakout segment (76-77) to see if a momentum divergence pattern forms, thereby assessing trend continuation or reversal risks.
Mode Two: Consolidation zone extension. If the price fails to effectively hold above the $58~$58.5 zone, instead falls back into the consolidation zone for continued sideways movement, it indicates the zone will enter an extension phase, potentially constructing a more complex consolidation pattern. The subsequent direction will need to wait for new breakout signals for confirmation.
IV. HYPE Market Forecast and Short-term Trading Strategy for This Week
1. HYPE Market Trend Forecast for This Week:
1. Key Resistance Levels:
• First Resistance Level: $58.5~$60 area
• Second Resistance Level: Near the descending channel upper rail
• Third Resistance Level: Around $72.97
2. Key Support Levels:
• First Support Level: $50~$52 area;
• Second Support Level: Around $45;
Core View This Week: Focus on observing whether the price can effectively break above and hold the $58~$58.5 resistance zone to form the breakout segment. This view determines the subsequent market mode.
2. HYPE Short-term Trading Strategy for This Week:
1. For holders of long positions: If long positions were established in the $50~$52 area according to previous trading plans, it is recommended to move the initial stop-loss above the entry cost and strictly adhere to stop-loss discipline, holding for further gains.
2. For those not in a position: If the price effectively breaks above the $58.5~$60 area and shows signs of stabilization, consider establishing a light long position. A stop-loss must be set, and the principle of "quick entry, quick exit" should be followed. Once signs of momentum divergence appear during the rebound, decisively exit to avoid the risk of a deep correction.
V. Special Reminders:
1. When opening a position: Immediately set the initial stop-loss level.
2. When profit reaches 1%: Move the stop-loss to the entry cost (breakeven point), ensuring capital safety.
3. When profit reaches 2%: Move the stop-loss to the 1% profit level.
4. Continuous tracking: Thereafter, for every additional 1% profit in price, move the stop-loss up by 1% accordingly, dynamically protecting and locking in profits.
Financial markets change rapidly. All market analysis and trading strategies require dynamic adjustment. All views, analytical models, and operation strategies mentioned in this article are derived from personal technical analysis, intended solely for personal trading log purposes, and do not constitute any investment advice or operational basis. Markets involve risks, invest with caution. Do not make decisions based solely on this content.