Bitcoin's Key Channel Broken? History Won't Simply Repeat Itself | Invited Analysis

Odaily星球日报Publicado a 2026-01-26Actualizado a 2026-01-26

Resumen

This analysis by Odaily's market analyst Cody examines Bitcoin's recent price action and potential future trajectories. The key technical focus is the breach of Bitcoin's critical upward channel support line, which had been acting as a "lifeline" for the market since the November 21, 2025, low of $80,600. The report compares the current market structure to the 2021 cycle, noting similarities but cautioning that history does not simply repeat itself. The current correction from the October 2025 high is analyzed as a potential three-wave structure (A-B-C). The recently concluded B-wave rally has potentially ended, and the market is now in a C-wave correction. Key support levels to watch are identified at $86,000-$86,500, $84,000, and crucially, the $80,000-$80,600 zone (the November low). A decisive break below the channel support, accompanied by a bearish crossover on the daily momentum indicator, could signal a resumption of the downtrend towards these targets. Conversely, holding above the channel could lead to a retest of resistance near $94,500. The analyst details a successful short trade from the previous week, yielding a 3.76% return, executed based on a confluence of signals from proprietary quantitative models. The weekly and daily charts are currently assessed as bearish. The recommended strategy for the coming week involves preparing for a potential breakdown below the channel with short positions (60% for mid-term, 30% for short-term trades), employing strict ri...

Odaily's Invited Market Analyst Cody, Master of Financial Statistics from Columbia University, USA, focused on quantitative trading of US stocks during university and gradually expanded to digital assets such as Bitcoin. Through practical experience, he has built a systematic quantitative trading model and risk control system; possesses keen data insight into market fluctuations and is committed to continuous深耕 in the professional trading field, pursuing steady returns; will delve into BTC technology, macro, capital side changes weekly, review and display practical strategies, and preview major upcoming events for reference.
Core Summary of Trading Weekly Report:

In the previous article, we compared the BTC trend structure of 2021 and 2025, judging that history might repeat itself (BTC would continue to adjust), which received a lot of feedback, and some analysts had different views. Below, based on this week's updates, we provide a detailed analysis of the current market trend characteristics and future focus points. Welcome everyone to discuss together.

• Strategy Execution (Short-term) Effectiveness Verification: Last week's trading strictly followed the established strategy, completing one short-term operation (1x leverage), successfully achieving a return of 3.76%. (Detailed explanation see Figure 1)

• Core View (Short-term) Verification: At the beginning of last week, the coin price quickly fell below the core range of $94,500~$95,000, returning to the original震荡 range of $84,000~$94,500, and continued to move towards the lower轨 of the range. It is emphasized that the lowest point of the coin price last week恰好 fell on the $86,000 support level we previously indicated. Overall, last week's market trend and the performance of key support levels were precisely verified by the market.

The following will详细回顾 the行情预判, strategy execution, and specific trading process.

一、Learning from History, Need a Dialectical View of the Current Market (See Figure 3)

By comparing the weekly level adjustments after two historical highs of BTC, we observed that the adjustment starting in October 2025 and the adjustment in November 2021 have惊人相似 structural规律. Currently, the market is at a critical technical choice point.

1、Key Technical Position: Gain and Loss of the Rising Channel Lower轨

The rebound starting from the low of $80,600 on November 21, 2025, has formed a clear rising channel. The lower轨 of this channel has become the "lifeline" determining the short-term trend.

2、Two Possible Paths for Bitcoin's Later Trend:

• If it steadies back above the channel lower轨, the B-wave rebound行情 is expected to continue. The next step will first test the pressure near 94,500 dollars, then challenge the key resistance level of the 21-week moving average. The realization of this path requires the配合 of macro aspects, especially the support of the Federal Reserve's policy expectations turning宽松.

• If it effectively breaks below the channel lower轨 and the model momentum line (daily) breaks below the zero axis, it宣告 the daily level has returned to a bear market. This means the B-wave rebound行情启动 from November 21, 2025, may have ended, and the C-wave adjustment will further continue, significantly increasing the possibility of the coin price falling below 80,600 dollars.

3、Three-stage Adjustment Structure Analysis: Based on the premise that the coin price effectively breaks below the channel lower轨

The current adjustment starting from October 2025 presents a typical three-stage structure:

A-wave adjustment: $126,200 (2025-10-06) to $80,600 (2025-11-21), lasting 46 days, a drop of 36%.

B-wave rebound: $80,600 (2025-11-21) to $97,924 (2026-01-14), lasting 54 days, a rise of 21.5%, this stage belongs to technical repair.

C-wave adjustment: $97,924 (January 14) to present. Currently in this stage of operation, the gain and loss of the channel lower轨 will become the key basis for judging the strength of the C-stage adjustment.

4、C-wave Adjustment Target Prediction:

$80,600, here is the B-wave starting point. If this point is effectively broken, then the A-B-C three-wave adjustment structure starting from $126,200 tends to be complete.

$75,200, this price is both the 50% Fibonacci retracement level of the A-wave decline and coincides with the adjustment low of April 2025, forming an important historical support area.

"History repeats itself, but it does not simply repeat" is the most profound dialectic of financial markets. It requires investors to both respect historical laws and discern the particularity of the current market. Therefore, all rational market predictions are probabilistic outlooks obtained after comprehensive fundamental and technical structure analysis, not deterministic prophecies. Their ultimate purpose is not to accurately predict the future, but to formulate more resilient coping strategies.

二、Bitcoin Last Week's Market Review: (01.19~01.25)

1、Last Week's Short-term Operation Review: As shown in (Figure 1)

1、Transaction Details Summary: (No leverage)

We strictly followed the trading signals issued by the self-built spread trading model and momentum quantitative model, combined with the预判 of market trends, completed one short-term operation, this transaction profit 3.76%.

Specific transaction details and复盘 as follows:

Bitcoin 30-minute K-line chart: (Momentum Quantitative Model + Spread Trading Model)
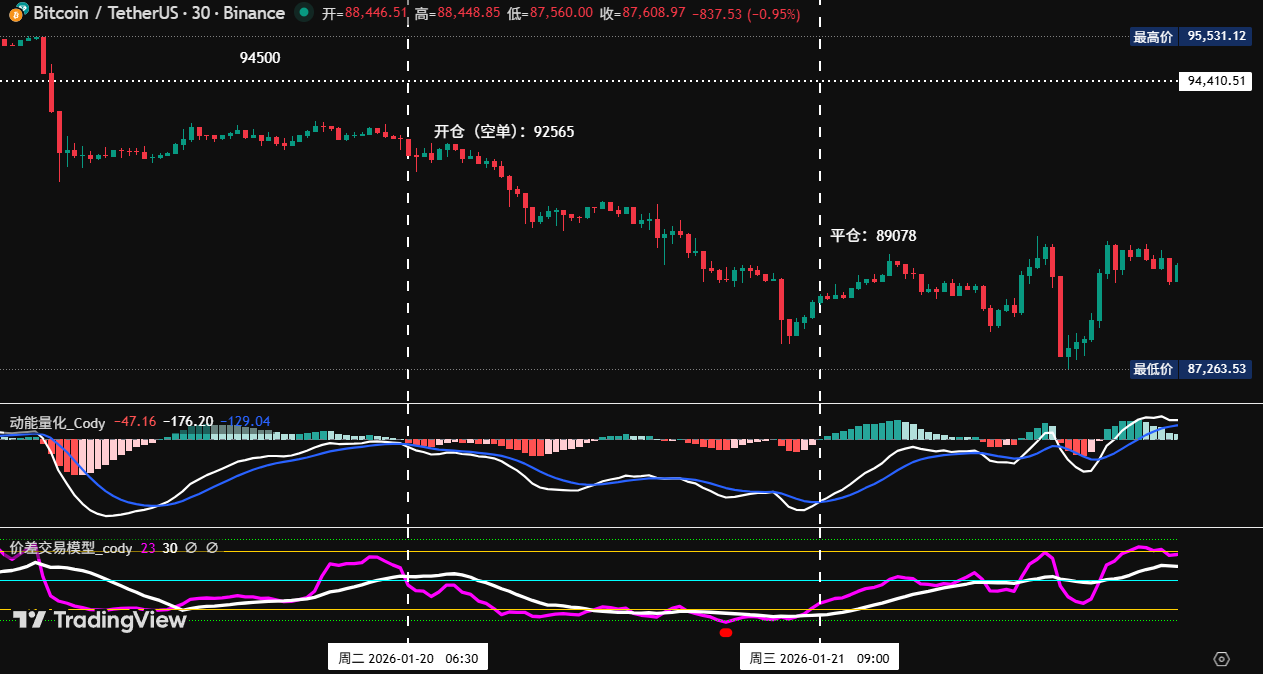
Figure 1

2、Short-term Trading复盘:

• First transaction (profit 3.76%): This operation executed Plan B (Effectively break below the key area to go short) strategy: When the coin price fell below the 94,500~95,000 dollar area and反弹无力,同时 the spread trading model and momentum model共振 triggered top signals,叠加 two momentum lines forming a死叉 below the zero axis (nearby), constituting a triple bearish signal, we据此 established a 30% short position at 92,565 dollars,随后 the market trend adjusted as expected. When the coin price fell to an important support level, the spread model率先 issued a触底预警 signal (red dot),随后 the momentum quantitative model and spread trading model再次共振 generated a bottom signal,据此 we平仓 all at 89,078 dollars, achieving the expected profit target.

2、Last Week's Trend预判 and Operation Strategy Review:

1、Last week clearly提示: Focus on the gain and loss of the 94,500~95,000 dollar area. If effectively broken, it will maintain震荡 in the 84,000~94,500 dollar range.

2、Core point review: Pressure level看 94,500~95,000 dollar area; First support看 89,500~91,000 dollar area, Second support看 86,000~86,500 dollars.

2、Operation Strategy Review:

• Mid-line strategy: Empty position.

• Short-term strategy: Because the coin price effectively broke below the 94,500~95,000 dollar area, then operate according to Plan B (see below):

• Open position: If反弹 to this area confirms the break is effective, can establish a 30% short position.

• Risk control: Short initial stop loss set at about 1.5% above the cost price(i.e., 1.015*cost price).

• Close position: When it探至 86,500 dollars nearby and combined with model signals, can gradually清仓获利了结.

三、Bitcoin Trend Structure: Daily Level Maintains Bearish Pattern

Combining market operation, the author, based on the self-built trading system, conducts a deep analysis of the Bitcoin trend structure from multiple models and dimensions.

Bitcoin Weekly K-line chart: (Momentum Quantitative Model+Sentiment Quantitative Model)
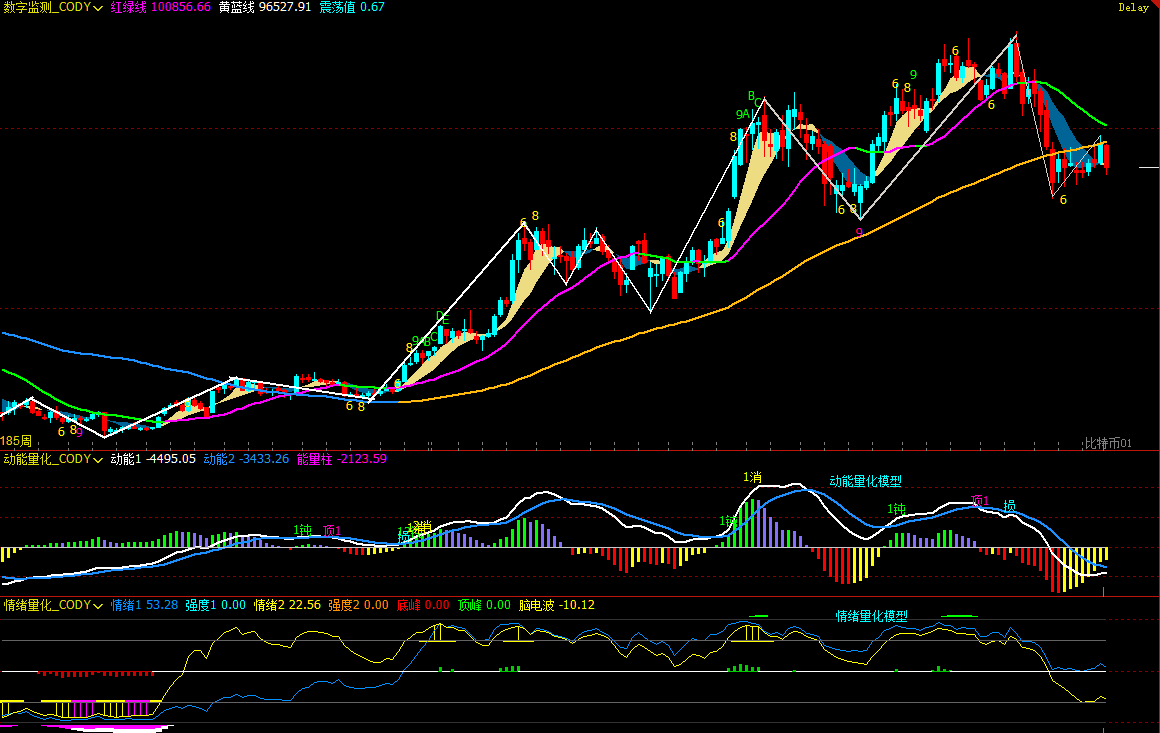
Figure 2

1、As shown in (Figure 2), analysis from the weekly chart:

Momentum Quantitative Model: Technical indicators show that last week's shorting动能 was released, the two momentum lines showed signs of opening, the negative energy column change was not obvious, pay attention to the bears' next performance.

Momentum Quantitative Model predicts: Coin price decline index: High

Sentiment Quantitative Model: Blue sentiment line value 53.28, strength zero; Yellow sentiment line value 22.56, strength zero, peak value is 0.

Sentiment Quantitative Model predicts: Coin price pressure and support index: Neutral

Digital Monitoring Model: The coin price has been below the bull-bear (yellow-blue line)分界线 for 10 weeks, the coin price fell again, the price is far from the分界线.

Digital Monitoring Model predicts: Monitoring (top/bottom) digital signals did not appear; Weekly K-line closed with a big阴线, decline about 7.55%; The近三周 K-lines form a "strong top分型" bearish pattern.

The above data predicts: Bitcoin weekly bearish trend, beware of震荡下跌 risk.

Bitcoin Daily K-line chart: (Momentum Quantitative Model+Sentiment Quantitative Model)
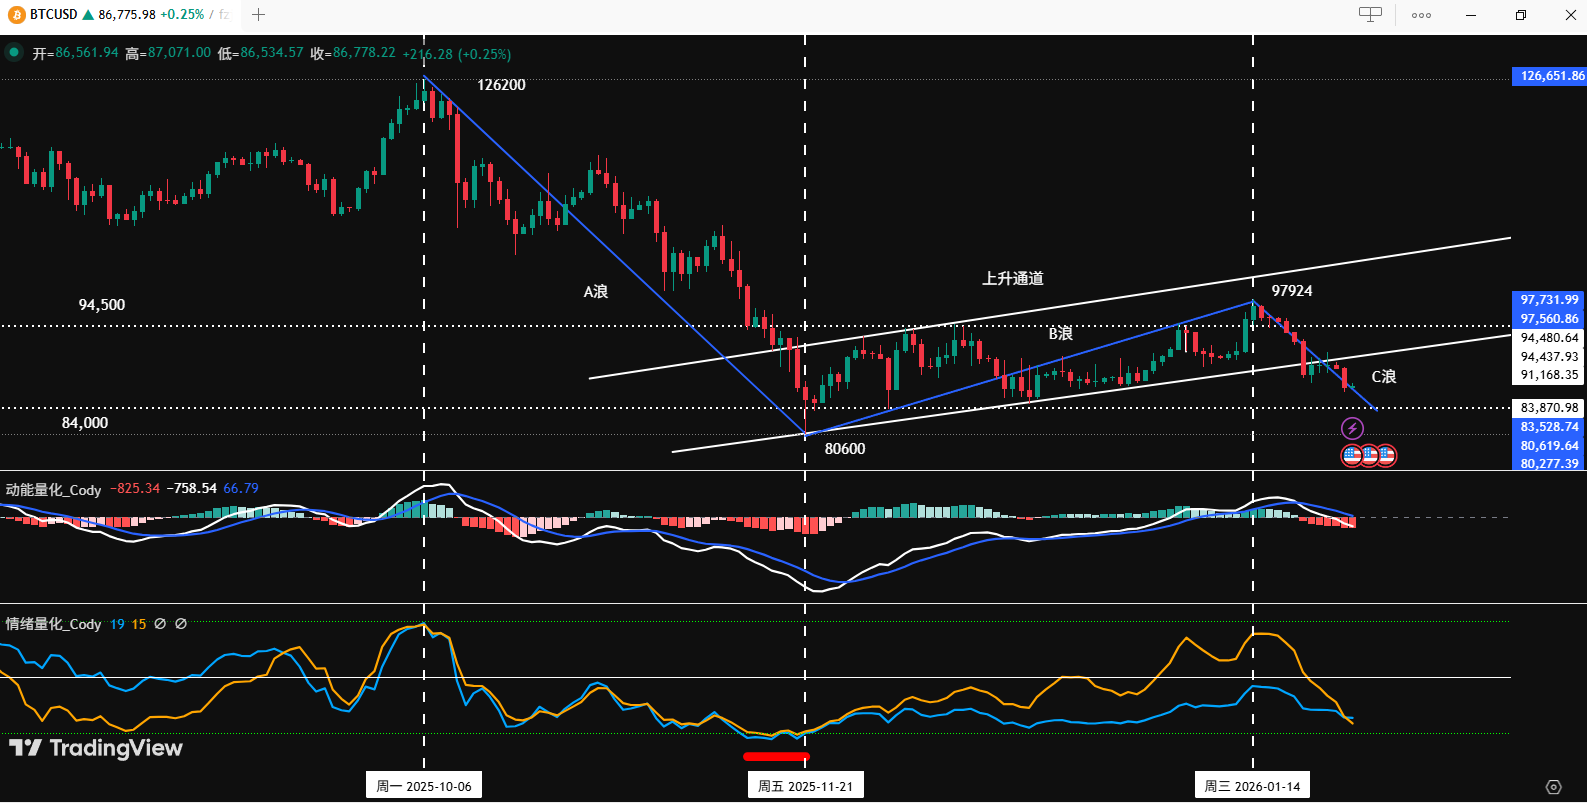
Figure 3

2、As shown in (Figure 3), analysis from the daily chart:

Momentum Quantitative Model: Last week overall presented a "decline-震荡-decline" pattern. After Sunday's盘后, Momentum line 1 has fallen below the zero axis, line 2 is about to fall below the zero axis; Negative energy column is gradually放大.

Momentum Quantitative Model predicts: Daily shorting动能 released, pay attention to the gain and loss of the zero axis.

Sentiment Quantitative Model: After last Sunday's close, blue sentiment line value 19, strength zero; yellow sentiment line value 20, strength zero.

Sentiment Quantitative Model predicts: Pressure and support index: Neutral

The above data提示: Daily level initially shows a bearish pattern, effectiveness还需要确认, pay attention to the bulls and bears' struggle over the zero axis.

四、This Week's Market Prediction: (01.26~02.01)

1、This Week's Core View: Pay attention to the effective confirmation after breaking below the rising channel lower轨.

• If the coin price effectively breaks below the lower轨, then the coin price will accelerate adjustment, the target first looks at the lower edge of the original震荡 box near 84,000 dollars.

• If the coin price effectively stabilizes, then maintain震荡 within the rising channel, but the height is limited.

2、Core Pressure Levels:

• First pressure area: 88,500~91,200 dollar area (previous震荡中枢)

• Second pressure area: 94,500~95,000 dollar area (previous震荡中枢)

• Important pressure area: Near the 21-week moving average

3、Core Support Levels:

• First support level: 86,000~86,500 dollar area (previous筹码密集成交区)

• Second support level: Near 84,000 dollars (previous box lower edge)

• Important support level: Near 80,000~80,600 dollars (near last November's low)

五、This Week's Operation Strategy (Excluding Sudden News Impact): (01.26~02.01)

1、Mid-line strategy: If it effectively breaks below the rising channel lower轨, can choose to establish a 60% short position.

2、Short-term strategy: Use 30% position, set stop loss points, based on support and pressure levels, look for "spread" opportunities. (Using 30 minutes as the operation cycle).

3、In operation, focus on the gain and loss of the rising channel lower轨. To dynamically respond to market evolution and combine real-time model signals, we formulated A/B two sets of short-term operation plans,:

Plan A: If the coin price breaks below the rising channel lower轨:

• Open position: After effective break and combined with model top signals, can establish a 30% short position.

• Risk control: Short initial stop loss set at about 1.5% above the cost price(i.e., 1.015*cost price).

• Close position: When it falls to near important support levels and combined with model signals, can gradually清仓获利了结.

Plan B: If the coin price stabilizes back above the rising channel lower轨: (Sell on resistance)

• Open position: When反弹 to important pressure levels or the channel upper轨 and encounter resistance signals, combined with model top signals, can establish a 30% short position.

• Risk control: Short initial stop loss set at about 1.5% above the cost price(i.e., 1.015*cost price).

• Close position: When it falls to the channel lower轨 or support levels, and combined with model signals, can gradually清仓获利了结.

六、Special Tips:​​

1、When opening a position: Immediately set the initial stop loss level.

2、When profit reaches 1%: Move the stop loss to the opening cost price (break-even point), ensuring principal safety.

3、When profit reaches 2%​​: Move the stop loss to the position of 1% profit.

4、Continuous tracking: Thereafter, for every additional 1% profit the coin price makes, the stop loss level moves同步 1%, dynamically protecting and locking in profits.


Criptos en tendencia

Preguntas relacionadas

QWhat are the two possible future paths for Bitcoin's price movement according to the analyst's technical analysis?

A1. If the price stabilizes and stands firm above the lower rail of the ascending channel, the B-wave rebound is expected to continue, testing resistance near $94,500 and then the 21-week moving average. 2. If the price effectively breaks below the lower rail of the ascending channel and the momentum model's daily line breaks below the zero axis, it would declare a return to a daily-level bear market, indicating the B-wave rebound may have ended and the C-wave adjustment could continue, significantly increasing the possibility of the price falling below $80,600.

QWhat was the result of the strategy execution for the short-term trade mentioned in the article?

AThe strategy executed one short-term trade (with 1x leverage) strictly following the established plan, successfully achieving a return of 3.76%.

QWhat are the key support levels identified for Bitcoin in the upcoming week (01.26~02.01)?

AThe key support levels are: First support at the $86,000~$86,500 area (previous筹码密集成交区), second support near $84,000 (the lower edge of the previous trading range), and important support near $80,000~$80,600 (near the November low).

QHow does the analyst describe the current adjustment structure of Bitcoin since October 2025?

AThe analyst describes the current adjustment since October 2025 as a typical three-wave structure: an A-wave decline from $126,200 to $80,600, a B-wave rebound from $80,600 to $97,924, and the current C-wave adjustment starting from $97,924. The strength of the C-wave will be judged by whether the price holds or breaks the lower rail of the ascending channel.

QWhat risk management rules are specifically highlighted for trades in the 'Special Tips' section?

AThe risk management rules are: 1. Set an initial stop-loss immediately upon opening a position. 2. Move the stop-loss to the breakeven point (entry price) when profit reaches 1% to ensure capital safety. 3. Move the stop-loss to a level securing 1% profit when the profit reaches 2%. 4. Continuously track and move the stop-loss up by 1% for every additional 1% profit gained to dynamically protect and lock in profits.

Lecturas Relacionadas

After Three Consecutive Quarters of Decline, Can the Crypto Market Find a Window for Stabilization in Q3?

The cryptocurrency market has just concluded its worst-performing quarter since 2022, with total capitalization dropping 12.6% to $2.1 trillion. All core metrics indicate capital is leaving the sector, not just rotating within it. Bitcoin fell 14.2% and Ethereum dropped 25.4% in Q2, breaking their previous correlation with US tech stocks. A key driver is the reversal in US spot Bitcoin ETF flows, which saw a net outflow of approximately $4.67 billion in Q2, including a record monthly outflow near $4.5 billion in June. While recent data suggests long-term holders are accumulating again, sustained ETF outflows mean continued selling pressure. Market focus is now singularly on the Federal Reserve. The upcoming July FOMC meeting is seen as the most critical event for Q3. A dovish signal could support Bitcoin reclaiming a $68,000-$84,000 range, while a hawkish stance might establish a new trading band around $50,000-$56,000. Additionally, regulatory uncertainty persists, with the progress of the crucial *CLARITY Act* stalling in the Senate, reducing its perceived 2026 passage probability to 40-45%. Despite the broad downturn, a few sectors showed growth. Prediction markets saw nominal volume surge 48.7% year-over-year to $113.8 billion, and tokenized collectibles transaction volume rose 143% quarterly to $1.4 billion. The Real-World Asset (RWA) tokenization sector also continued steady growth, now representing ~$28.1 billion in on-chain value. The market's foundation for an extreme crash appears limited, with Bitcoin price hovering near its 200-week moving average. However, the trading paradigm has shifted from narrative-driven speculation to decisions based on price action, policy developments, and interest rate expectations, making a broad sentiment-driven rally unlikely in the near term.

marsbitHace 9 hora(s)

After Three Consecutive Quarters of Decline, Can the Crypto Market Find a Window for Stabilization in Q3?

marsbitHace 9 hora(s)

BIT Trading Moment: BTC Still Suppressed by Weekly 200 EMA, Rejection May Restart Decline; Storage and Semiconductors that Surged Last Night Begin Falling in Evening Trading

**Crypto & Stock Market Wrap: Bitcoin Tests Resistance, Stocks Retreat After AI Surge** Bitcoin consolidates around $66,000, facing key resistance near $68,000—an area seen as a major psychological and technical hurdle where previous rallies have failed. Analysts note the cryptocurrency is caught between its 200-week moving average (~$63,333) and 200-week EMA (~$68,328). A clear break above $68k is needed to signal a stronger bullish trend, while a rejection could lead to a retest of $63k support. Market sentiment remains cautious, with low futures open interest pointing to a low-liquidity rebound rather than a full bull market. Bitcoin spot ETFs saw another $203 million inflow. US stock futures pointed lower after a strong Tuesday session led by a massive rebound in semiconductors and memory stocks. The rally was fueled by renewed optimism about AI-driven hardware demand, with Micron, SanDisk, and SK Hynix surging. However, those gains reversed in pre-market trading. Super Micro Computer (SMCI) soared over 20% after hours on strong guidance and a record backlog. Other standouts included Rocket Lab and nuclear energy plays Oklo and X-Energy. Rising oil prices (Brent above $91) and climbing Treasury yields (10-year near 4.64%), however, are reigniting inflation concerns and acting as a headwind for equities. In Asia, markets were mixed. South Korea's KOSPI pared early gains to close slightly higher as semiconductor stocks like SK Hynix gave back initial surges. Japan's Nikkei edged lower as the yen hit a fresh 38-year low against the dollar, raising fears of potential market intervention. Key events to watch include the Samsung Galaxy launch, AMD's AI event, and a slew of major tech earnings from Alphabet, Tesla, and IBM after the close on Wednesday, followed by the ECB meeting and Intel's earnings on Thursday.

marsbitHace 10 hora(s)

BIT Trading Moment: BTC Still Suppressed by Weekly 200 EMA, Rejection May Restart Decline; Storage and Semiconductors that Surged Last Night Begin Falling in Evening Trading

marsbitHace 10 hora(s)

Former CFTC Chairman, Circle President Tarbert: Preaching Long-Termism While Cashing Out $30 Million Himself

Former CFTC Chairman and Circle President Heath Tarbert has consistently advocated for a long-term vision in public, urging patience from investors as Circle’s stock price has fallen significantly from its peak. However, it has been revealed that since Circle’s IPO, Tarbert has continuously sold his CRCL shares through pre-arranged trading plans, cashing out approximately $30 million, without making any public market purchases. This contrast between his public messaging and personal actions has drawn criticism. Tarbert joined Circle in July 2023 as Chief Legal Officer, leveraging his regulatory experience to help guide the company through its IPO and expansion. Despite promoting stablecoins as long-term infrastructure, he established a 10b5-1 trading plan just before Circle went public, leading to substantial stock sales over the following year. In March 2026, he initiated another plan to sell more shares. His career trajectory highlights a pattern of moving between high-level regulatory roles and influential positions in the financial sector. After resigning as CFTC Chairman in early 2021, he joined Citadel Securities as Chief Legal Officer just 27 days later, during a period of intense regulatory scrutiny for the firm. He later joined Circle, aiding its efforts to navigate regulatory challenges for its public listing. While Tarbert's expertise in policy and compliance is valuable to companies like Circle, his actions—advocating long-term confidence while personally divesting—raise questions about the alignment between his public statements and his private financial decisions, leaving investors who followed his advice to bear the market risks.

marsbitHace 10 hora(s)

Former CFTC Chairman, Circle President Tarbert: Preaching Long-Termism While Cashing Out $30 Million Himself

marsbitHace 10 hora(s)

Gate Research Institute: The 'Wall Street-ization' Wave of Crypto Financial Products – Competition or Integration?

The article titled "Gate Research Institute: Are Crypto Financial Products Sparking a 'Wall Street' Wave—Competition or Convergence?" explores the evolving relationship between the crypto ecosystem and traditional finance (TradFi). The piece begins by reflecting on Bitcoin's original 2009 vision of decentralization, disintermediation, and moving away from banks. It then contrasts this with the 2024 landscape, where key crypto assets like Bitcoin are increasingly held through Wall Street products like ETFs issued by giants like BlackRock. The article questions whether this signifies that TradFi is systematically taking over the rights to issue, price, custody, and distribute crypto financial assets. The core argument is that this is not a zero-sum takeover but rather a bidirectional convergence where each side addresses the other's weaknesses. Crypto offers 24/7 global markets, programmable settlement, and open access but lacks compliant channels, institutional-grade custody, deep fiat liquidity, and mainstream distribution. TradFi possesses these but is constrained by legacy systems, limited operating hours, and slow settlement. Two primary convergence paths are highlighted: * **Path A (CEX to TradFi):** Exemplified by Gate, which has progressed from offering tokenized stocks and CFDs to providing direct, real stock trading (US, Hong Kong, South Korea) within its platform, using USDT. * **Path B (TradFi to Crypto):** Exemplified by Robinhood, which has integrated crypto trading, acquired exchanges like Bitstamp, and is moving traditional assets like stocks onto the blockchain via tokenization and its own Layer 2. Both paths are ultimately competing to become the next-generation, unified financial account—a "super account" where users can seamlessly trade cryptocurrencies, stocks, ETFs, RWA (Real World Assets), and tokenized treasury products in one interface. The growth of RWA and tokenized treasuries (e.g., BlackRock's BUIDL) is presented as the asset-layer fusion, providing stable, yield-bearing assets on-chain and acting as a bridge between the two worlds. In conclusion, the "Wall Street-ization" of crypto is framed as a mutual transformation. Decentralized ideals persist in the protocol layer, while at the application layer, a more efficient, global, and accessible unified capital market is emerging from this convergence. The future competition lies not between crypto exchanges and stockbrokers, but between platforms vying to offer the most comprehensive asset coverage, liquidity, and user experience within a single account.

marsbitHace 10 hora(s)

Gate Research Institute: The 'Wall Street-ization' Wave of Crypto Financial Products – Competition or Integration?

marsbitHace 10 hora(s)

Trading

Spot

Artículos destacados

Qué es $S$

Entendiendo SPERO: Una Visión General Completa Introducción a SPERO A medida que el panorama de la innovación continúa evolucionando, la aparición de tecnologías web3 y proyectos de criptomonedas juega un papel fundamental en la configuración del futuro digital. Un proyecto que ha atraído la atención en este campo dinámico es SPERO, denotado como SPERO,$$s$. Este artículo tiene como objetivo reunir y presentar información detallada sobre SPERO, para ayudar a entusiastas e inversores a comprender sus fundamentos, objetivos e innovaciones dentro de los dominios web3 y cripto. ¿Qué es SPERO,$$s$? SPERO,$$s$ es un proyecto único dentro del espacio cripto que busca aprovechar los principios de descentralización y tecnología blockchain para crear un ecosistema que promueva la participación, la utilidad y la inclusión financiera. El proyecto está diseñado para facilitar interacciones de igual a igual de nuevas maneras, proporcionando a los usuarios soluciones y servicios financieros innovadores. En su esencia, SPERO,$$s$ tiene como objetivo empoderar a los individuos al proporcionar herramientas y plataformas que mejoren la experiencia del usuario en el espacio de las criptomonedas. Esto incluye habilitar métodos de transacción más flexibles, fomentar iniciativas impulsadas por la comunidad y crear caminos para oportunidades financieras a través de aplicaciones descentralizadas (dApps). La visión subyacente de SPERO,$$s$ gira en torno a la inclusividad, buscando cerrar brechas dentro de las finanzas tradicionales mientras aprovecha los beneficios de la tecnología blockchain. ¿Quién es el Creador de SPERO,$$s$? La identidad del creador de SPERO,$$s$ sigue siendo algo oscura, ya que hay recursos públicos limitados que proporcionan información de fondo detallada sobre su(s) fundador(es). Esta falta de transparencia puede derivarse del compromiso del proyecto con la descentralización, una ética que muchos proyectos web3 comparten, priorizando las contribuciones colectivas sobre el reconocimiento individual. Al centrar las discusiones en torno a la comunidad y sus objetivos colectivos, SPERO,$$s$ encarna la esencia del empoderamiento sin señalar a individuos específicos. Como tal, comprender la ética y la misión de SPERO sigue siendo más importante que identificar a un creador singular. ¿Quiénes son los Inversores de SPERO,$$s$? SPERO,$$s$ cuenta con el apoyo de una diversa gama de inversores que van desde capitalistas de riesgo hasta inversores ángeles dedicados a fomentar la innovación en el sector cripto. El enfoque de estos inversores generalmente se alinea con la misión de SPERO, priorizando proyectos que prometen avances tecnológicos sociales, inclusión financiera y gobernanza descentralizada. Estas fundaciones de inversores suelen estar interesadas en proyectos que no solo ofrecen productos innovadores, sino que también contribuyen positivamente a la comunidad blockchain y sus ecosistemas. El respaldo de estos inversores refuerza a SPERO,$$s$ como un contendiente notable en el dominio de proyectos cripto que evoluciona rápidamente. ¿Cómo Funciona SPERO,$$s$? SPERO,$$s$ emplea un marco multifacético que lo distingue de los proyectos de criptomonedas convencionales. Aquí hay algunas de las características clave que subrayan su singularidad e innovación: Gobernanza Descentralizada: SPERO,$$s$ integra modelos de gobernanza descentralizada, empoderando a los usuarios para participar activamente en los procesos de toma de decisiones sobre el futuro del proyecto. Este enfoque fomenta un sentido de propiedad y responsabilidad entre los miembros de la comunidad. Utilidad del Token: SPERO,$$s$ utiliza su propio token de criptomoneda, diseñado para servir diversas funciones dentro del ecosistema. Estos tokens permiten transacciones, recompensas y la facilitación de servicios ofrecidos en la plataforma, mejorando la participación y la utilidad general. Arquitectura en Capas: La arquitectura técnica de SPERO,$$s$ apoya la modularidad y escalabilidad, permitiendo la integración fluida de características y aplicaciones adicionales a medida que el proyecto evoluciona. Esta adaptabilidad es fundamental para mantener la relevancia en el cambiante paisaje cripto. Participación de la Comunidad: El proyecto enfatiza iniciativas impulsadas por la comunidad, empleando mecanismos que incentivan la colaboración y la retroalimentación. Al nutrir una comunidad sólida, SPERO,$$s$ puede abordar mejor las necesidades de los usuarios y adaptarse a las tendencias del mercado. Enfoque en la Inclusión: Al ofrecer tarifas de transacción bajas e interfaces amigables para el usuario, SPERO,$$s$ busca atraer a una base de usuarios diversa, incluyendo a individuos que anteriormente pueden no haber participado en el espacio cripto. Este compromiso con la inclusión se alinea con su misión general de empoderamiento a través de la accesibilidad. Cronología de SPERO,$$s$ Entender la historia de un proyecto proporciona información crucial sobre su trayectoria de desarrollo y hitos. A continuación se presenta una cronología sugerida que mapea eventos significativos en la evolución de SPERO,$$s$: Fase de Conceptualización e Ideación: Las ideas iniciales que forman la base de SPERO,$$s$ fueron concebidas, alineándose estrechamente con los principios de descentralización y enfoque comunitario dentro de la industria blockchain. Lanzamiento del Whitepaper del Proyecto: Tras la fase conceptual, se lanzó un whitepaper completo que detalla la visión, los objetivos y la infraestructura tecnológica de SPERO,$$s$ para generar interés y retroalimentación de la comunidad. Construcción de Comunidad y Primeras Interacciones: Se realizaron esfuerzos de divulgación activa para construir una comunidad de primeros adoptantes y posibles inversores, facilitando discusiones en torno a los objetivos del proyecto y obteniendo apoyo. Evento de Generación de Tokens: SPERO,$$s$ llevó a cabo un evento de generación de tokens (TGE) para distribuir sus tokens nativos a los primeros seguidores y establecer liquidez inicial dentro del ecosistema. Lanzamiento de la dApp Inicial: La primera aplicación descentralizada (dApp) asociada con SPERO,$$s$ se puso en marcha, permitiendo a los usuarios interactuar con las funcionalidades centrales de la plataforma. Desarrollo Continuo y Alianzas: Actualizaciones y mejoras continuas a las ofertas del proyecto, incluyendo alianzas estratégicas con otros actores en el espacio blockchain, han moldeado a SPERO,$$s$ en un jugador competitivo y en evolución en el mercado cripto. Conclusión SPERO,$$s$ se erige como un testimonio del potencial de web3 y las criptomonedas para revolucionar los sistemas financieros y empoderar a los individuos. Con un compromiso con la gobernanza descentralizada, la participación comunitaria y funcionalidades diseñadas de manera innovadora, allana el camino hacia un paisaje financiero más inclusivo. Como con cualquier inversión en el espacio cripto que evoluciona rápidamente, se anima a los posibles inversores y usuarios a investigar a fondo y participar de manera reflexiva con los desarrollos en curso dentro de SPERO,$$s$. El proyecto muestra el espíritu innovador de la industria cripto, invitando a una mayor exploración de sus innumerables posibilidades. Mientras el viaje de SPERO,$$s$ aún se desarrolla, sus principios fundamentales pueden, de hecho, influir en el futuro de cómo interactuamos con la tecnología, las finanzas y entre nosotros en ecosistemas digitales interconectados.

150 Vistas totalesPublicado en 2024.12.17Actualizado en 2024.12.17

Qué es $S$

Qué es AGENT S

Agent S: El Futuro de la Interacción Autónoma en Web3 Introducción En el paisaje en constante evolución de Web3 y las criptomonedas, las innovaciones están redefiniendo constantemente cómo los individuos interactúan con las plataformas digitales. Uno de estos proyectos pioneros, Agent S, promete revolucionar la interacción humano-computadora a través de su marco agente abierto. Al allanar el camino para interacciones autónomas, Agent S busca simplificar tareas complejas, ofreciendo aplicaciones transformadoras en inteligencia artificial (IA). Esta exploración detallada profundizará en las complejidades del proyecto, sus características únicas y las implicaciones para el dominio de las criptomonedas. ¿Qué es Agent S? Agent S se presenta como un marco agente abierto innovador, diseñado específicamente para abordar tres desafíos fundamentales en la automatización de tareas informáticas: Adquisición de Conocimiento Específico del Dominio: El marco aprende inteligentemente de diversas fuentes de conocimiento externas y experiencias internas. Este enfoque dual le permite construir un rico repositorio de conocimiento específico del dominio, mejorando su rendimiento en la ejecución de tareas. Planificación a Largo Plazo de Tareas: Agent S emplea planificación jerárquica aumentada por la experiencia, un enfoque estratégico que facilita la descomposición y ejecución eficiente de tareas complejas. Esta característica mejora significativamente su capacidad para gestionar múltiples subtareas de manera eficiente y efectiva. Manejo de Interfaces Dinámicas y No Uniformes: El proyecto introduce la Interfaz Agente-Computadora (ACI), una solución innovadora que mejora la interacción entre agentes y usuarios. Utilizando Modelos de Lenguaje Multimodal de Gran Escala (MLLMs), Agent S puede navegar y manipular diversas interfaces gráficas de usuario sin problemas. A través de estas características pioneras, Agent S proporciona un marco robusto que aborda las complejidades involucradas en la automatización de la interacción humana con las máquinas, preparando el terreno para una multitud de aplicaciones en IA y más allá. ¿Quién es el Creador de Agent S? Si bien el concepto de Agent S es fundamentalmente innovador, la información específica sobre su creador sigue siendo elusiva. El creador es actualmente desconocido, lo que resalta ya sea la etapa incipiente del proyecto o la elección estratégica de mantener a los miembros fundadores en el anonimato. Independientemente de la anonimidad, el enfoque sigue siendo en las capacidades y el potencial del marco. ¿Quiénes son los Inversores de Agent S? Dado que Agent S es relativamente nuevo en el ecosistema criptográfico, la información detallada sobre sus inversores y patrocinadores financieros no está documentada explícitamente. La falta de información disponible públicamente sobre las bases de inversión u organizaciones que apoyan el proyecto plantea preguntas sobre su estructura de financiamiento y hoja de ruta de desarrollo. Comprender el respaldo es crucial para evaluar la sostenibilidad del proyecto y su posible impacto en el mercado. ¿Cómo Funciona Agent S? En el núcleo de Agent S se encuentra una tecnología de vanguardia que le permite funcionar de manera efectiva en diversos entornos. Su modelo operativo se basa en varias características clave: Interacción Humano-Computadora Similar a la Humana: El marco ofrece planificación avanzada de IA, esforzándose por hacer que las interacciones con las computadoras sean más intuitivas. Al imitar el comportamiento humano en la ejecución de tareas, promete elevar las experiencias de los usuarios. Memoria Narrativa: Empleada para aprovechar experiencias de alto nivel, Agent S utiliza memoria narrativa para hacer un seguimiento de las historias de tareas, mejorando así sus procesos de toma de decisiones. Memoria Episódica: Esta característica proporciona a los usuarios una guía paso a paso, permitiendo que el marco ofrezca apoyo contextual a medida que se desarrollan las tareas. Soporte para OpenACI: Con la capacidad de ejecutarse localmente, Agent S permite a los usuarios mantener el control sobre sus interacciones y flujos de trabajo, alineándose con la ética descentralizada de Web3. Fácil Integración con APIs Externas: Su versatilidad y compatibilidad con varias plataformas de IA aseguran que Agent S pueda encajar sin problemas en ecosistemas tecnológicos existentes, convirtiéndolo en una opción atractiva para desarrolladores y organizaciones. Estas funcionalidades contribuyen colectivamente a la posición única de Agent S dentro del espacio cripto, ya que automatiza tareas complejas y de múltiples pasos con una intervención humana mínima. A medida que el proyecto evoluciona, sus posibles aplicaciones en Web3 podrían redefinir cómo se desarrollan las interacciones digitales. Cronología de Agent S El desarrollo y los hitos de Agent S pueden encapsularse en una cronología que resalta sus eventos significativos: 27 de septiembre de 2024: El concepto de Agent S fue lanzado en un documento de investigación integral titulado “Un Marco Agente Abierto que Usa Computadoras Como un Humano”, mostrando las bases del proyecto. 10 de octubre de 2024: El documento de investigación fue puesto a disposición del público en arXiv, ofreciendo una exploración profunda del marco y su evaluación de rendimiento basada en el benchmark OSWorld. 12 de octubre de 2024: Se lanzó una presentación en video, proporcionando una visión visual de las capacidades y características de Agent S, involucrando aún más a posibles usuarios e inversores. Estos marcadores en la cronología no solo ilustran el progreso de Agent S, sino que también indican su compromiso con la transparencia y la participación comunitaria. Puntos Clave Sobre Agent S A medida que el marco Agent S continúa evolucionando, varios atributos clave destacan, subrayando su naturaleza innovadora y potencial: Marco Innovador: Diseñado para proporcionar un uso intuitivo de las computadoras similar a la interacción humana, Agent S aporta un enfoque novedoso a la automatización de tareas. Interacción Autónoma: La capacidad de interactuar de manera autónoma con las computadoras a través de GUI significa un salto hacia soluciones informáticas más inteligentes y eficientes. Automatización de Tareas Complejas: Con su metodología robusta, puede automatizar tareas complejas y de múltiples pasos, haciendo que los procesos sean más rápidos y menos propensos a errores. Mejora Continua: Los mecanismos de aprendizaje permiten a Agent S mejorar a partir de experiencias pasadas, mejorando continuamente su rendimiento y eficacia. Versatilidad: Su adaptabilidad en diferentes entornos operativos como OSWorld y WindowsAgentArena asegura que pueda servir a una amplia gama de aplicaciones. A medida que Agent S se posiciona en el paisaje de Web3 y criptomonedas, su potencial para mejorar las capacidades de interacción y automatizar procesos significa un avance significativo en las tecnologías de IA. A través de su marco innovador, Agent S ejemplifica el futuro de las interacciones digitales, prometiendo una experiencia más fluida y eficiente para los usuarios en diversas industrias. Conclusión Agent S representa un audaz avance en la unión de la IA y Web3, con la capacidad de redefinir cómo interactuamos con la tecnología. Aunque aún se encuentra en sus primeras etapas, las posibilidades para su aplicación son vastas y atractivas. A través de su marco integral que aborda desafíos críticos, Agent S busca llevar las interacciones autónomas al primer plano de la experiencia digital. A medida que nos adentramos más en los reinos de las criptomonedas y la descentralización, proyectos como Agent S sin duda desempeñarán un papel crucial en la configuración del futuro de la tecnología y la colaboración humano-computadora.

561 Vistas totalesPublicado en 2025.01.14Actualizado en 2025.01.14

Qué es AGENT S

Cómo comprar S

¡Bienvenido a HTX.com! Hemos hecho que comprar Sonic (S) sea simple y conveniente. Sigue nuestra guía paso a paso para iniciar tu viaje de criptos.Paso 1: crea tu cuenta HTXUtiliza tu correo electrónico o número de teléfono para registrarte y obtener una cuenta gratuita en HTX. Experimenta un proceso de registro sin complicaciones y desbloquea todas las funciones.Obtener mi cuentaPaso 2: ve a Comprar cripto y elige tu método de pagoTarjeta de crédito/débito: usa tu Visa o Mastercard para comprar Sonic (S) al instante.Saldo: utiliza fondos del saldo de tu cuenta HTX para tradear sin problemas.Terceros: hemos agregado métodos de pago populares como Google Pay y Apple Pay para mejorar la comodidad.P2P: tradear directamente con otros usuarios en HTX.Over-the-Counter (OTC): ofrecemos servicios personalizados y tipos de cambio competitivos para los traders.Paso 3: guarda tu Sonic (S)Después de comprar tu Sonic (S), guárdalo en tu cuenta HTX. Alternativamente, puedes enviarlo a otro lugar mediante transferencia blockchain o utilizarlo para tradear otras criptomonedas.Paso 4: tradear Sonic (S)Tradear fácilmente con Sonic (S) en HTX's mercado spot. Simplemente accede a tu cuenta, selecciona tu par de trading, ejecuta tus trades y monitorea en tiempo real. Ofrecemos una experiencia fácil de usar tanto para principiantes como para traders experimentados.

1.1k Vistas totalesPublicado en 2025.01.15Actualizado en 2026.06.02

Cómo comprar S

Discusiones

Bienvenido a la comunidad de HTX. Aquí puedes mantenerte informado sobre los últimos desarrollos de la plataforma y acceder a análisis profesionales del mercado. A continuación se presentan las opiniones de los usuarios sobre el precio de S (S).

活动图片













