Bitcoin Reaches $80,000: Three Arguments Against a Bull Market

cryptonews.ruPublicado a 2026-08-24Actualizado a 2026-08-24

Resumen

Bitcoin reached $80,000 on August 24, 2026, a 38% rise from its July low of $57,800. While this surge is notable, analyst Rekt Capital presents three arguments against it signaling a true bull market reversal, suggesting it may instead be a rally within a broader bear market. First, if July 2026 was the bear market bottom, its formation time was 27% shorter than historical averages, a conclusion only valid if no new lower low forms by year-end. Second, Bitcoin broke down from a macro triangle pattern in July, but the subsequent ~30% drop was significantly smaller than the 48-62% declines seen after similar breakdowns in past cycles. Third, and crucially, the price has failed to break the long-term descending trendline from early 2025 highs, meaning Bitcoin is still making lower highs on macro timeframes, indicating underlying weakness. Rekt Capital notes the dynamic trendline resistance is near $79,000 this month, dropping to ~$76,300 next month. A monthly close below it could open the door for a correction. On weekly charts, resistance sits at $74.5k-$83.5k, with support at $62.5k-$68.5k. Adding another perspective, Crypto Rover highlights two key liquidation levels on Bitcoin's heatmap: a cluster of short positions at $80k-$90k (which could fuel a squeeze higher) and a concentration of long positions at $48k-$60k, acting as competing price "magnets." The article contrasts Rekt Capital's current cautious stance with his past calls in 2025, noting he correctly identified ...

On August 24, Bitcoin reached the $80,000 mark, showing a 38% increase compared to the July 1, 2026 low of $57,800. Analysts disagree on what is behind this movement—the beginning of a new bullish cycle or another bounce within a bear market.
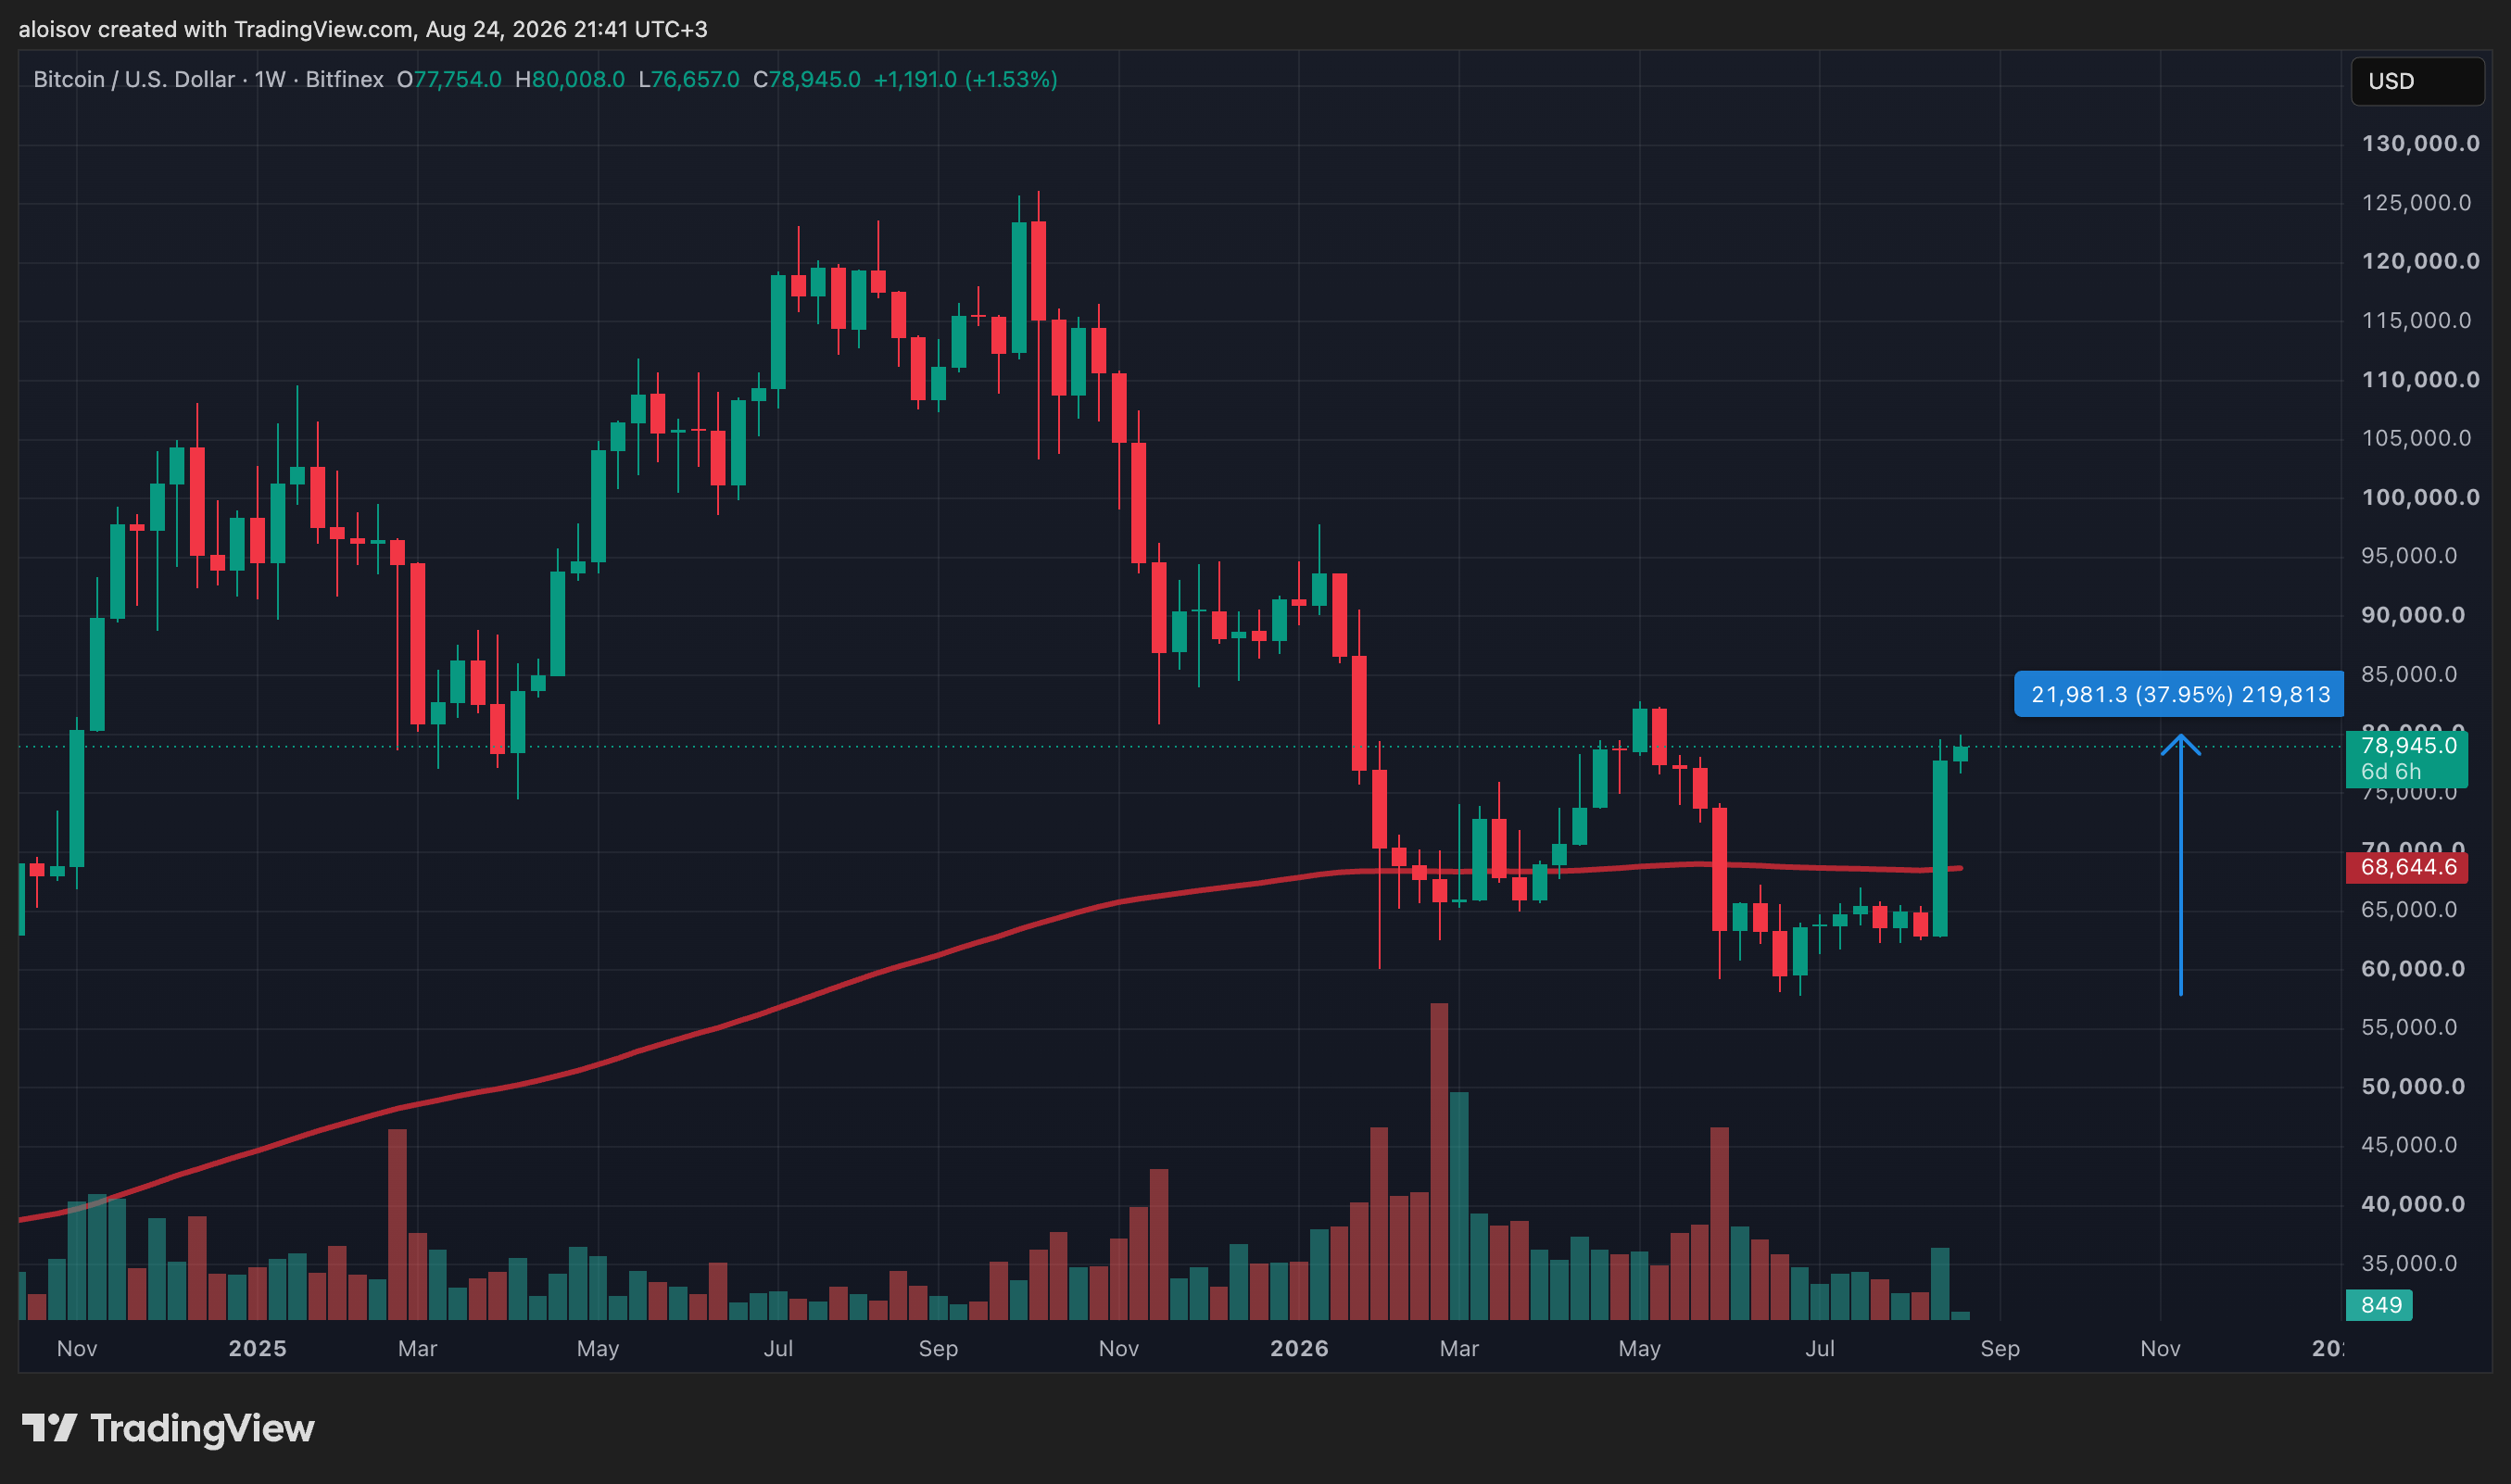
1-week chart of $BTC/USD and 200EMA. Source: Bitfinex

Bull Market or a Trap?

Analyst Rekt Capital noted in his newsletter that Bitcoin is moving contrary to historical patterns. According to his observations, August has traditionally been a "red" month in bear markets, along with September, so the probability of a decline during this period was usually much higher than the "green" August currently observed.
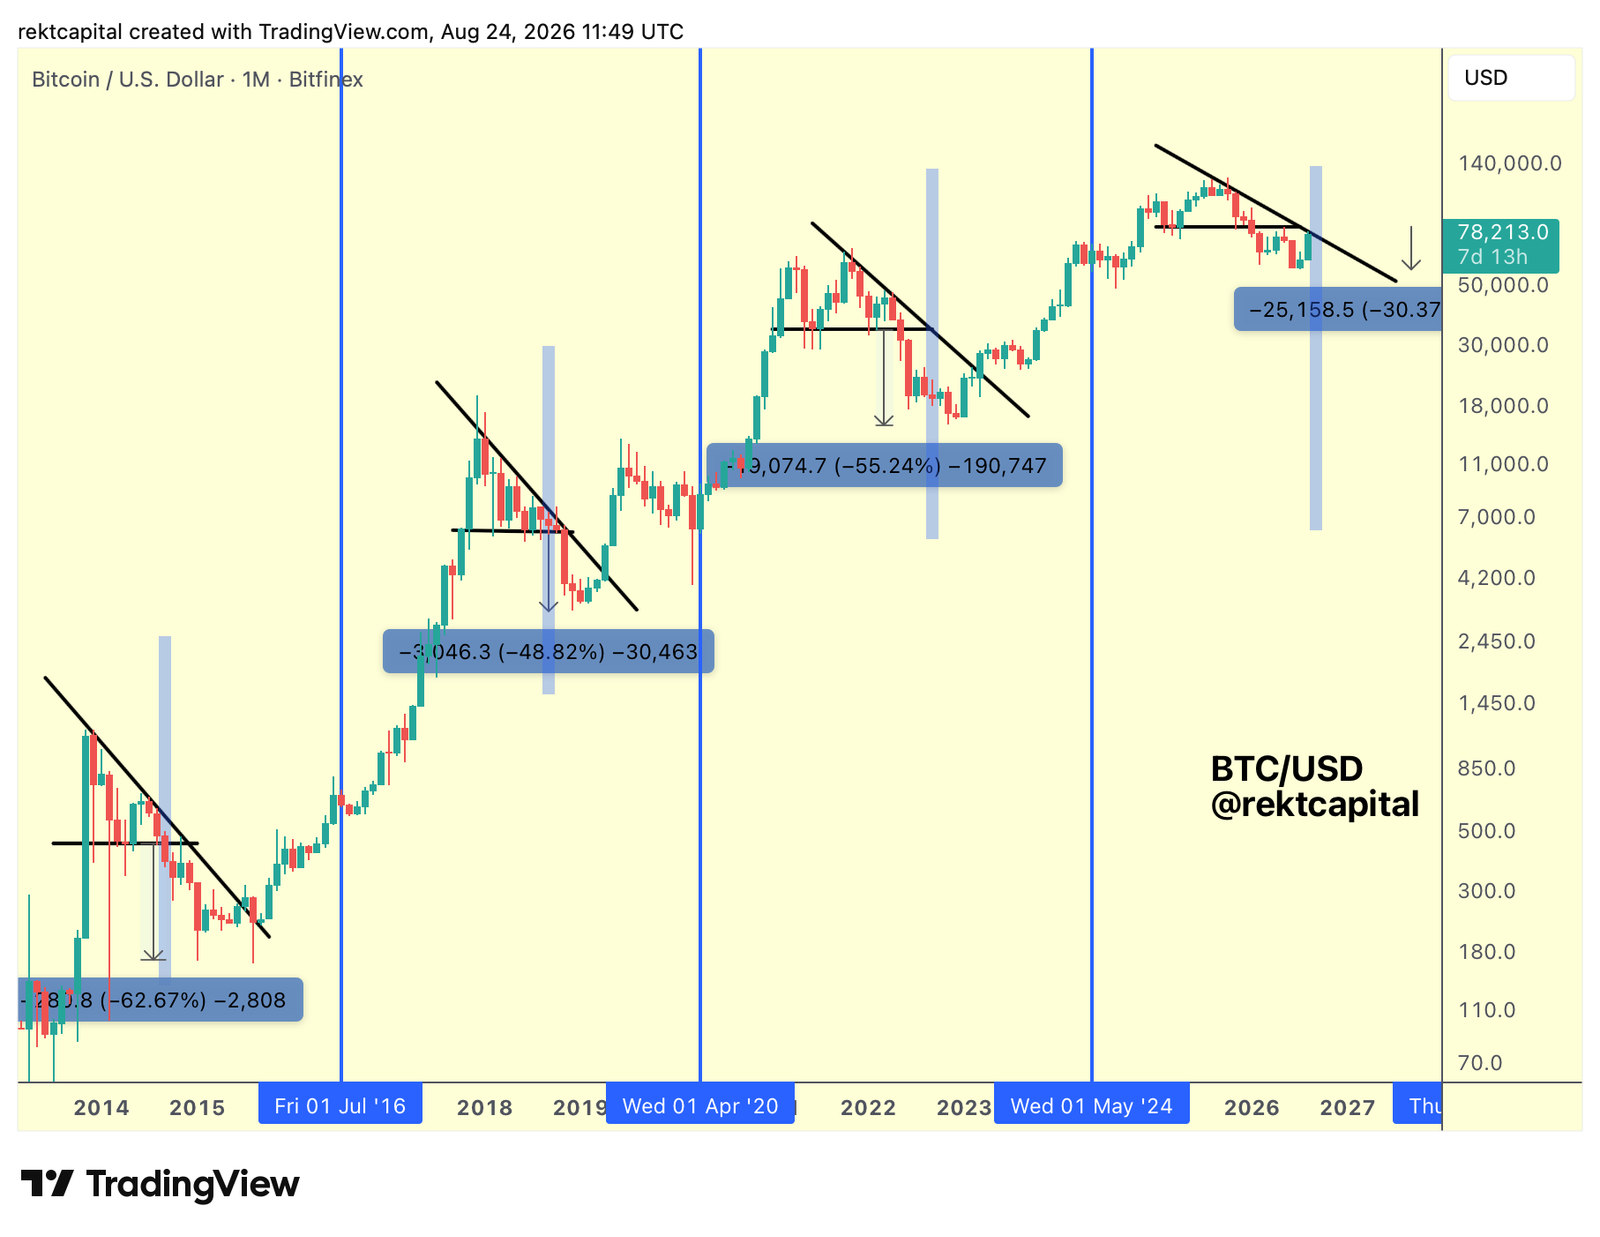
1-month chart of $BTC/USD. Analysis: Rekt Capital

Nevertheless, the analyst points out that the current reversal could well remain part of a rally within a bear market rather than a full-fledged trend reversal. He presents three arguments:

  1. If the low recorded in July indeed turns out to be the bottom of the bear cycle, then the time taken to form it would be 27% shorter than the average time it took to form a bottom in previous cycles. However, such a conclusion can only be drawn if a new, deeper low is not formed by the end of 2026.

  2. A "macro triangle" has formed on Bitcoin's monthly chart—a pattern where a horizontal support line around $80,000 converges with a descending resistance line. The breakdown of this pattern downwards in July led to the drop to $57,800. In previous cycles—in 2014, 2018, and 2020—breakdowns of similar patterns were accompanied by price drops of 62.67%, 48.82%, and 55.24% respectively. In contrast, the current decline was only 30.37%, which is noticeably less than the historical norm.

  3. Despite the impressive rise, the price has not managed to break through the descending macro trend line originating from the highs of early 2025—meaning that Bitcoin is still technically forming lower highs, indicating weakness on higher timeframes.
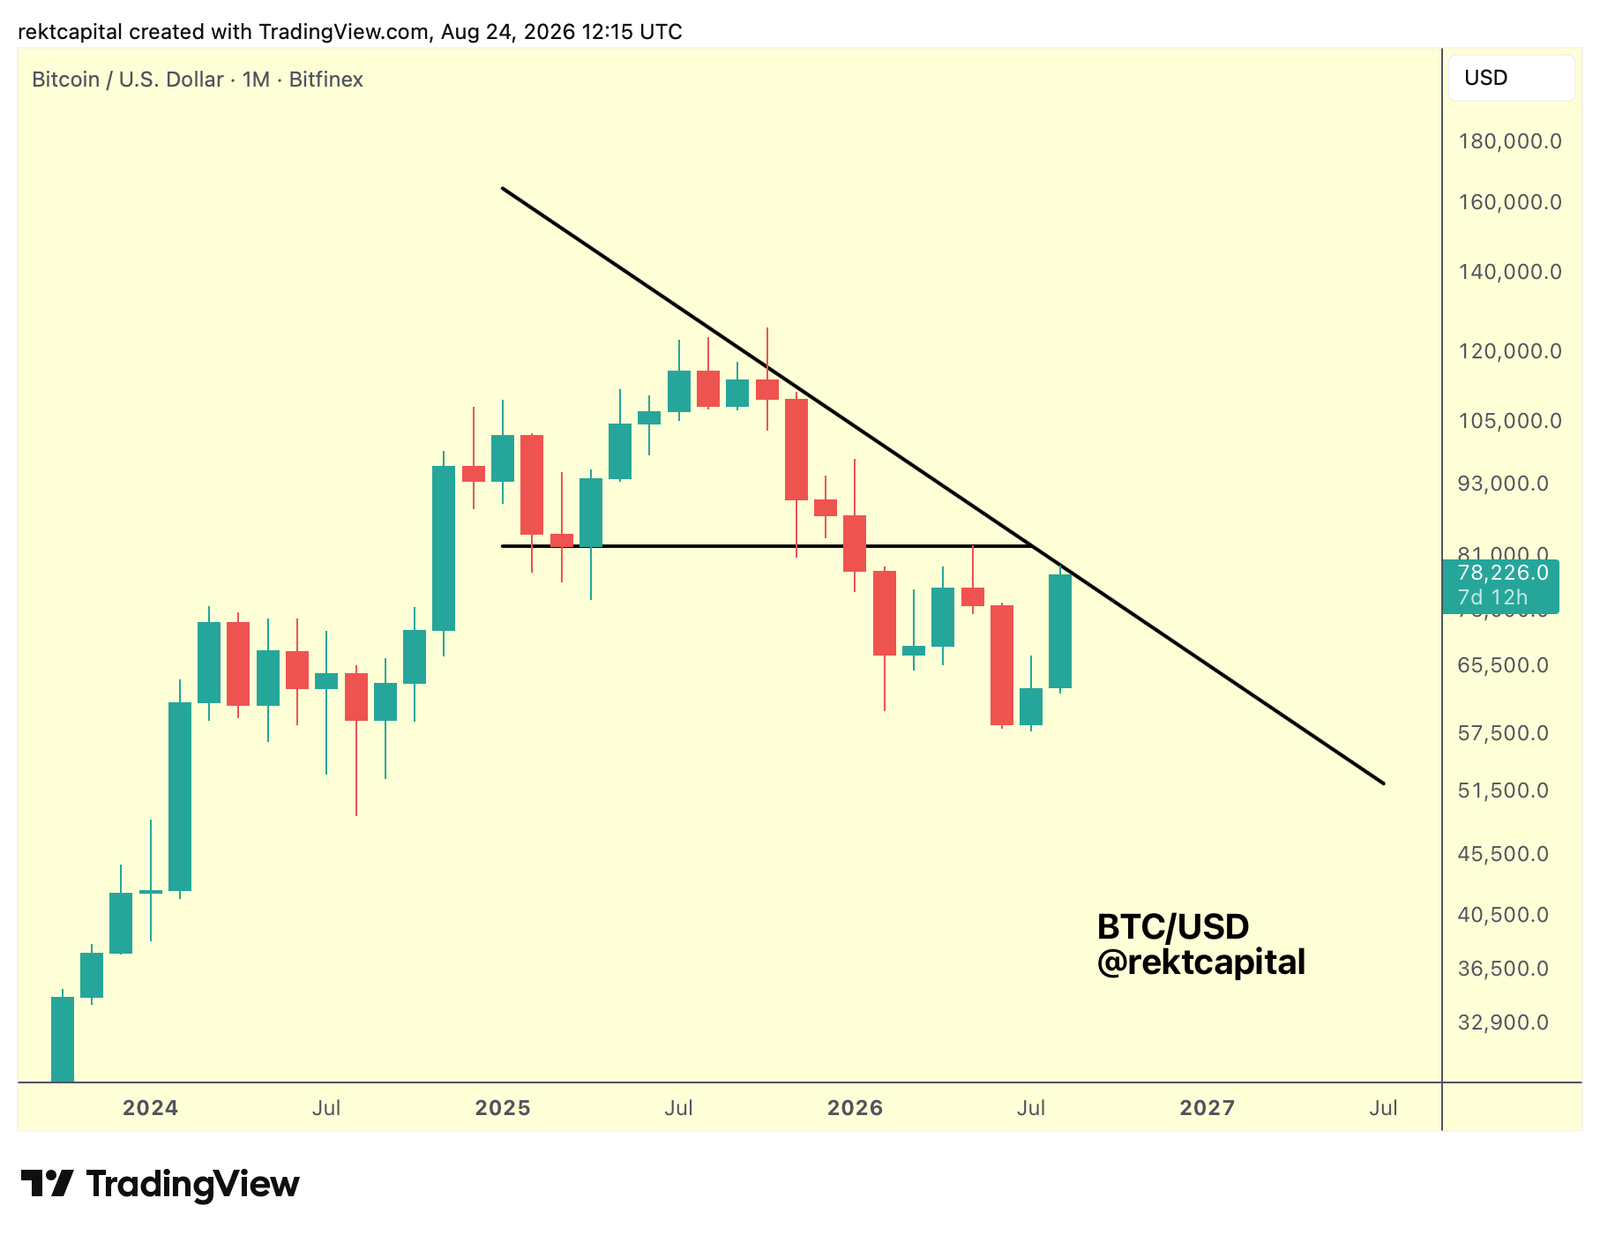
1-month chart of $BTC/USD. Analysis: Rekt Capital

According to the analyst's calculations, the descending trend line this month is around $79,000, and next month it will drop to about $76,300, as it is a dynamic resistance. He believes that closing the month below this line would pave the way for a correction. At the same time, he acknowledges that breaking through the resistance in September might be easier precisely because of its downward shift. However, if the rally does turn out to be temporary, the price is unlikely to hold at the achieved highs for long and will partially retreat.
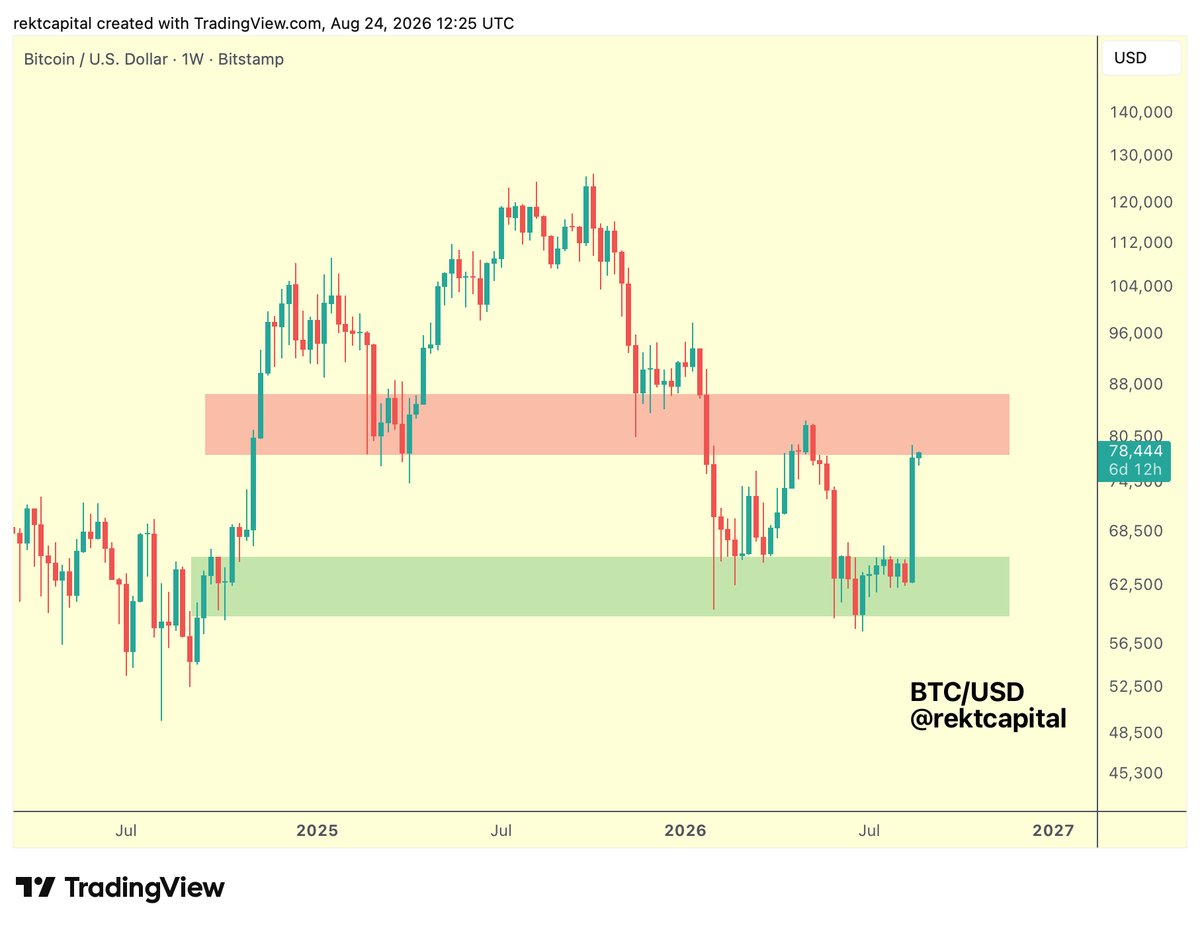
1-week chart of $BTC/USD. Analysis: Rekt Capital

On the weekly chart, the current rally has just met resistance in the area of $74,500 - $83,500, while the nearest support zone is located in the range of $62,500 - $68,500.

Two Levels on the Liquidation Map

Crypto blogger Crypto Rover drew attention to Bitcoin's liquidation map, where two key levels currently stand out. In the range of $80,000 - $90,000, short positions are concentrated, whose liquidation could push the price higher. Meanwhile, in the zone of $48,000 - $60,000, there is a cluster of long positions. The blogger questions which of these levels will be reached first, calling them "two magnets" for the price.
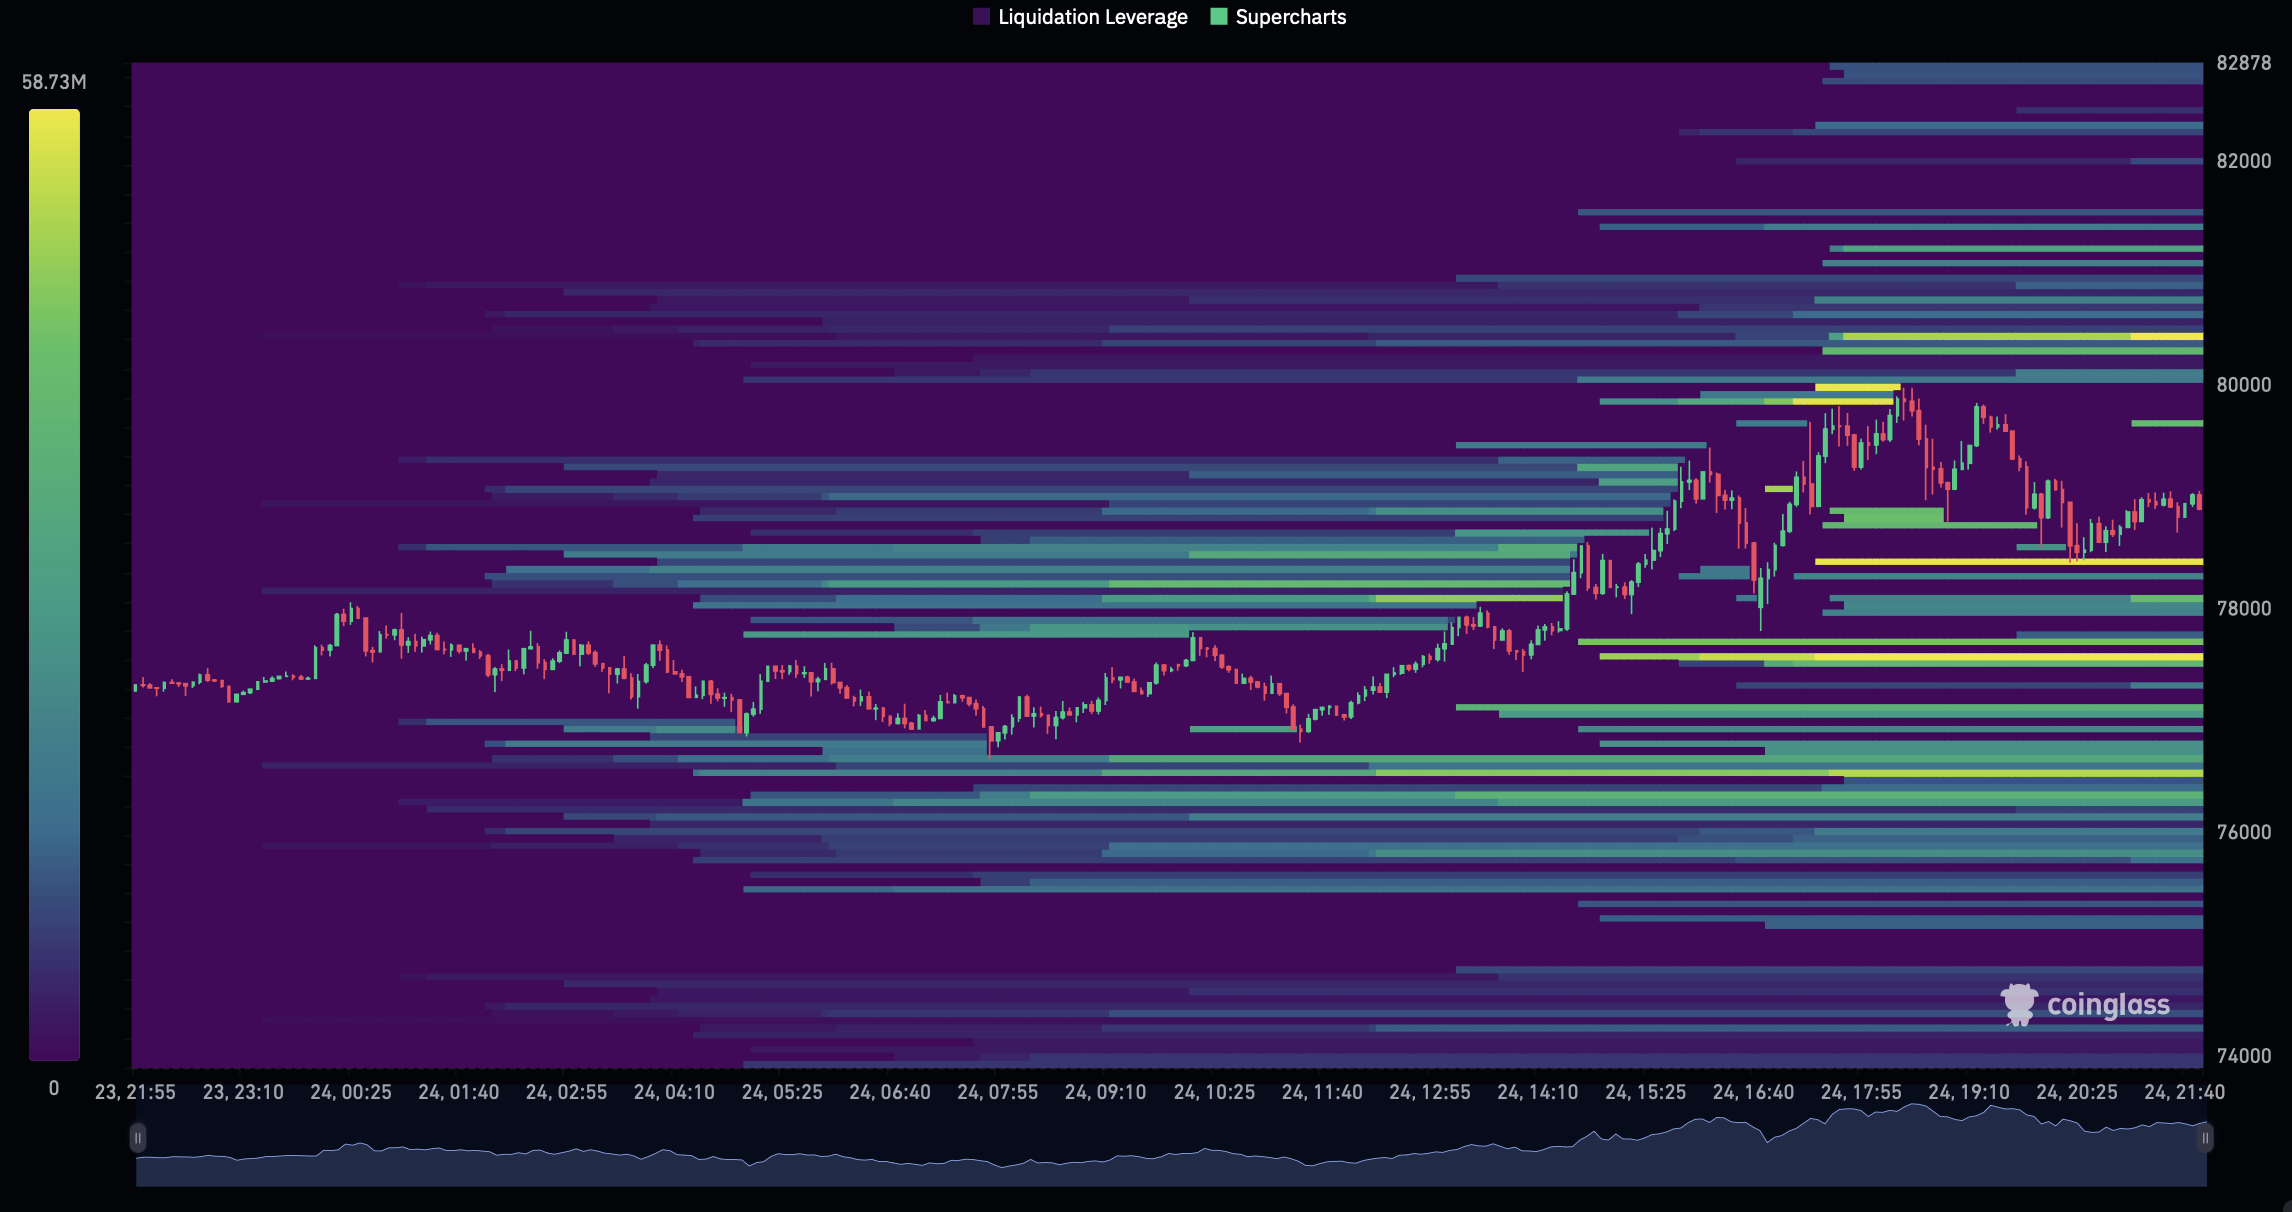
Bitcoin liquidation map. Source: CoinGlass

The AI Opinion

From the perspective of the accuracy of forecasts, it makes sense to compare not one, but several previous signals from Rekt Capital with what happened afterward.

On April 9, 2025, the analyst suggested that the correction following the "tariff crash" of Bitcoin, which dropped the price by 7% on April 3, would end around the $70,000 mark. By May 10, Bitcoin had already consolidated above $100,000 with a new target of $160,000—the bottom indeed turned out to be near the forecast, but the upward reversal was stronger and faster than the RSI signal suggested.

In the fall of 2025, the error shifted to the other side. On November 19, Rekt Capital assessed the 29% drop from the October peak of $126,198 as the most dramatic in the cycle, and by November 21, the correction, according to the site's data, had reached 35%. By the end of the month, the market, judging by the platform's materials, was forming a short-term bottom with a target for a rebound to $100,000–110,000. However, the rally did not hold: by early February 2026, the price had fallen below $73,000, and the drawdown from the peak exceeded 40%—almost double the "most dramatic" drop claimed in November. The subsequent decline to $57,800 by July 2026, mentioned in the current article, brought the total drawdown from the October high to 54%.

In both cases, the analyst correctly indicated the direction of the movement but underestimated its scale: in the spring of 2025—the strength of the recovery; in the fall of 2025—the depth of the decline. In today's article, he again speaks of weakness on higher timeframes, despite the rise to $80,000.

end-content

Preguntas relacionadas

QAccording to the analyst Rekt Capital, what are the three main arguments against the recent Bitcoin price increase signaling a true bull market?

AThe three arguments are: 1. The July low could be a bear market bottom, but its formation time was 27% shorter than historical averages; a definitive conclusion requires no new lower low by end-2026. 2. The breakdown from the 'macro triangle' pattern in July led to a 30.37% drop, which is significantly less than the 48-62% drops seen in similar historical breakouts. 3. The price has failed to break the descending macro trendline from early 2025 highs, meaning Bitcoin is still making lower highs, indicating weakness on higher timeframes.

QWhat key resistance and support zones for Bitcoin are identified on the weekly chart, as per the article?

AOn the weekly chart, the current rally has encountered a resistance zone between $74,500 and $83,500. The nearest support zone is located in the range of $62,500 to $68,500.

QWhat two key price levels are highlighted on the Bitcoin liquidation map by Crypto Rover, and what do they represent?

AThe two key levels are $80,000-$90,000 and $48,000-$60,000. The $80k-$90k zone concentrates short positions, whose liquidation could push the price higher. The $48k-$60k zone concentrates long positions, whose liquidation could drive the price down. They are described as 'two magnets' for the price.

QHow does the article evaluate the accuracy of Rekt Capital's past predictions mentioned in the 'AI Opinion' section?

AThe evaluation states that in both cited cases (April 2025 and November 2025), the analyst correctly identified the direction of the market movement but underestimated its scale. In April 2025, he underestimated the strength of the recovery, and in November 2025, he underestimated the depth of the subsequent decline.

QWhat is the significance of the descending macro trendline mentioned in the analysis, and where is it projected to be in the coming month?

AThe descending macro trendline is a dynamic resistance level that Bitcoin has failed to break. Formally, as long as the price remains below it, Bitcoin is still forming lower highs, indicating bearish weakness on higher timeframes. The analyst calculates that the trendline is around $79,000 in the current month and will drop to approximately $76,300 in the next month.

Lecturas Relacionadas

Is Bitcoin's Recent Surge a Blessing or a Trap?

Bitcoin recently surged from around $63,000 to almost $80,000. According to Glassnode, this rally is not solely due to low liquidity but driven by real capital inflows. Key factors include aggressive spot market buying, increased trading volumes, improved market depth, and significant institutional demand, as evidenced by high volumes and inflows into spot Bitcoin ETFs. Derivatives market data shows investors adopting more aggressive risk management, with strong perpetual futures buying. However, a substantial increase in futures open interest points to heightened speculative activity and leverage use. On-chain metrics support the bullish activity, with growth in active addresses and asset-adjusted transfer volume, indicating accelerated user and economic activity within the network. Investor profitability has also improved significantly, with both unrealized and realized profits rising well above historical averages. This is shifting investor behavior toward profit-taking rather than loss-selling. However, Glassnode cautions that the current market structure is not yet fully based on long-term capital accumulation. It notes that "hot capital," representing short-term, price-sensitive funds, is elevated, while macroeconomic-scale capital inflows remain relatively limited. The rally appears to be supported more by active short-term investors, tactical positioning, and growing speculative appetite than by sustained, long-term accumulation.

cryptonews.ruHace 26 min(s)

Is Bitcoin's Recent Surge a Blessing or a Trap?

cryptonews.ruHace 26 min(s)

Trading

Spot
活动图片