Anchored, But Under Strain

insights.glassnodePublicado a 2025-12-10Actualizado a 2025-12-10

Resumen

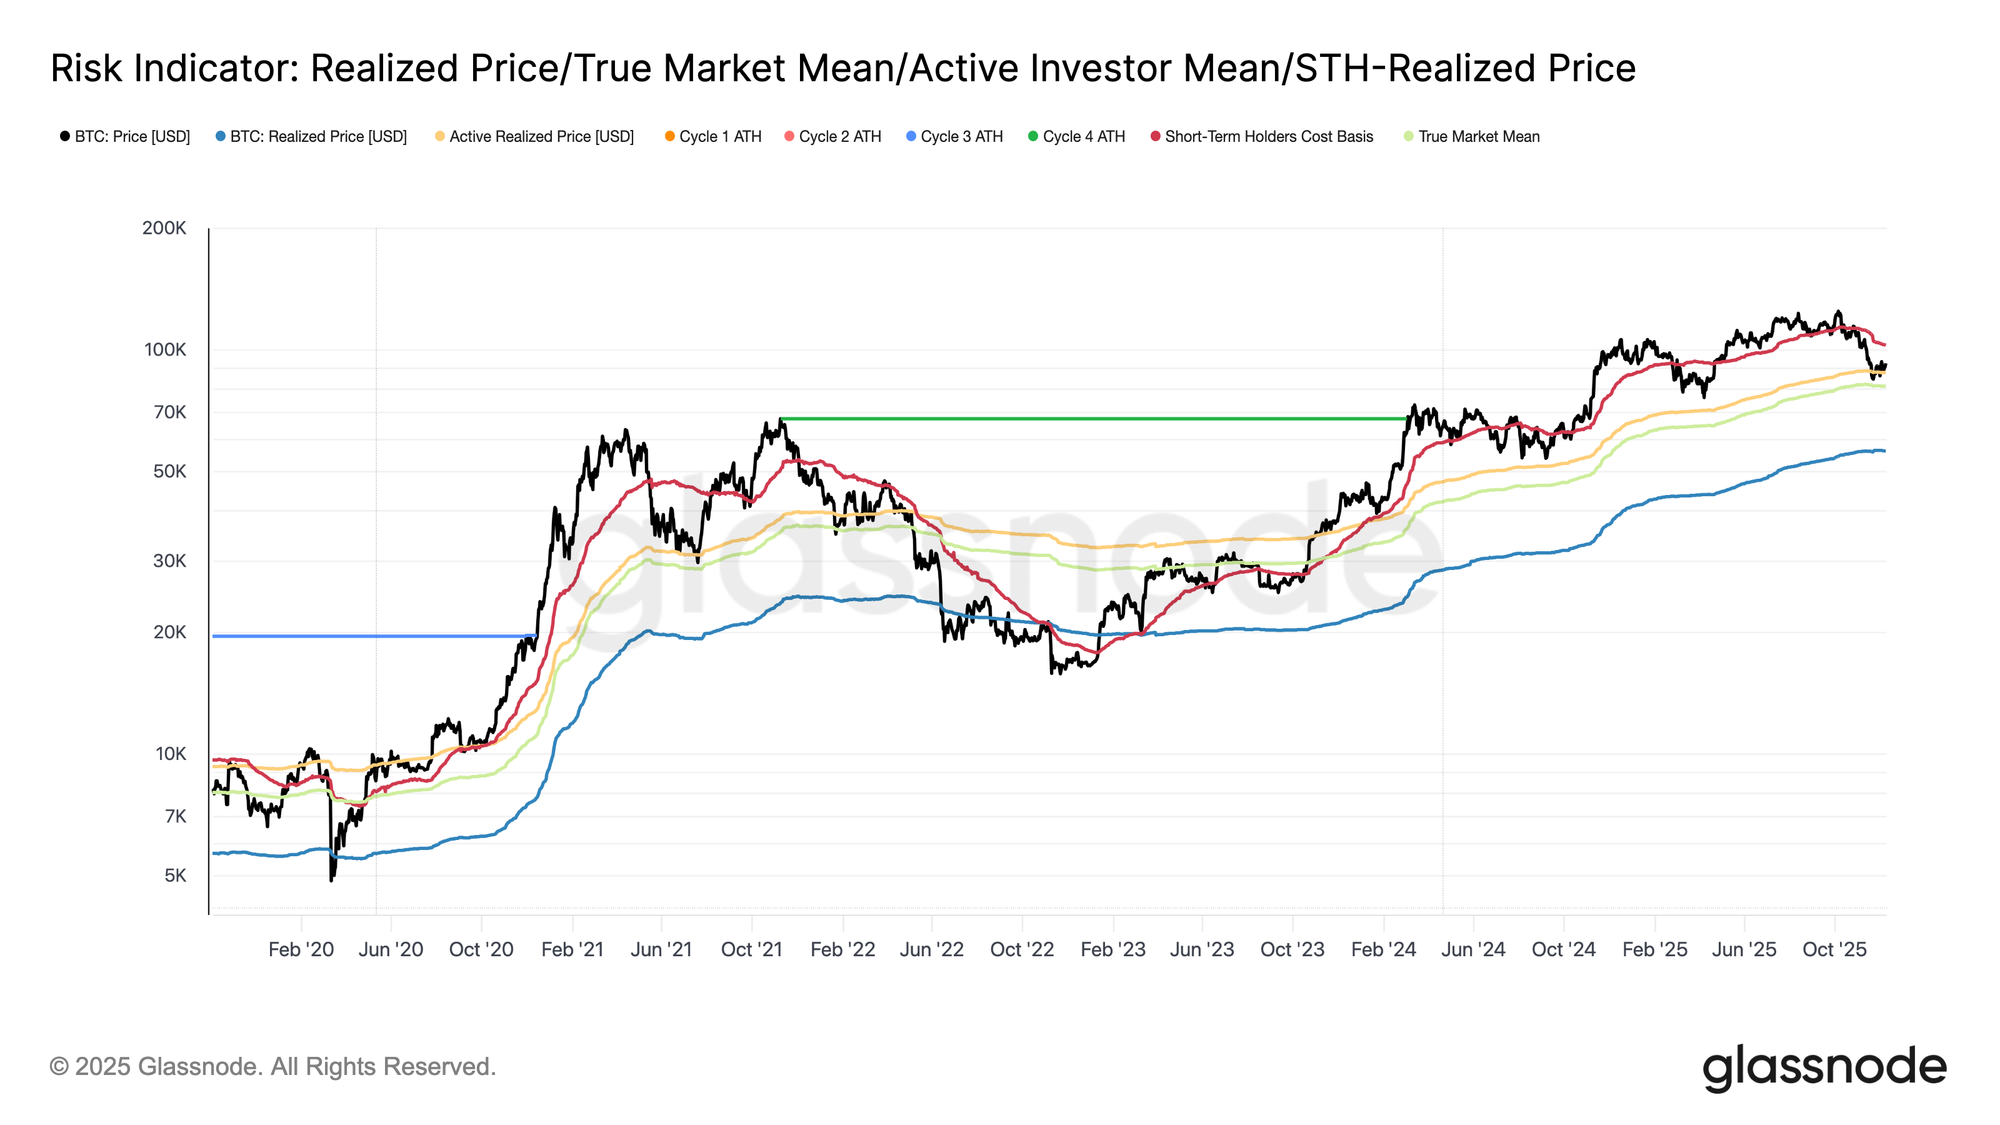
Bitcoin remains structurally fragile, trading between the STH-Cost Basis at $102.7k and the True Market Mean at $81.3k. On-chain conditions are weakening, with rising unrealized and realized losses, alongside elevated selling from long-term holders. Despite some demand absorbing this pressure, reclaiming key levels like the 0.75 cost-basis quantile ($95k) is crucial for a bullish reversal. Off-chain activity reflects caution: ETF flows are negative, spot and futures liquidity are subdued, and options markets show heightened demand for short-term downside protection ahead of the FOMC meeting. Traders are accumulating volatility, anticipating a near-term move. Post-FOMC, volatility may compress, but the market remains range-bound, balancing persistent sell pressure against patient demand.

Bitcoin enters the week still confined within a structurally fragile range, bounded by the STH-Cost Basis at $102.7k and the True Market Mean at $81.3k. Last week, we underscored weakening on-chain conditions, thinning demand, and a cautious derivatives landscape that collectively echo the early-2022 setup.

Although price has held marginally above the True Market Mean, unrealized losses continue to expand, realized losses are rising, and spending by long-term investors remains elevated. The key upper thresholds to reclaim are the 0.75 cost-basis quantile at $95k, followed by the STH-Cost Basis. Until then, the True Market Mean remains the most probable bottom-formation zone, barring a new macro shock.
Live Chart

Time Works Against the Bulls

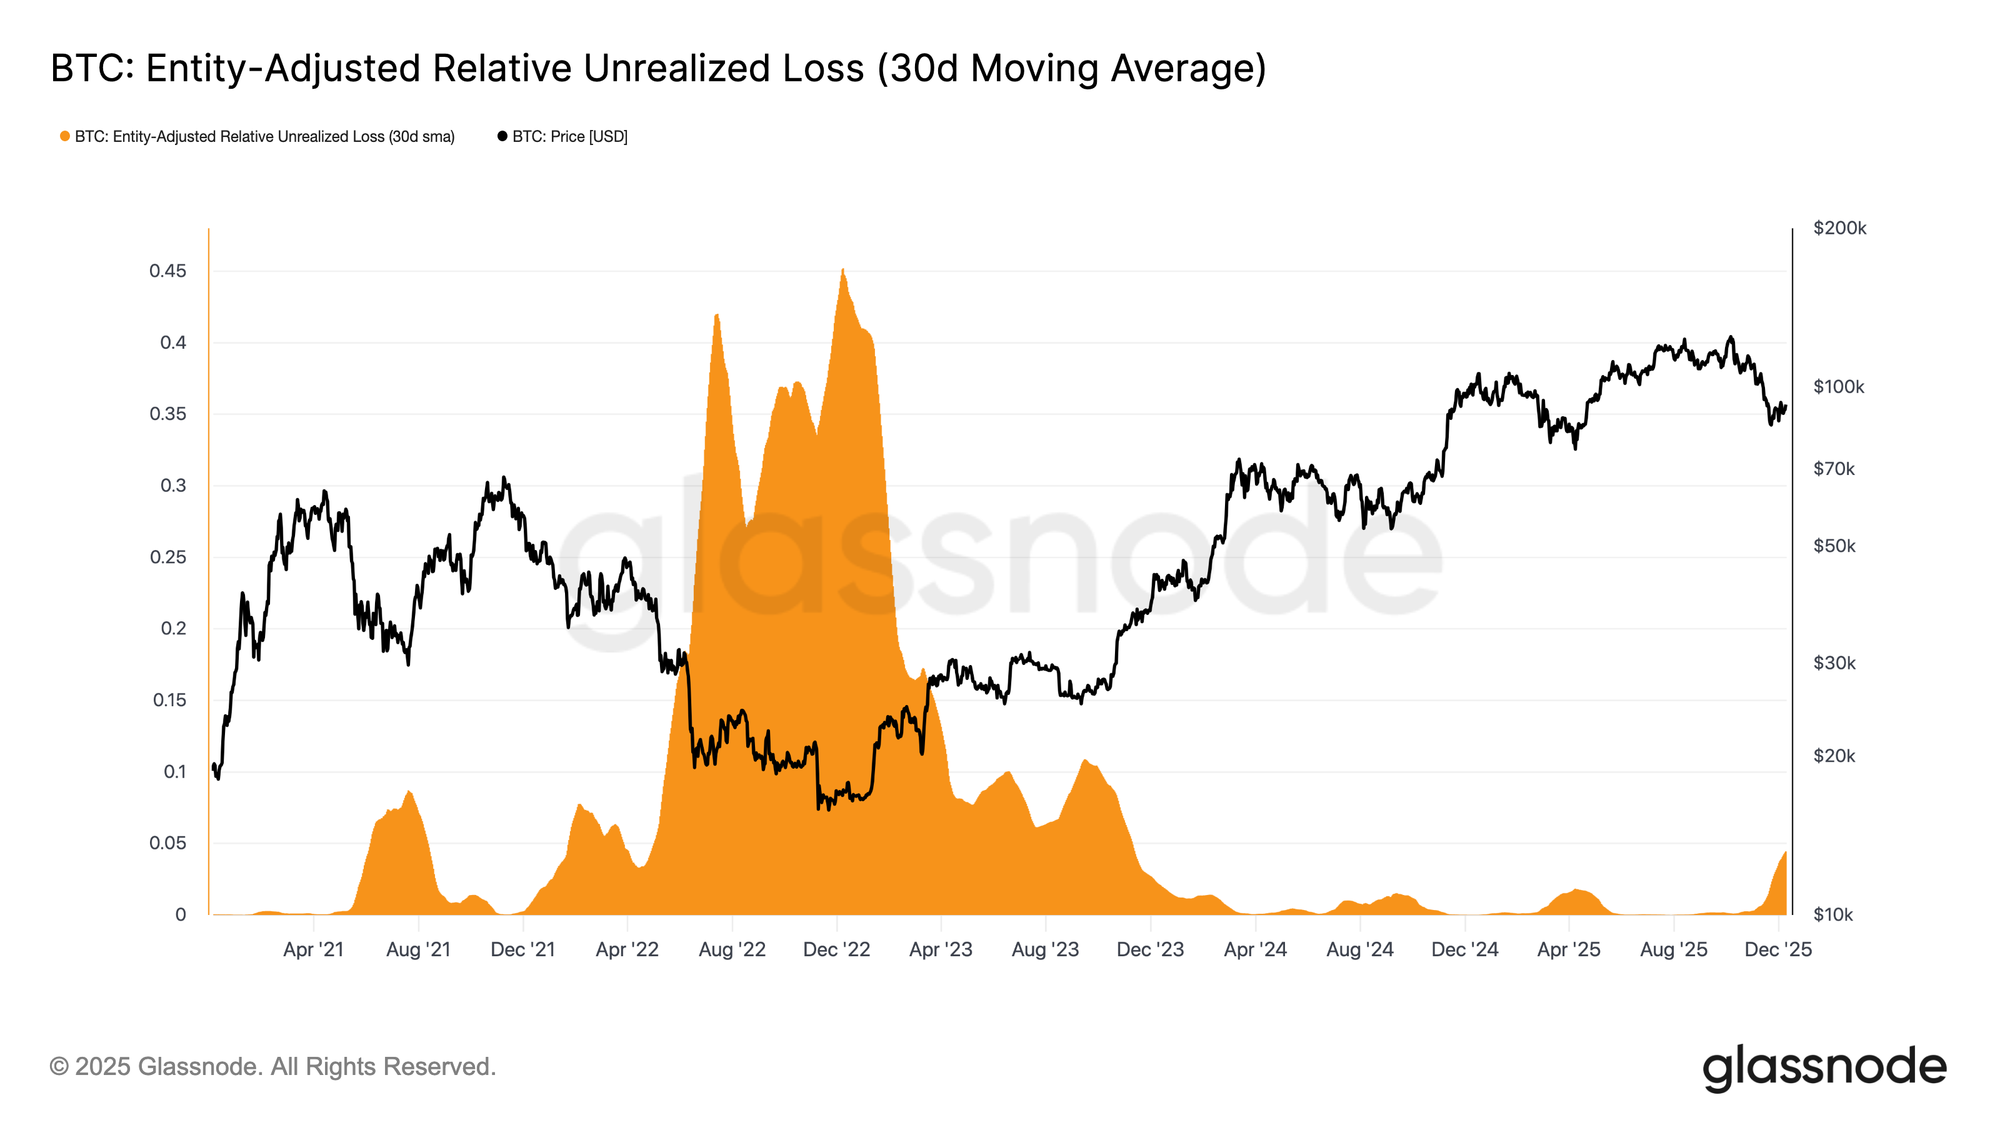
Remaining in a mild bearish phase reflects the tension between modest capital inflows and persistent sell pressure from top buyers. As the market holds within a weak but bounded range, time becomes a negative force, making unrealized losses harder for investors to endure and increasing the likelihood of loss realization.

The Relative Unrealized Loss (30D-SMA) has climbed to 4.4% after nearly two years below 2%, marking a shift from a euphoric phase to one of elevated stress and uncertainty. This hesitation now defines the range, and resolving it will require a renewed wave of liquidity and demand to rebuild confidence.
Live Chart

Losses Rising

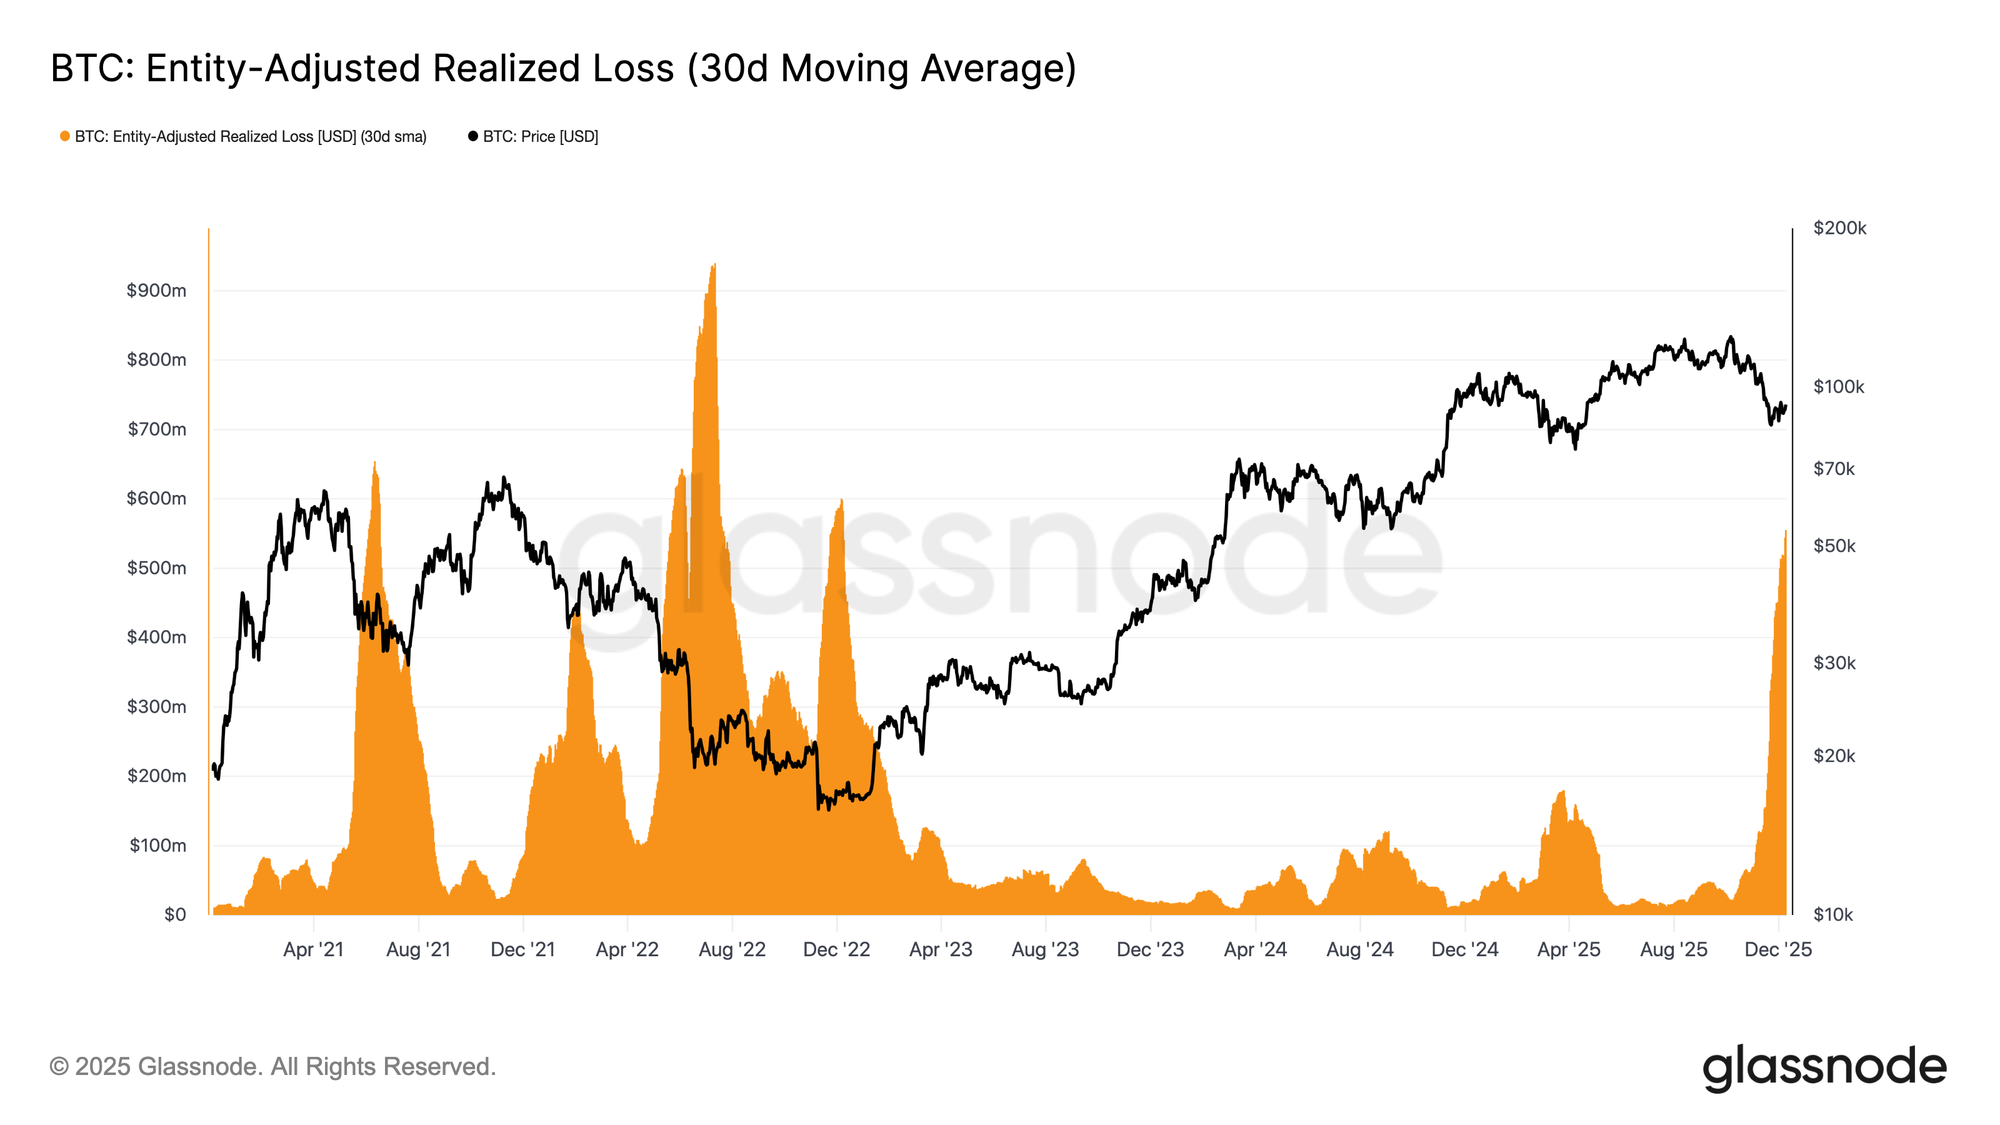
This time-driven pressure is further evident in spending behavior. Even as Bitcoin has rebounded from the November 22 low to roughly $92.7k, the 30D-SMA Entity-Adjusted Realized Loss has continued climbing, reaching $555 million per day, the highest level since the FTX collapse.

Such elevated loss realization during a moderate price recovery reflects mounting frustration among top buyers who are capitulating into strength rather than holding through the rebound.
Live Chart

Holding Back the Reversal

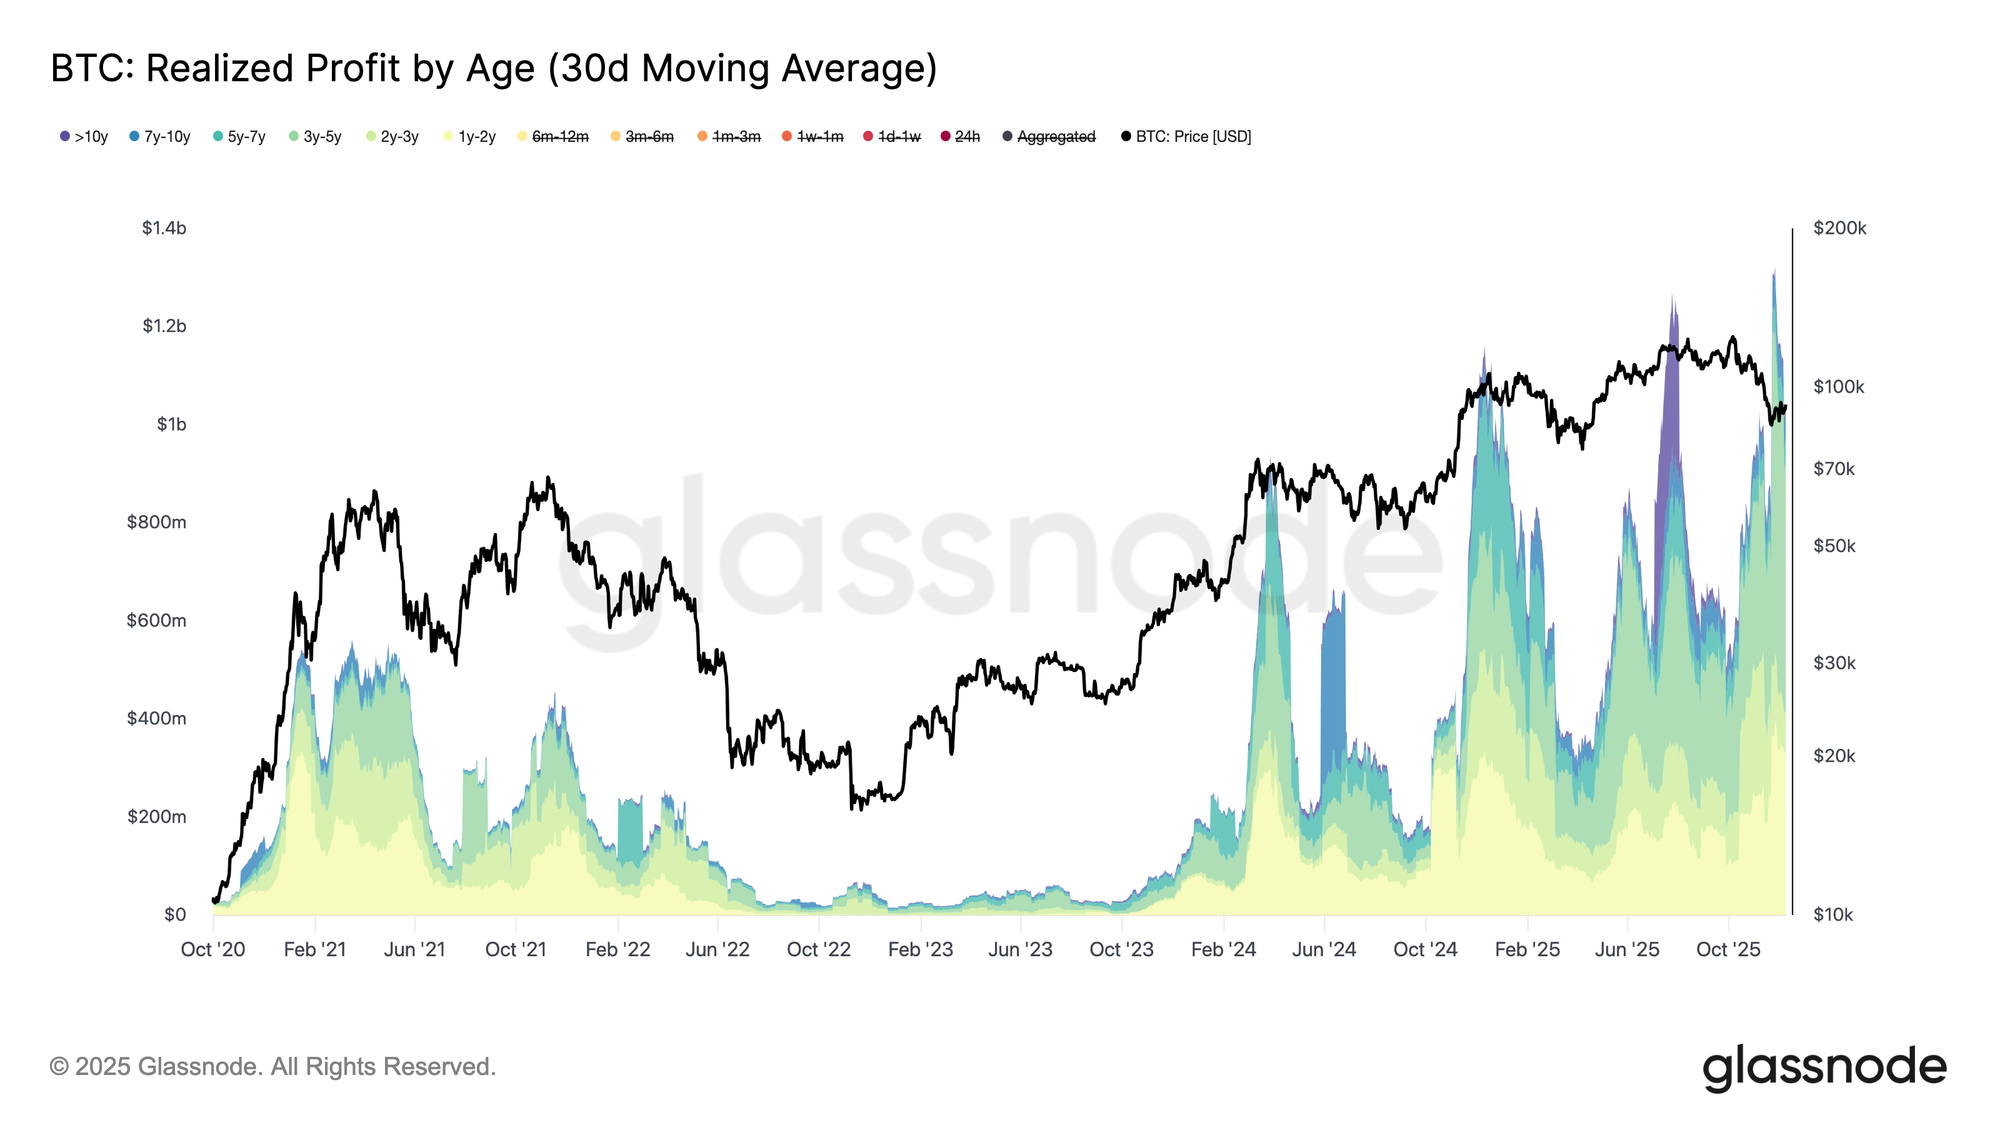
Rising realized losses are further anchoring the recovery, especially as they coincide with a surge in realized profit from seasoned investors. During the recent bounce, >1-year holders increased their realized profit (30D-SMA) above $1B per day, peaking at a new ATH of over $1.3B. Together, these two forces—time-driven capitulation by top buyers and heavy profit-taking by long-term holders ,explain why the market continues to struggle reclaiming the STH-Cost Basis.

Yet, despite this significant sell pressure, price has stabilized and even slightly recovered above the True Market Mean, signalling persistent and patient demand absorbing distribution. In the short term, if seller exhaustion begins to emerge, this underlying buy pressure could drive a retest of the 0.75 quantile (~$95k) and potentially the STH-Cost Basis.
Live Chart

Off-Chain Insights

ETF Woes

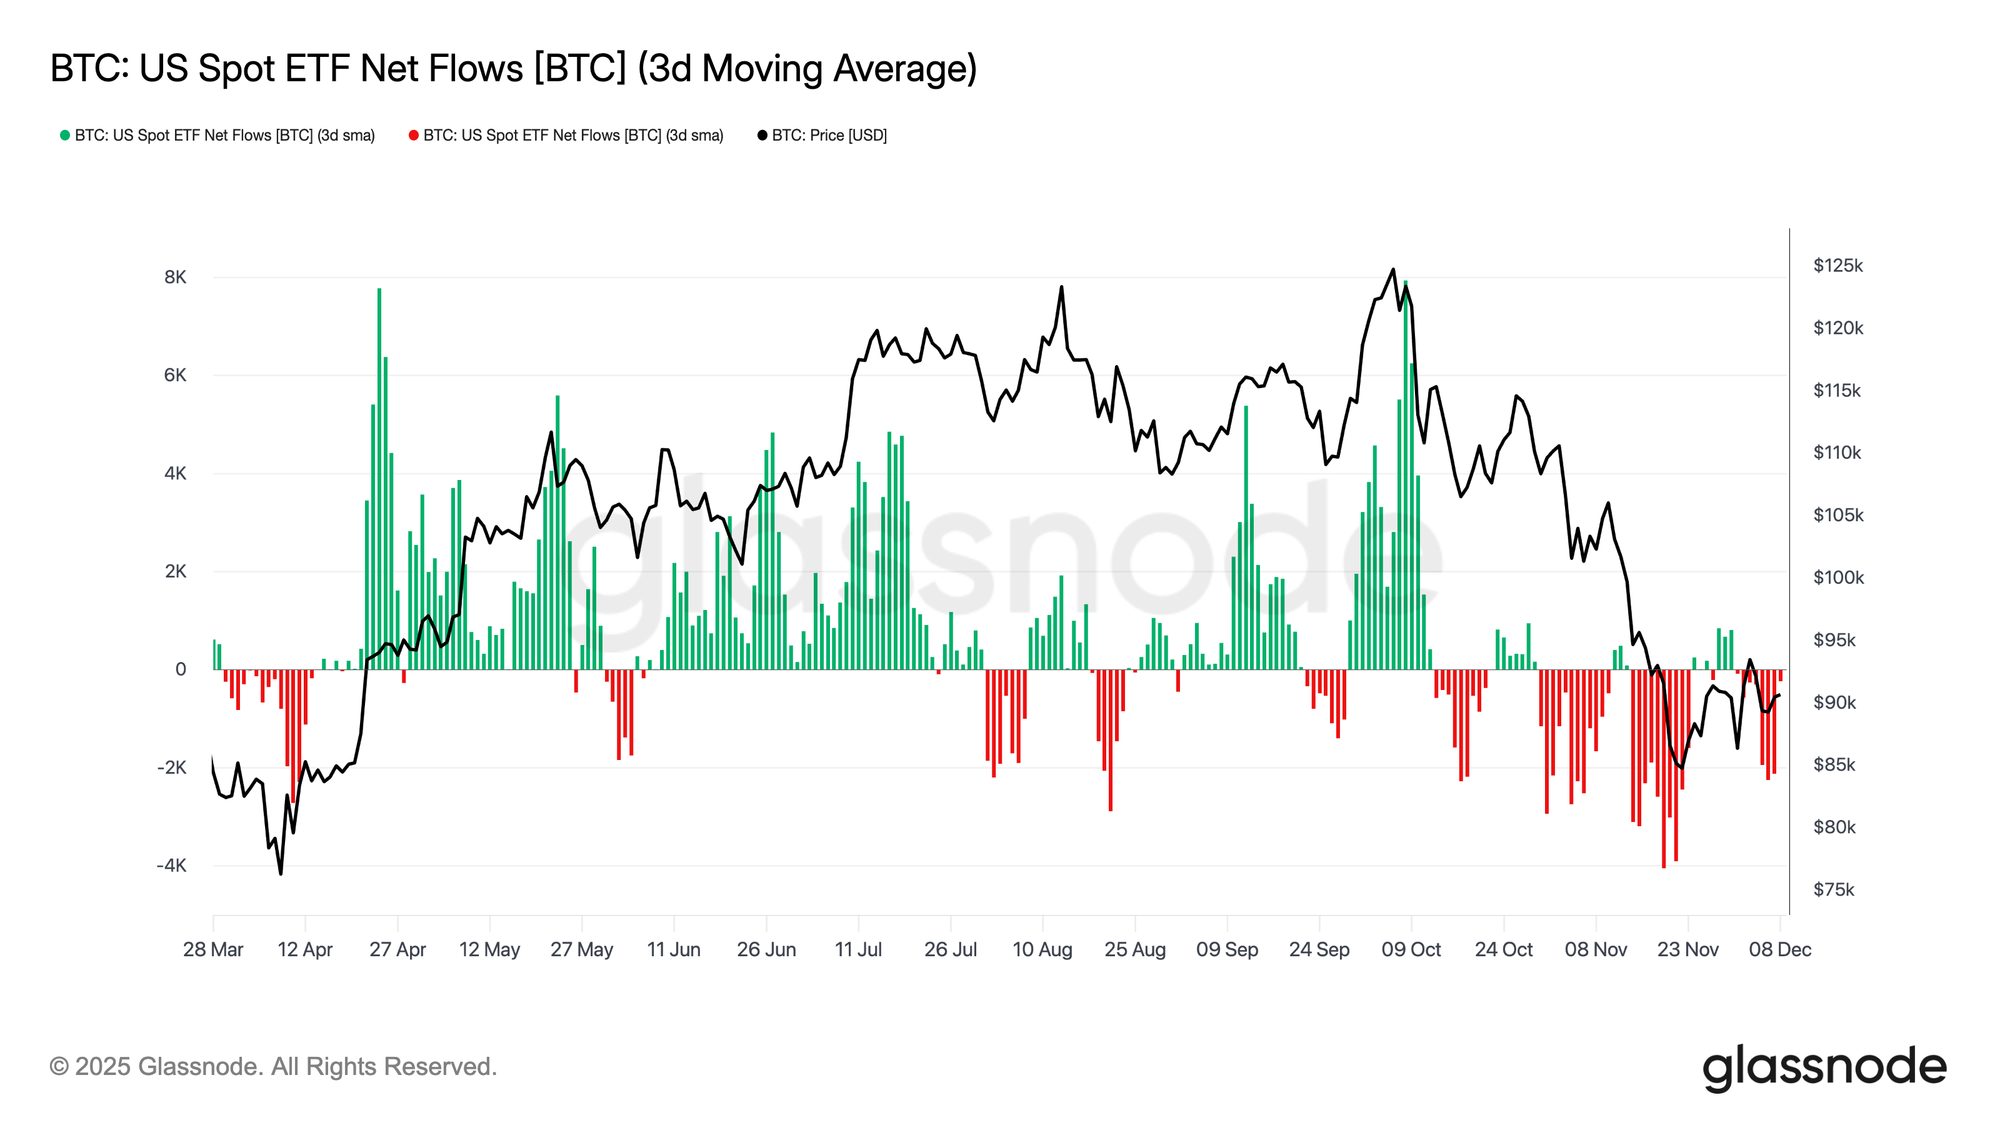
Turning to spot markets, US Bitcoin ETFs logged another quiet week, with the 3-day average of net flows remaining consistently below zero. This extends the cooling trend that began in late November and marks a clear departure from the robust inflow regime that supported price appreciation earlier in the year. Redemptions have been steady across several major issuers, underscoring a more risk-averse stance among institutional allocators as broader market conditions remain unsettled.

As a result, the spot market is operating with a thinner demand buffer, reducing immediate buy-side support and leaving price more vulnerable to macro catalysts and volatility shocks.
Live Chart

Liquidity Remains Subdued

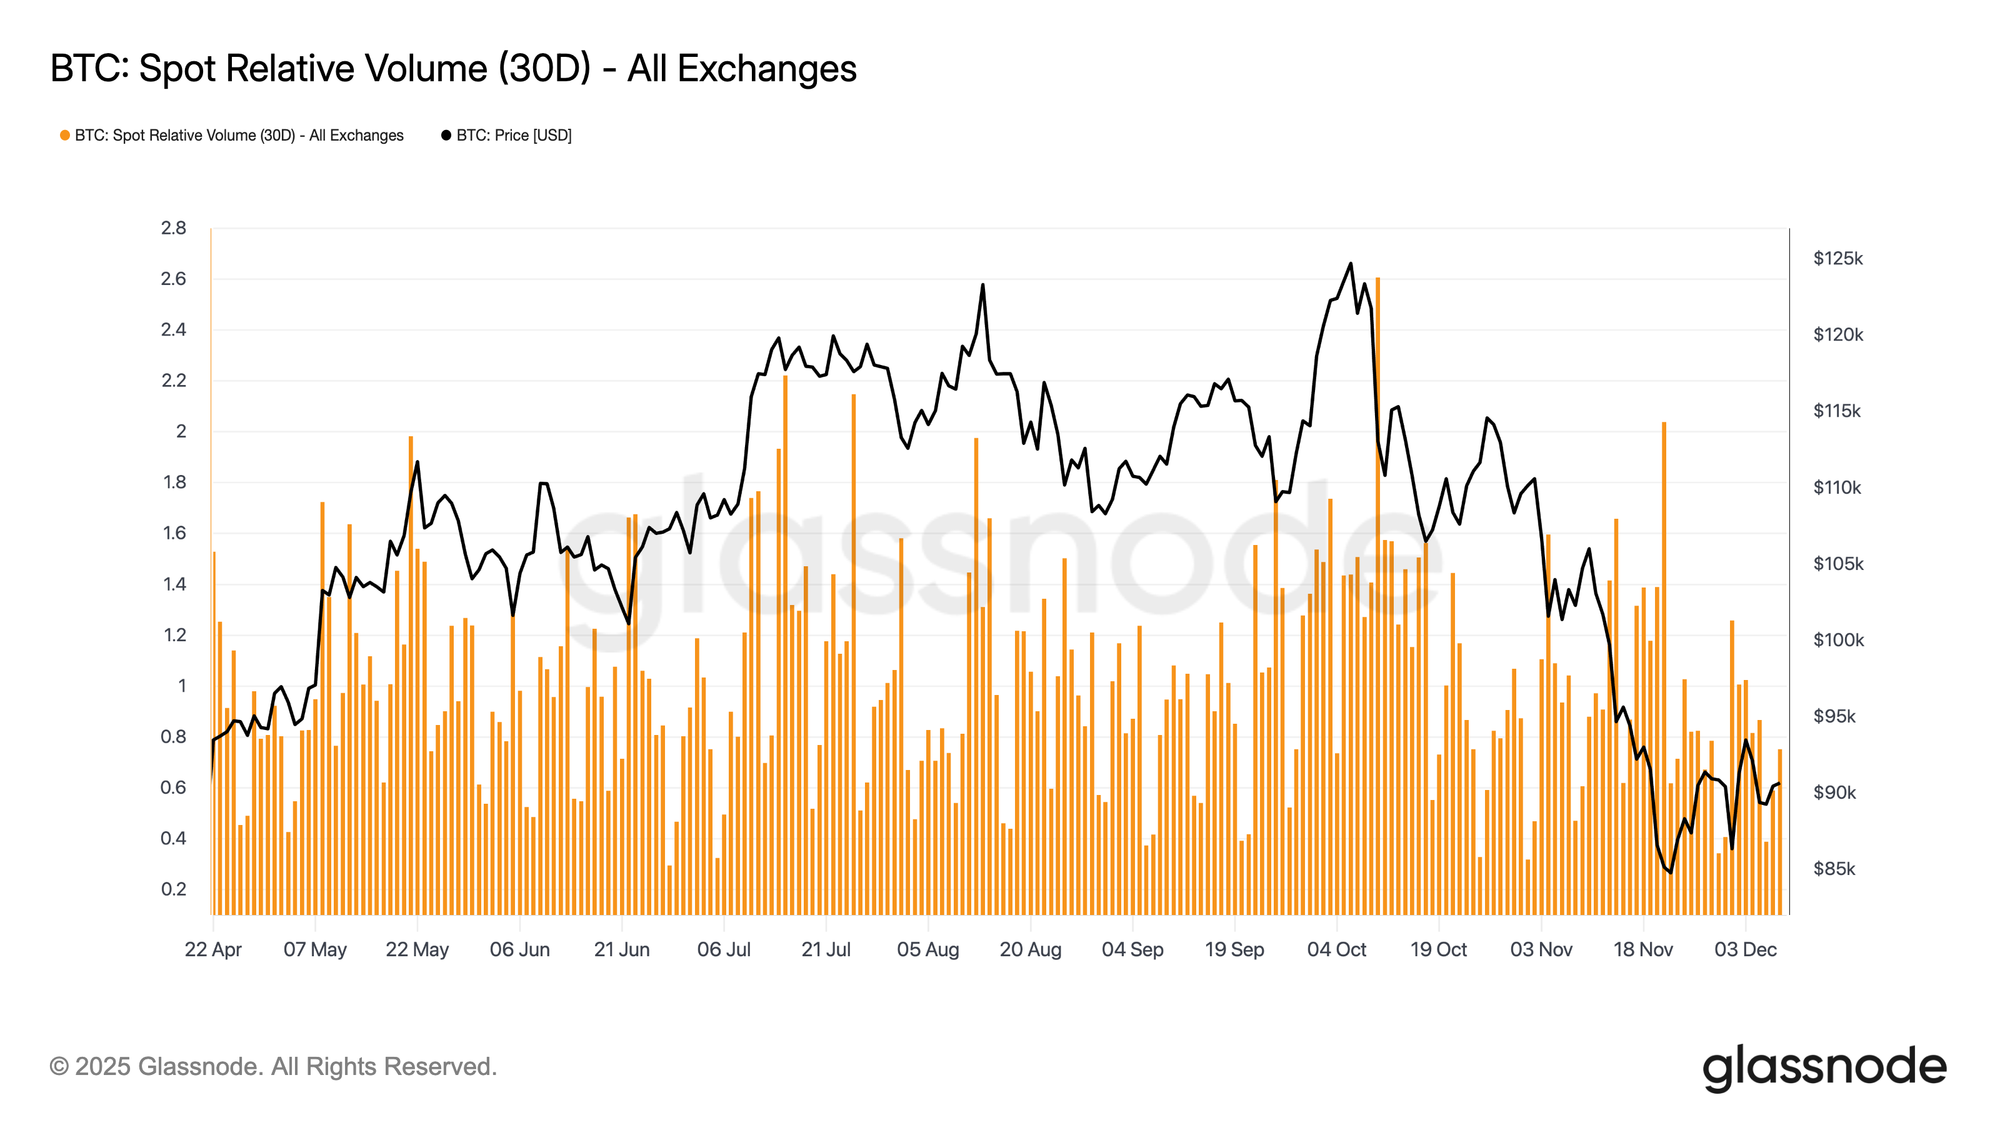
In parallel with softer ETF flows, Bitcoin’s spot relative volume continues to sit near the lower bound of its 30-day range. Trading activity has weakened through November and into December, mirroring the price decline and signalling a retreat in market participation. The contraction in volume reflects a more defensive positioning across the board, with fewer liquidity-driven flows available to absorb volatility or sustain directional moves.

With spot markets running quieter, attention now turns to the upcoming FOMC meeting, which could act as a catalyst for renewed participation depending on the policy tone.
Live Chart

Futures Ghost Town

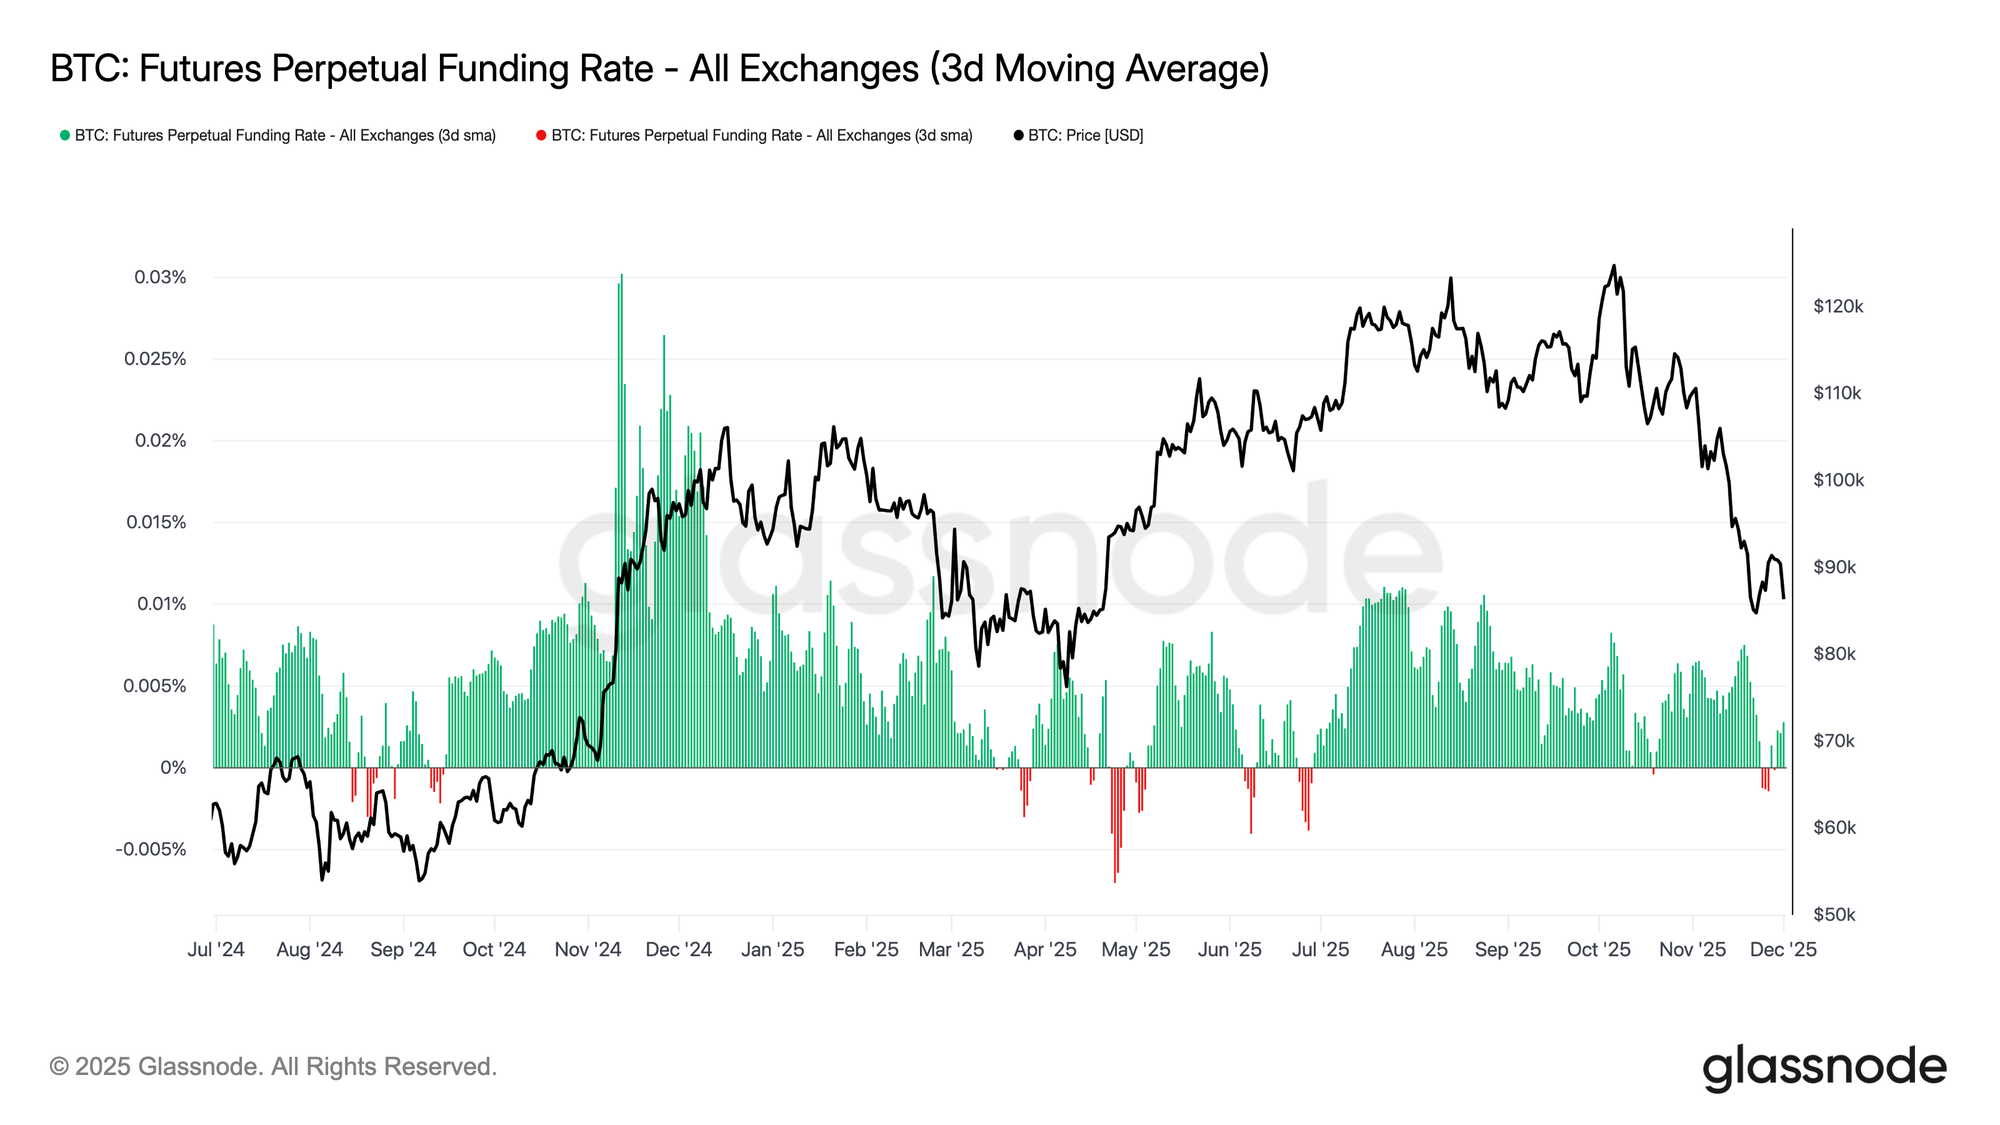
Extending this theme of muted participation, futures markets also show limited appetite for leverage, with Open Interest failing to meaningfully rebuild and funding rates pinned near neutral. These dynamics highlight a derivatives environment defined more by caution than conviction.

Across perpetual markets, funding hovered around zero to slightly negative during the week, underscoring the continued retreat in speculative long positioning. Traders remain balanced or defensive, contributing little directional pressure via leverage.

With derivatives activity subdued, price discovery tilts more heavily toward spot flows and macro catalysts rather than speculative expansion.
Live Chart

IV Pops at the Front End

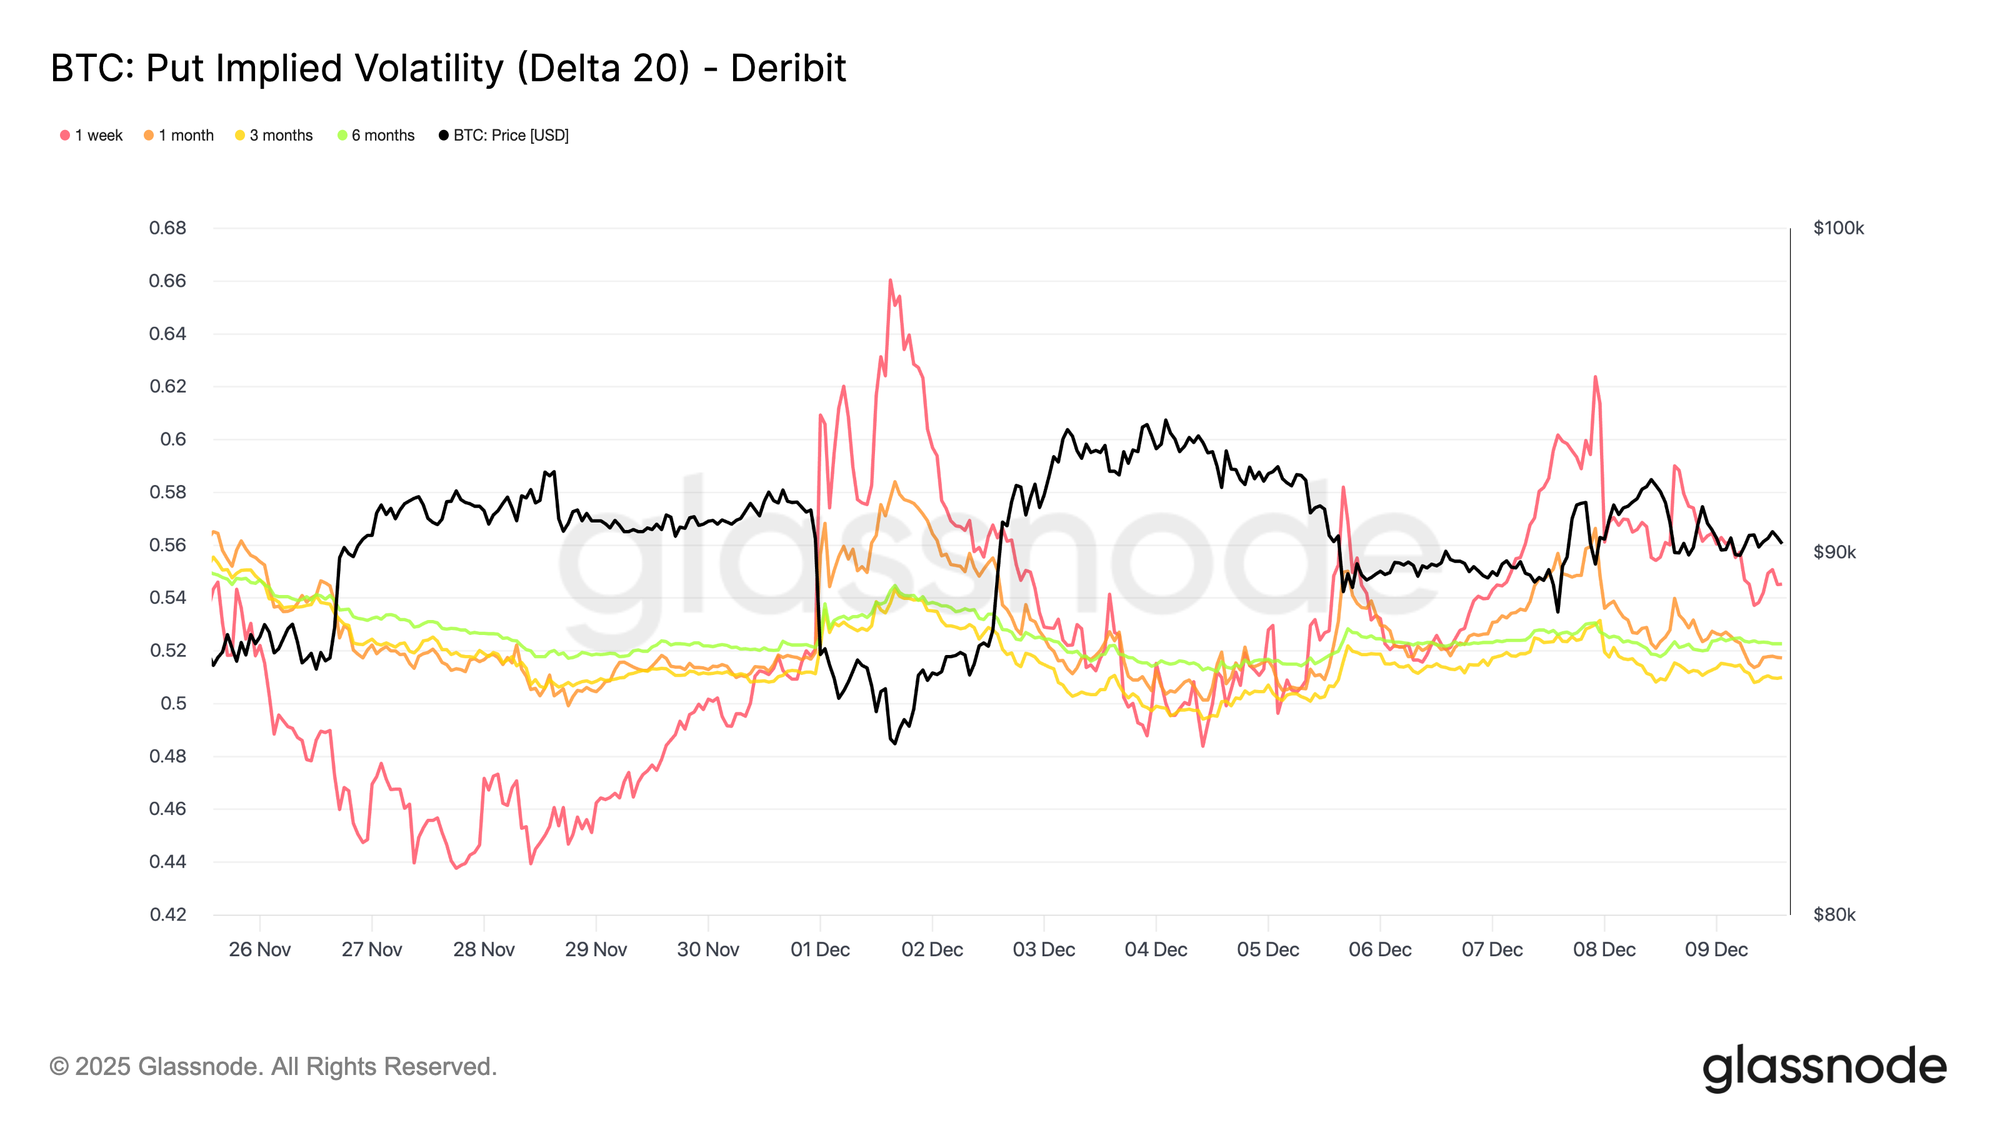
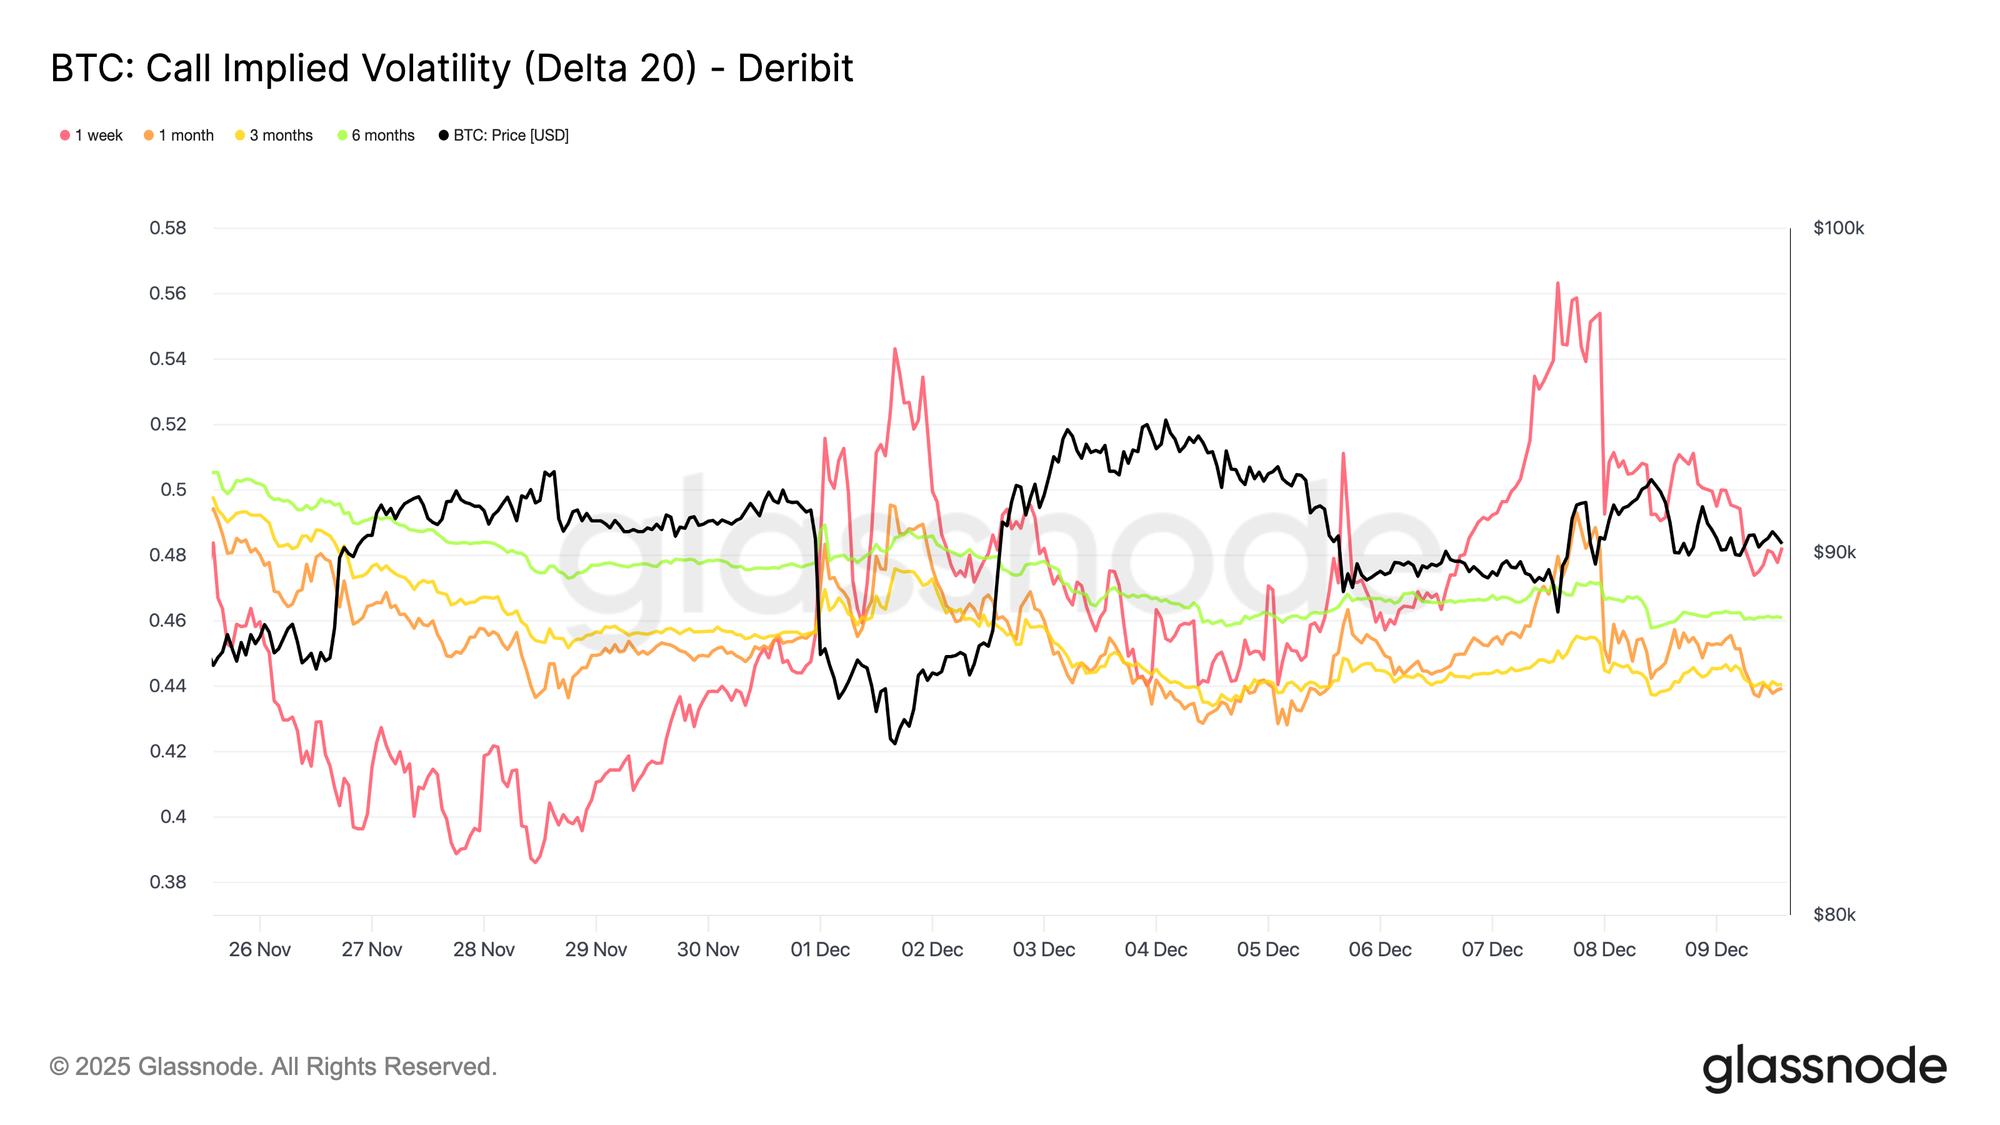
Turning to the options market, Bitcoin’s muted spot action contrasts sharply with a sudden rise in short-dated implied volatility, as traders position for a larger move. Interpolated Implied Volatility, which estimates IV at fixed deltas rather than relying on listed strikes, reveals a clearer structure of how risk is being priced across maturities.

On the 20-Delta CALL, the one-week tenor jumped by roughly ten vol points from last week, while longer maturities stayed relatively flat. The same pattern appears on the 20-Delta PUT, with short-dated downside IV lifting as longer expiries remain quiet.

Overall, traders are accumulating volatility precisely where they expect stress, preferring to own convexity rather than fade it ahead of the December 10 FOMC meeting.
Live Chart
Live Chart

Downside Demand Returns

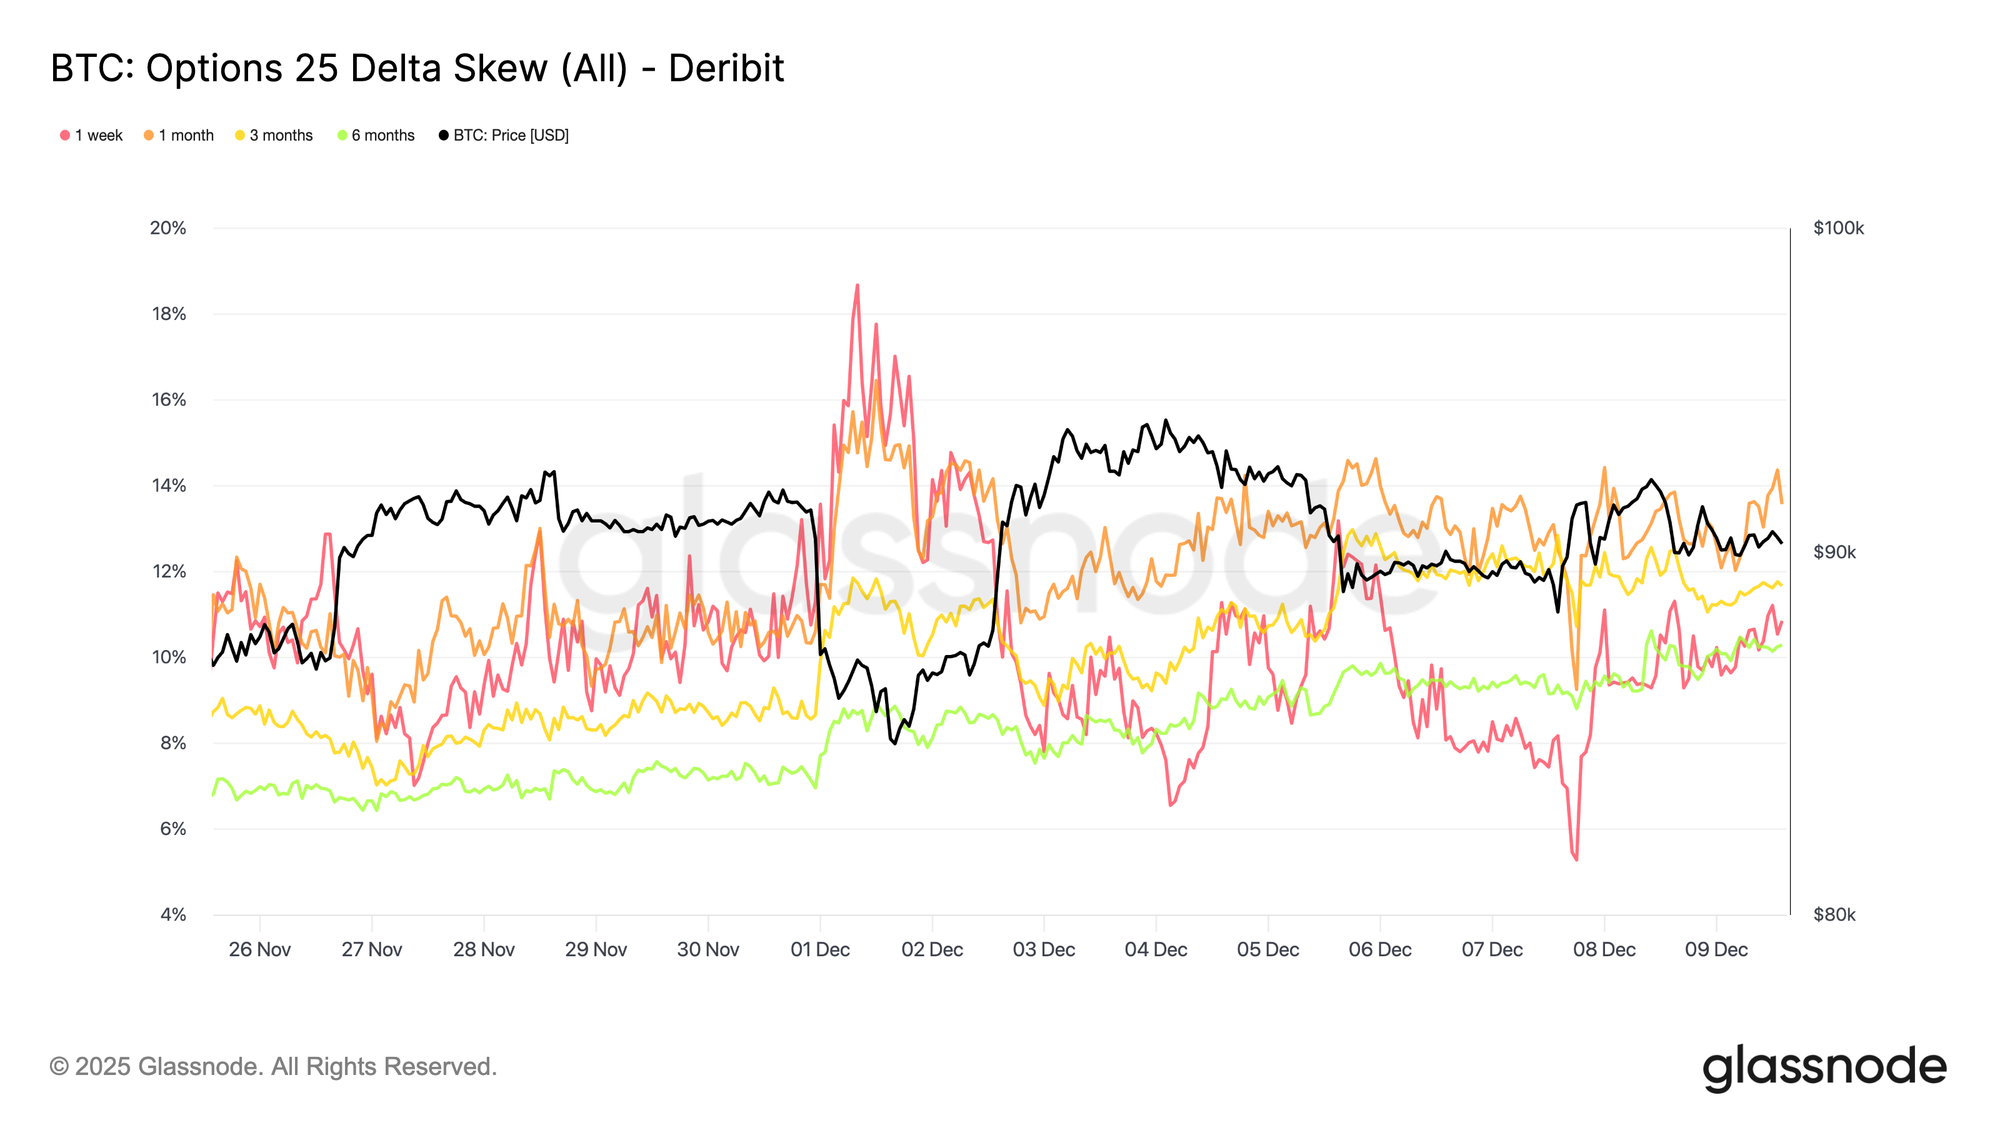
Complementing the rise in front-end volatility, downside protection is once again commanding a premium. The 25-delta skew, which measures the relative cost of puts versus calls at the same delta, has climbed to roughly 11 percent in the one-week tenor, indicating a clear pickup in demand for short-dated downside insurance ahead of the FOMC meeting.

Skew remains tightly clustered across maturities, ranging from 10.3 percent to 13.6 percent. This compression suggests that the preference for put protection is broad-based across the curve, reflecting a consistent hedging bias rather than isolated stress confined to the front end.
Live Chart

Skew Index Shows a Different Tone

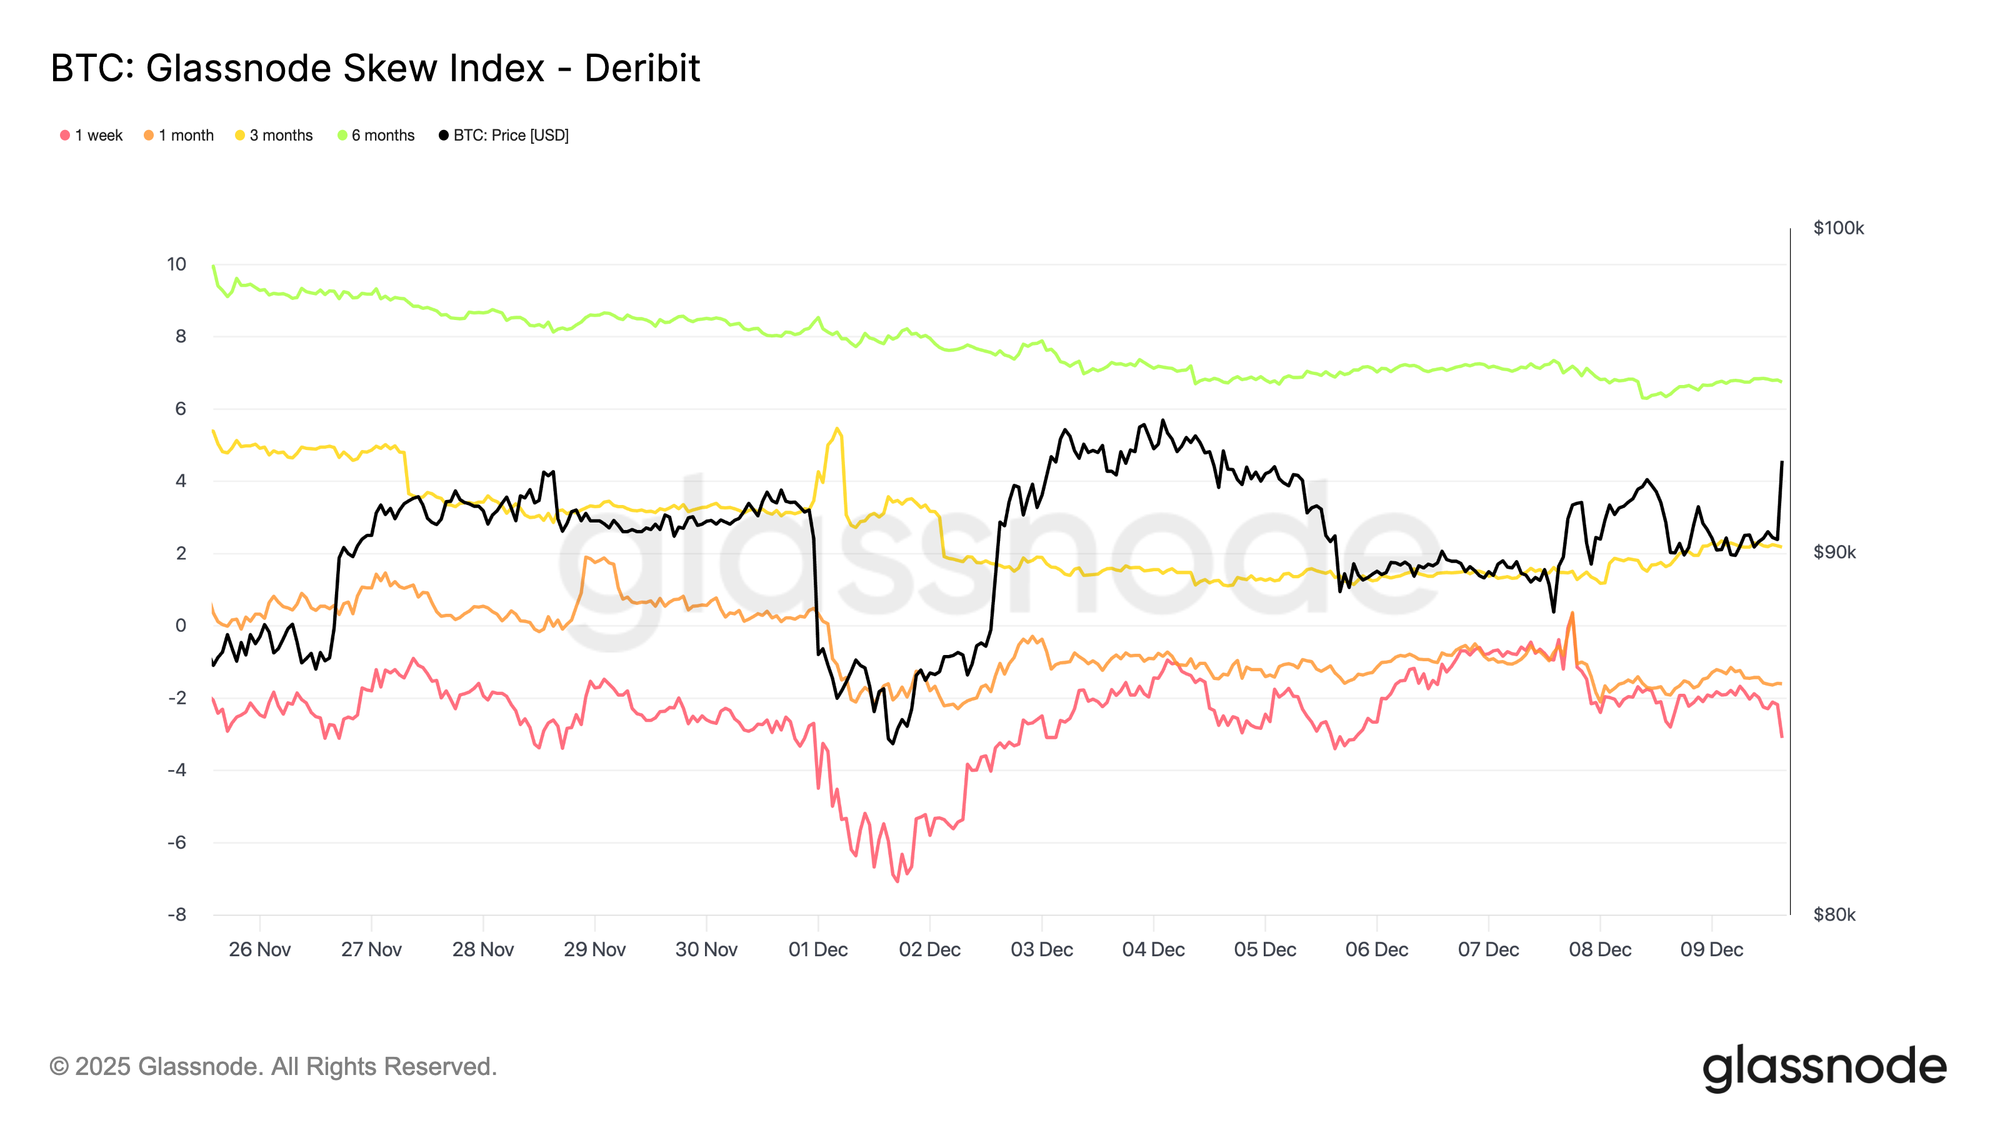
Adding another layer to the options picture, the skew index presents a more nuanced signal compared with the 25-delta skew. Because it is weighted toward low-delta options, it captures pricing across the full downside wing. The one-week and one-month readings sit in put territory, yet the three-month and six-month values, around 2.2 percent and 6.7 percent, fall into call territory, since the index is calculated as calls minus puts.

This creates a notable divergence: the 25-delta skew leans bearish across maturities, while the longer-dated skew index shows upside variance being priced more richly than downside. In essence, traders are not bidding deep OTM downside protection in the longer tenors, even though mid-delta puts remain supported. The surface therefore signals short-term caution, but a more balanced to mildly bullish tone further out the curve, a pattern typical in crypto where participants often hold far-OTM calls for asymmetric upside.
Live Chart

Volatility Accumulation

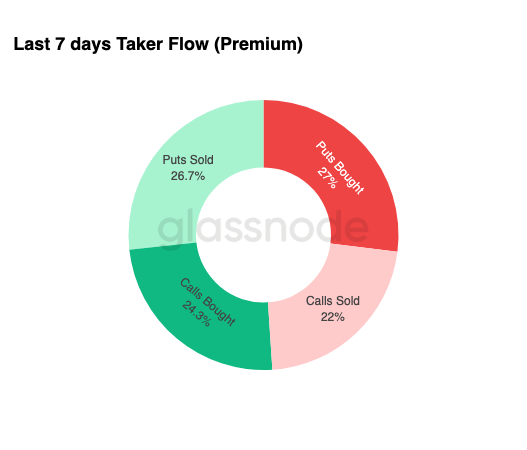
Rounding out the options landscape, weekly flow data reinforces a clear pattern: traders are buying volatility, not selling it. Premiums bought dominate total notional flow, with a slight lead from puts. This does not reflect a directional bias, but rather a regime of volatility accumulation. When traders purchase both wings, it signals hedging and convexity-seeking behaviour rather than sentiment-driven speculation.

Combined with rising implied volatility and a downside-leaning skew, the flow profile suggests that market participants are preparing for a volatility event with a bias toward the downside.
Live Chart

After FOMC

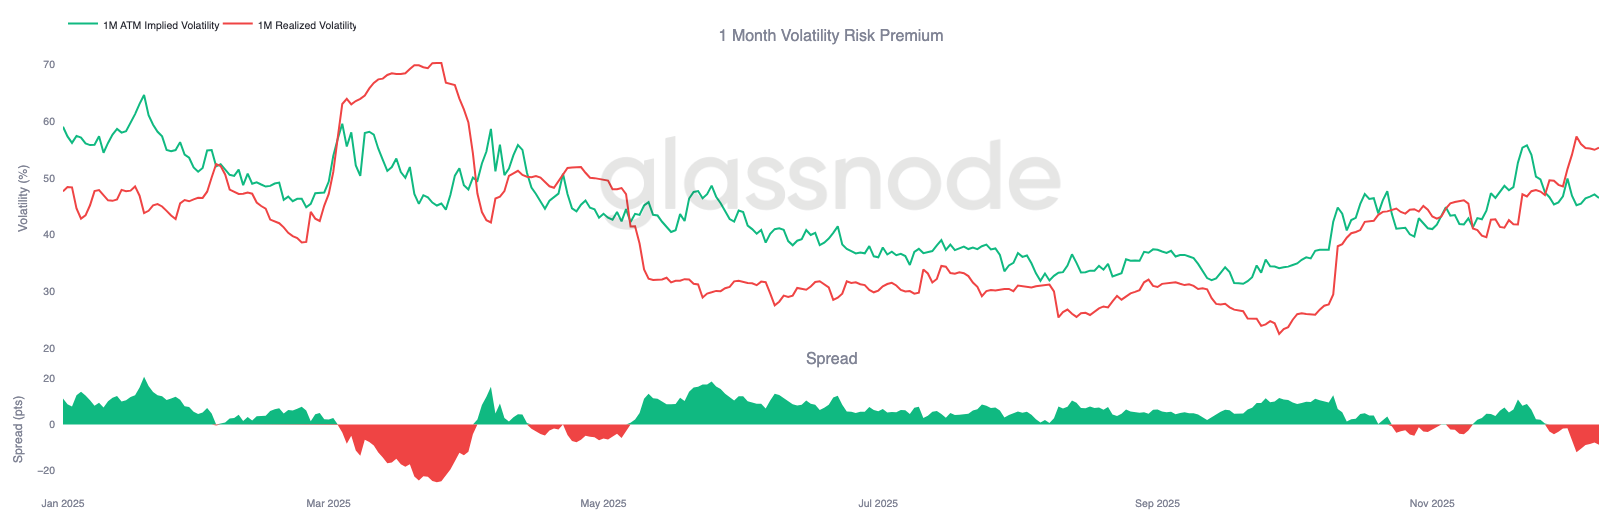
Looking ahead, implied volatility has already begun to ease, and historically, IV tends to compress further once the final major macro event of the year passes. With the December 10 FOMC meeting serving as the last meaningful catalyst, the market is preparing for a transition into a low-liquidity, mean-reverting environment.

After the announcement, gamma sellers typically re-enter, accelerating IV decay into year-end. Absent a hawkish surprise or a notable shift in guidance, the path of least resistance points toward lower implied volatility and a flatter surface through late December.
Live Chart

Conclusion

Bitcoin continues to trade within a structurally fragile environment where rising unrealized losses, elevated realized loss realization, and heavy profit-taking from long-term holders collectively anchor price action. Despite this persistent sell pressure, demand remains sufficiently resilient to keep price above the True Market Mean, suggesting patient buyers are still absorbing distribution. A short-term push toward the 0.75 quantile or even the STH Cost Basis remains possible if seller exhaustion begins to surface.

Off-chain conditions echo this cautious tone. ETF flows remain negative, spot liquidity is subdued, and futures markets lack speculative engagement. Options markets reinforce a defensive posture, with traders accumulating volatility, bidding short-dated downside protection, and positioning for a near-term volatility event ahead of the FOMC meeting.

Taken together, market structure suggests a weak but stable range, held up by patient demand yet constrained by persistent sell pressure. The short-term path hinges on whether liquidity improves and sellers relent, while the longer-term outlook depends on the market’s ability to reclaim key cost-basis thresholds and shift out of this time-driven, psychologically taxing phase.


Criptos en tendencia

Lecturas Relacionadas

In Conversation with Ray Dalio: We Are Currently in an AI Bubble, with 1% of My Portfolio in Bitcoin

Ray Dalio, founder of Bridgewater Associates, warns in an interview that the current AI boom shows classic bubble characteristics, which could lead to significant economic downturns as seen in past cycles like 1929 or 2000. He explains that speculative enthusiasm, fueled by debt and overvaluation, often precedes a crash when rising rates or taxation force asset sales, causing widespread losses and recession. Dalio also outlines his "Big Cycle" theory, describing an approximate 80-year pattern where widening wealth gaps, massive government deficits, and shifting geopolitical power (like China's rise) create internal conflict and global instability. He emphasizes that we are in a late-cycle, transitional phase where traditional powers like the US and UK face decline. For personal wealth protection, Dalio advises diversification beyond cash into assets like stocks, bonds, real estate, and particularly gold, which he prefers over Bitcoin. While he holds about 1% of his portfolio in Bitcoin as a non-printable hard asset, he views gold as more secure from technological or governmental threats. Regarding AI's impact, Dalio believes it will disproportionately benefit capital owners, worsening inequality by replacing both physical and cognitive labor. He suggests that human intuition and emotional intelligence, combined with AI, will be key for future workers. On taxation, Dalio argues that wealth taxes are impractical and risk triggering asset sell-offs, reducing productive investment. He points to the UK as a cautionary example of debt, low productivity, and political strife. Geopolitically, Dalio foresees a more regionalized world, with the US showing weakness in prolonged conflicts like with Iran, akin to past imperial declines. The ideal outcome, he suggests, is coexisting powerful blocs (e.g., Americas, China-Asia Pacific) without major war.

marsbitHace 2 hora(s)

In Conversation with Ray Dalio: We Are Currently in an AI Bubble, with 1% of My Portfolio in Bitcoin

marsbitHace 2 hora(s)

Daily 7.2 Trillion KRW: Foreign Capital's Record Net Buying on Friday! Wall Street Says Headwinds for Korean Stock Fund Flows Have Subsided

South Korean stock market sees a dramatic shift in fund flows. On July 31, foreign investors made a record net purchase of approximately KRW 7.2 trillion in KOSPI stocks, marking a fundamental reversal from the persistent large-scale net outflows seen in previous months. This contributed to a significant narrowing of foreign net selling in July to KRW 9.8 trillion, down sharply from KRW 48.4 trillion in June and KRW 44.5 trillion in May. Simultaneously, domestic institutional pressure eased. South Korean pension funds and asset managers turned to a net buying position in July, purchasing KRW 1.0 trillion worth of KOSPI shares, contrasting with net sales in May and June. Market volatility is expected to be dampened by new financial regulations. Effective July 31, the Financial Services Commission tightened access for retail investors to single-stock leveraged ETFs by raising the minimum cash deposit requirement. Trading volumes for these products subsequently dropped to about 50% of their monthly average. Citigroup Research maintains its year-end KOSPI target of 10,000 points. The firm cites several supportive factors: the substantial easing of headwinds from capital outflows, a robust fundamental outlook for the semiconductor sector, historically low market valuations, strong economic fundamentals, and the potential for policy support from financial authorities if needed.

marsbitHace 2 hora(s)

Daily 7.2 Trillion KRW: Foreign Capital's Record Net Buying on Friday! Wall Street Says Headwinds for Korean Stock Fund Flows Have Subsided

marsbitHace 2 hora(s)

Thanks to Dice Rolls, Bitcoin Keys Are Stored Offline, But Not Everyone Will Do It

The article discusses using dice rolls to generate secure Bitcoin wallet seeds, providing entropy independent of potentially flawed hardware random number generators. It explains that each fair dice roll offers about 2.585 bits of entropy, with around 50 rolls needed for a standard 12-word seed phrase and 99+ recommended for higher security. This method gained attention after a vulnerability was revealed in some Coldcard hardware wallets, where a faulty firmware RNG (dating back to 2021) compromised generated keys. The analysis notes that while a dice-generated main seed was safe from this specific flaw, other Coldcard functions (like creating paper wallets, backup keys, or passwords) could still be vulnerable if they used the defective RNG. The piece argues that while dice-based entropy is technically robust, the manual process is error-prone, tedious, and unrealistic for most new users, who might make mistakes in recording or inputting rolls. It concludes that while manual entropy generation should remain an option for advanced users, the long-term goal is to develop reliable, user-friendly hardware and software that securely generates randomness without requiring specialized knowledge. Coldcard users are advised to check their firmware version and replace any secondary secrets (like paper wallet keys) created with vulnerable devices, while also considering multi-signature setups with devices from different manufacturers for added security.

cryptonews.ruHace 8 hora(s)

Thanks to Dice Rolls, Bitcoin Keys Are Stored Offline, But Not Everyone Will Do It

cryptonews.ruHace 8 hora(s)

Trading

Spot

Artículos destacados

Cómo comprar O

¡Bienvenido a HTX.com! Hemos hecho que comprar O1 exchange (O) sea simple y conveniente. Sigue nuestra guía paso a paso para iniciar tu viaje de criptos.Paso 1: crea tu cuenta HTXUtiliza tu correo electrónico o número de teléfono para registrarte y obtener una cuenta gratuita en HTX. Experimenta un proceso de registro sin complicaciones y desbloquea todas las funciones.Obtener mi cuentaPaso 2: ve a Comprar cripto y elige tu método de pagoTarjeta de crédito/débito: usa tu Visa o Mastercard para comprar O1 exchange (O) al instante.Saldo: utiliza fondos del saldo de tu cuenta HTX para tradear sin problemas.Terceros: hemos agregado métodos de pago populares como Google Pay y Apple Pay para mejorar la comodidad.P2P: tradear directamente con otros usuarios en HTX.Over-the-Counter (OTC): ofrecemos servicios personalizados y tipos de cambio competitivos para los traders.Paso 3: guarda tu O1 exchange (O)Después de comprar tu O1 exchange (O), guárdalo en tu cuenta HTX. Alternativamente, puedes enviarlo a otro lugar mediante transferencia blockchain o utilizarlo para tradear otras criptomonedas.Paso 4: tradear O1 exchange (O)Tradear fácilmente con O1 exchange (O) en HTX's mercado spot. Simplemente accede a tu cuenta, selecciona tu par de trading, ejecuta tus trades y monitorea en tiempo real. Ofrecemos una experiencia fácil de usar tanto para principiantes como para traders experimentados.

458 Vistas totalesPublicado en 2026.06.19Actualizado en 2026.06.29

Cómo comprar O

Cómo comprar PROS

¡Bienvenido a HTX.com! Hemos hecho que comprar Pharos (PROS) sea simple y conveniente. Sigue nuestra guía paso a paso para iniciar tu viaje de criptos.Paso 1: crea tu cuenta HTXUtiliza tu correo electrónico o número de teléfono para registrarte y obtener una cuenta gratuita en HTX. Experimenta un proceso de registro sin complicaciones y desbloquea todas las funciones.Obtener mi cuentaPaso 2: ve a Comprar cripto y elige tu método de pagoTarjeta de crédito/débito: usa tu Visa o Mastercard para comprar Pharos (PROS) al instante.Saldo: utiliza fondos del saldo de tu cuenta HTX para tradear sin problemas.Terceros: hemos agregado métodos de pago populares como Google Pay y Apple Pay para mejorar la comodidad.P2P: tradear directamente con otros usuarios en HTX.Over-the-Counter (OTC): ofrecemos servicios personalizados y tipos de cambio competitivos para los traders.Paso 3: guarda tu Pharos (PROS)Después de comprar tu Pharos (PROS), guárdalo en tu cuenta HTX. Alternativamente, puedes enviarlo a otro lugar mediante transferencia blockchain o utilizarlo para tradear otras criptomonedas.Paso 4: tradear Pharos (PROS)Tradear fácilmente con Pharos (PROS) en HTX's mercado spot. Simplemente accede a tu cuenta, selecciona tu par de trading, ejecuta tus trades y monitorea en tiempo real. Ofrecemos una experiencia fácil de usar tanto para principiantes como para traders experimentados.

469 Vistas totalesPublicado en 2026.06.22Actualizado en 2026.06.29

Cómo comprar PROS

Qué es VERONA

I. Introducción al Proyecto VERONA es una blockchain construida para todos, en todas partes a través de la abstracción de cadenas. Utilizando su capa de Abstracción Generalizada, VERONA se distingue por integrar funcionalidades complejas de blockchain, como cuentas, firmas e interoperabilidad, directamente a nivel de protocolo. Este enfoque permite interactuar con aplicaciones de blockchain sin necesidad de entender las tecnologías subyacentes.1) Información Básica Nombre: VERONA (VERONA)III. Enlaces Relacionados Enlace al sitio web oficial: https://xion.burnt.com/ Libro Blanco: https://xion.burnt.com/whitepaper.pdf Exploradores: https://explorer.burnt.com/ Redes Sociales: https://x.com/burnt_xion Nota: La introducción del proyecto proviene de los materiales publicados o proporcionados por el equipo oficial del proyecto, que es solo para referencia y no constituye asesoramiento de inversión. HTX no se hace responsable de ninguna pérdida directa o indirecta resultante.

552 Vistas totalesPublicado en 2026.06.22Actualizado en 2026.06.22

Qué es VERONA

Discusiones

Bienvenido a la comunidad de HTX. Aquí puedes mantenerte informado sobre los últimos desarrollos de la plataforma y acceder a análisis profesionales del mercado. A continuación se presentan las opiniones de los usuarios sobre el precio de A (A).

活动图片













