Analyzing if FET can hold its make-or-break level or drop to $0.20

ambcryptoPublicado a 2026-03-31Actualizado a 2026-03-31

Resumen

FET is trading near a critical support level of $0.2270 after declining over 8%, with analysts warning of a potential further drop to $0.20 or even $0.1737 if this level breaks. Short-term bearish sentiment is reinforced by derivatives data, showing stronger short positions and a descending triangle pattern on the chart. However, the long-term outlook may still be bullish, as the top 100 wallet addresses increased their holdings by 2.04% in the past week, suggesting accumulation. The Average Directional Index (ADX) indicates weak momentum, meaning the asset may struggle before any significant downward move.

Artificial Superintelligence Alliance [FET] has fallen over 8% and was trading near $0.229 at press time, a level that appears to be a make-or-break point for the asset. Moreover, strengthening derivatives’ metrics alongside expert commentary further reinforces and potentially confirms that FET could continue its downside move.

As the broader market struggles, CoinGlass data show intraday traders closely tracking the trend and betting on further declines.

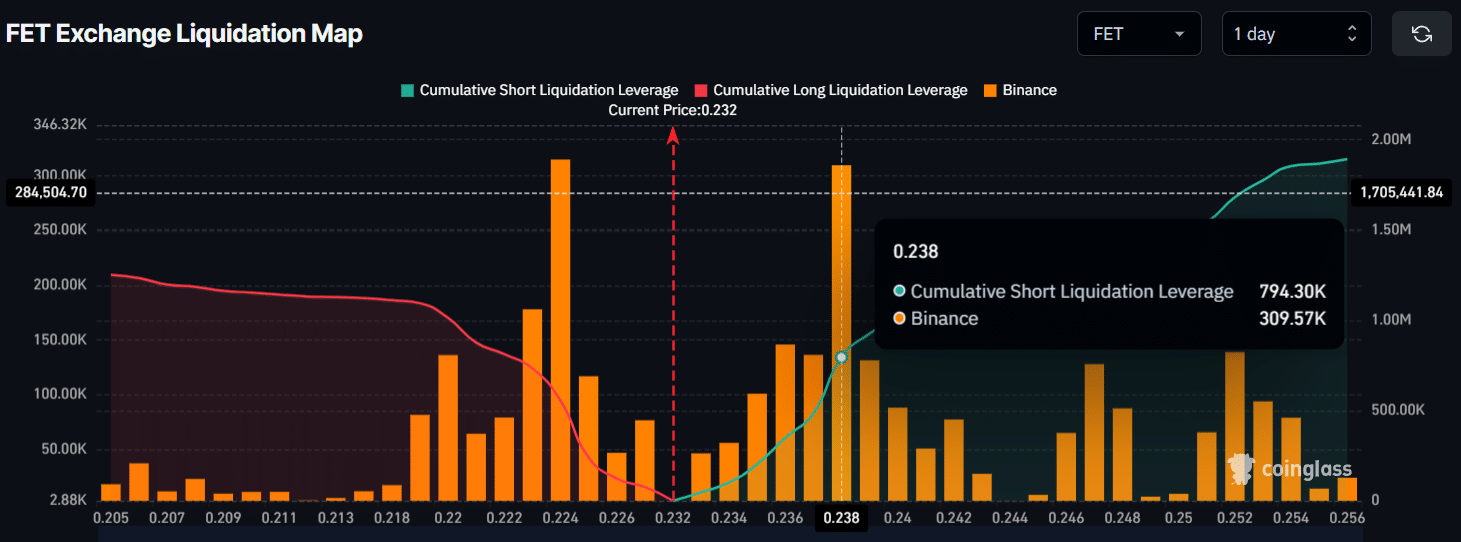
According to the FET exchange liquidation map, traders have shown strong interest around $0.224 on the downside and $0.238 on the upside. At these levels, they have built approximately $294K worth of long-leveraged positions and $794K worth of short-leveraged positions.

These bets indicate that bears are currently dominating the asset in the short term, while bulls appear to be exhausted.

Source: CoinGlass

In fact, a crypto analyst recently echoed a similar outlook on FET’s price. In a post on X, the analyst explained that the asset was retracing into a supply zone and showing clear signs of exhaustion. Moreover, FET appears positioned to grab liquidity before turning lower. For this potential decline, the expert outlined target levels, noting that FET could drop to $0.20 and $0.1737.

FET price action and key levels to watch

On the four-hour chart, FET appears bearish, as the token’s drop has brought the price to a make-or-break level, a level the asset has consistently held since the 26th of March 2026. In fact, the chart suggests that FET has formed a descending triangle pattern and is now poised for a breakdown.

Source: TradingView

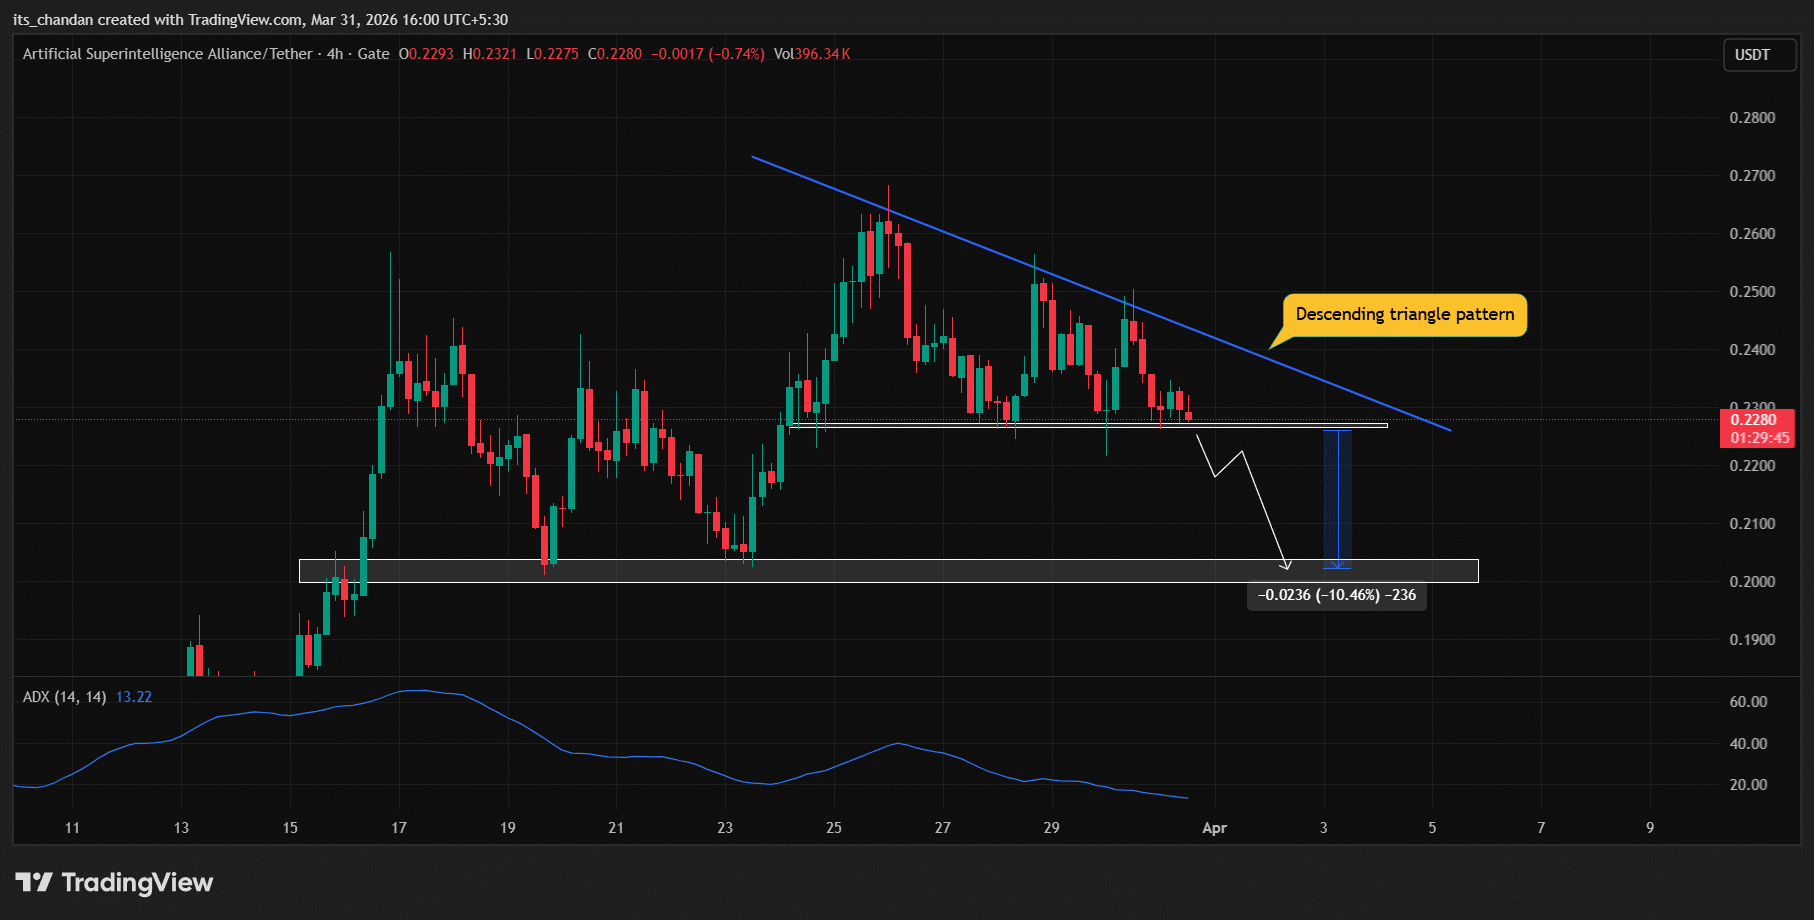
Based on the current price action, if FET fails to hold its key support level of $0.2270 and closes a four-hour candle below it, the price could potentially decline by another 10%, reaching the $0.20 level in the coming days.

However, a reversal is also possible if the price remains above the $0.2270 level. An upside move would likely only begin if FET breaks out above the descending trendline of the pattern.

Alongside this, the technical indicator Average Directional Index (ADX) stood at 13.22, below the key threshold of 25, indicating weak directional momentum. This suggests that the asset may struggle before continuing its downward move.

Top 100 addresses increase holdings

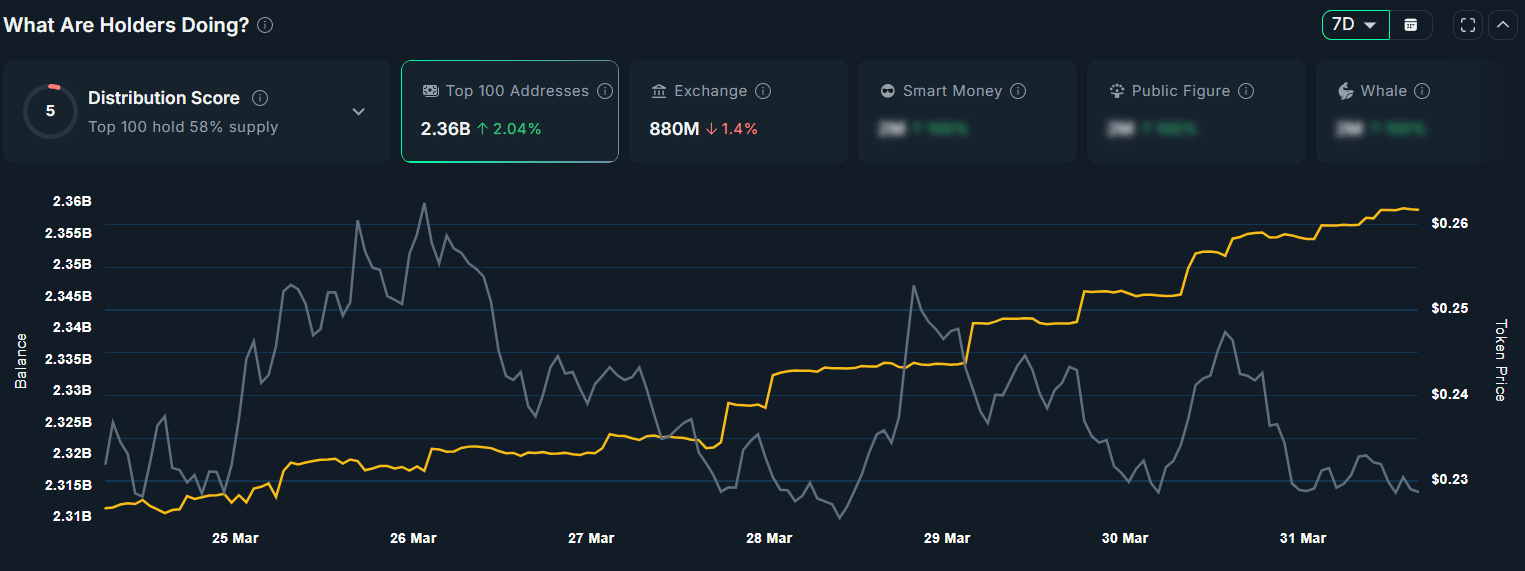
Despite all these bearish developments over the past 24 hours, analytics tool Nansen indicates that FET’s long-term outlook remains bullish.

The data shows that the top 100 wallet addresses have increased their holdings by 2.04% over the past week, signaling potential accumulation. Meanwhile, Exchange Reserves have declined by 1.40% during the same period, further suggesting accumulation by long-term holders.

Source: Nansen

Final Summary

  • FET has declined over 8%, and its price action hints at a potential 10% drop if it falls below the $0.2270 level.
  • An expert has outlined a bearish outlook for the asset, eyeing downside targets of $0.20 and $0.1737.

Preguntas relacionadas

QWhat is the current price of FET and why is it considered a make-or-break level?

AFET is trading near $0.229 at press time, which is considered a make-or-break level because it's a key support level that the asset has consistently held since March 26, 2026. A break below this level could lead to further significant declines.

QAccording to the CoinGlass data, what do the liquidation levels and leveraged positions indicate about market sentiment?

AThe CoinGlass data shows strong trader interest at $0.224 (downside) and $0.238 (upside), with approximately $294K in long-leveraged positions and $794K in short-leveraged positions. This indicates that bears are currently dominating in the short term, while bulls appear exhausted.

QWhat specific price targets did the crypto analyst outline for FET's potential decline?

AThe crypto analyst outlined two specific downside targets for FET: $0.20 and $0.1737, suggesting these are potential levels the asset could drop to if the bearish scenario plays out.

QWhat technical pattern has FET formed on the four-hour chart and what does it suggest?

AFET has formed a descending triangle pattern on the four-hour chart, which is typically considered a bearish pattern and suggests the asset is poised for a potential breakdown if it fails to hold its key support level.

QDespite the bearish short-term outlook, what data from Nansen suggests a potentially bullish long-term perspective?

ANansen data shows that the top 100 wallet addresses have increased their FET holdings by 2.04% over the past week, while Exchange Reserves have declined by 1.40%, suggesting accumulation by long-term holders and indicating a potentially bullish long-term outlook.

Lecturas Relacionadas

You Bet on the News, the Pros Read the Rules: The True Cognitive Gap in Losing Money on Polymarket

The article explains that the key to profiting on Polymarket, a prediction market platform, lies not just predicting real-world events correctly, but in meticulously understanding the specific rules that govern how each market will be resolved. It illustrates this with examples, such as a market on Venezuela's 2026 leader, where the official rules defining "officially holds" the office overruled the intuitive answer of who was in practical control. Other examples include debates over the definition of a "token" or what constitutes an "agreement." The core argument is that a "reality vs. rules" gap creates pricing discrepancies that savvy traders ("车头" or "whales") exploit. The platform has a formal dispute resolution process managed by UMA token holders to settle ambiguous outcomes. This process involves proposal submission, a challenge window, a discussion period, and a final vote. However, the article highlights a critical flaw in this system compared to a traditional court: the lack of separation between the arbiters (UMA voters) and the interested parties (traders with financial stakes in the outcome). This conflict of interest undermines the discussion phase, leads to herd mentality, and results in opaque final decisions without explanatory rulings. Consequently, the system lacks a body of precedent, making it difficult for users to learn from past disputes. The ultimate takeaway is that success on Polymarket requires a lawyer-like scrutiny of the rules to identify and capitalize on the cognitive gap between how events appear and how they are contractually defined for settlement.

marsbitHace 1 hora(s)

You Bet on the News, the Pros Read the Rules: The True Cognitive Gap in Losing Money on Polymarket

marsbitHace 1 hora(s)

Trading

Spot
Futuros

Artículos destacados

Cómo comprar FET

¡Bienvenido a HTX.com! Hemos hecho que comprar FETCH.ai (FET) sea simple y conveniente. Sigue nuestra guía paso a paso para iniciar tu viaje de criptos.Paso 1: crea tu cuenta HTXUtiliza tu correo electrónico o número de teléfono para registrarte y obtener una cuenta gratuita en HTX. Experimenta un proceso de registro sin complicaciones y desbloquea todas las funciones.Obtener mi cuentaPaso 2: ve a Comprar cripto y elige tu método de pagoTarjeta de crédito/débito: usa tu Visa o Mastercard para comprar FETCH.ai (FET) al instante.Saldo: utiliza fondos del saldo de tu cuenta HTX para tradear sin problemas.Terceros: hemos agregado métodos de pago populares como Google Pay y Apple Pay para mejorar la comodidad.P2P: tradear directamente con otros usuarios en HTX.Over-the-Counter (OTC): ofrecemos servicios personalizados y tipos de cambio competitivos para los traders.Paso 3: guarda tu FETCH.ai (FET)Después de comprar tu FETCH.ai (FET), guárdalo en tu cuenta HTX. Alternativamente, puedes enviarlo a otro lugar mediante transferencia blockchain o utilizarlo para tradear otras criptomonedas.Paso 4: tradear FETCH.ai (FET)Tradear fácilmente con FETCH.ai (FET) en HTX's mercado spot. Simplemente accede a tu cuenta, selecciona tu par de trading, ejecuta tus trades y monitorea en tiempo real. Ofrecemos una experiencia fácil de usar tanto para principiantes como para traders experimentados.

73 Vistas totalesPublicado en 2024.12.11Actualizado en 2025.03.21

Cómo comprar FET

Discusiones

Bienvenido a la comunidad de HTX. Aquí puedes mantenerte informado sobre los últimos desarrollos de la plataforma y acceder a análisis profesionales del mercado. A continuación se presentan las opiniones de los usuarios sobre el precio de FET (FET).

活动图片