A Bullish Pennant Just Appeared On The Dogecoin Monthly Chart, Here’s What To Expect

bitcoinistPublicado a 2026-03-10Actualizado a 2026-03-10

Resumen

A massive bullish pennant pattern is forming on the Dogecoin (DOGE/USD) monthly chart, a development that began after the cryptocurrency's historic rally in 2021. The pattern started with a sharp "flagpole" surge that took DOGE from under $0.01 to its all-time high of $0.73. Since that peak, the price has been compressing between two converging trendlines, creating a symmetrical triangle with a series of lower highs and higher lows. The price is currently testing a critical juncture, trading near the lower, rising support trendline around $0.09. Holding this support is crucial for the pattern's validity; a monthly close below it would weaken the bullish outlook. For the pattern to confirm and trigger a significant breakout, DOGE must first push above the upper, descending trendline, which requires closing consecutive months above the $0.32 level. If a breakout occurs, the measured move target—calculated from the height of the 2021 flagpole—projects a substantial upward move. Conservative estimates suggest a target well above $1, with more optimistic projections reaching the $3 to $4 range.

Most traders are watching Dogecoin on the daily or weekly chart, reacting to intraday price action. However, the monthly candlestick chart tells a different story, one that has been developing since the 2021 cycle and is now approaching an inflection point.

Technical analysis shows a massive bullish pennant is forming on the DOGE/USD monthly timeframe. Dogecoin is now at a lower high support in the pennant, and the technical implications are significant.

Giant Pennant Has Been Forming Since The 2021 Rally

The monthly chart shows Dogecoin’s price compressing between two converging trendlines, forming what appears to be a large bullish pennant. The structure begins with the flagpole: the near-vertical surge that launched Dogecoin from below $0.01 to its all-time high of $0.73 in May 2021.

Since that peak, DOGE’s price action has been forming a symmetrical triangle on the monthly chart, a series of lower highs and higher lows converging steadily toward an apex. The upper boundary slopes downward from the peak reached during the 2021 surge, creating a descending resistance line that has rejected several major rallies since then.
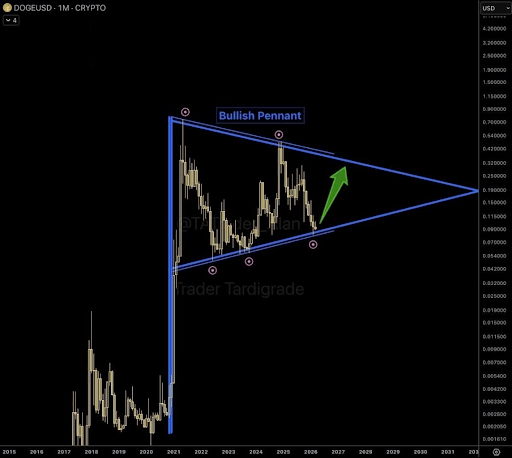
Source: Chart from TheMoonHailey on X

The lower boundary, on the other hand, rises gradually from the base that formed once the previous rally cooled to create a higher low. The lower trendline has provided consistent support, and critically, it held last month when the price tested the $0.08 zone.

As shown in the Dogecoin monthly candlestick chart below, these two lines have created a triangular formation that has continued to narrow since 2021. Multiple turning points on the chart show price reacting precisely at these boundaries, and the structure has been respected repeatedly over time.

Here’s What To Expect From The Bullish Pennant

One of the most important details in the chart is the most recent interaction with the lower trendline. Dogecoin dipped to the rising support boundary in February and bounced. That rebound occurred around the same area where Dogecoin has been trading recently, just below the $0.09 level.

At the time of writing, Dogecoin is trading at $0.094, still close to the support. Holding this support and closing above it in March is important for the structure because a bullish pennant depends on price remaining inside the converging boundaries. If DOGE were to close the month below the lower trendline, then the bullish outlook would weaken.

On the other hand, the bullish outlook depends on Dogecoin breaking above the upper end of the bullish pennant. The measured move target of a bullish pennant is calculated from the height of the flagpole, projected from the breakout point. Given the scale of Dogecoin’s 2021 flagpole, even conservative projections point well above $1, with upper-range targets in the $3 to $4 territory.

However, there is still much work to do for DOGE to return to the upper trendline before a breakout. Particularly, Dogecoin needs to push above $0.32 and close consecutive months above this level.

DOGE trading at $0.09 on the 1D chart | Source: DOGEUSDT on Tradingview.com

Preguntas relacionadas

QWhat pattern is forming on the Dogecoin monthly chart according to the article?

AA massive bullish pennant is forming on the DOGE/USD monthly timeframe.

QWhat was the starting point (flagpole) of this bullish pennant pattern?

AThe flagpole was the near-vertical surge that launched Dogecoin from below $0.01 to its all-time high of $0.73 in May 2021.

QWhat is the critical support level that Dogecoin recently tested and held?

ADogecoin recently tested and held the support at the lower trendline around the $0.08 zone in February.

QWhat is the significance of Dogecoin closing a month above the $0.32 level?

AClosing consecutive months above the $0.32 level is necessary for Dogecoin to push towards the upper trendline and attempt a breakout from the pennant.

QWhat is the potential price target if the bullish pennant pattern completes with a successful breakout?

AThe measured move target, based on the height of the 2021 flagpole, points well above $1, with upper-range targets in the $3 to $4 territory.

Lecturas Relacionadas

In Jinjiang, Fujian, a Storage Super Unicorn Lies Quiet

In Fujian's Jinjiang, a city known for sportswear, lies a quiet semiconductor giant: Fujian Jinhua Integrated Circuit Co. (JHICC). Once a promising domestic DRAM manufacturer alongside Yangtze Memory and ChangXin Memory Technologies (CXMT), its journey was derailed in 2018 when the U.S. placed it on an Entity List and filed criminal charges for alleged trade secret theft. This halted production for years. A turning point came in February 2024 when a U.S. federal court found JHICC not guilty. However, it had lost crucial time. While CXMT soared to become a top-valued A-share company in 2024, JHICC, with an estimated valuation of 80 billion RMB, was just restarting. Its current output is primarily customized DDR4 chips, not the advanced DDR5/HBM demanded for AI, but it still benefits from the broader memory chip upcycle. JHICC's story is tied to Chen Zhengkun, a veteran engineer who left Micron to lead the venture. Founded in 2016 with state-backed funding, JHICC partnered with Taiwan's UMC to develop DRAM technology. Rapid progress was cut short by the U.S. actions, which Micron initiated, partly due to its heavy reliance on the Chinese market. Post-sanctions, Chen's team worked to rebuild the production line with reduced reliance on U.S. technology. According to its records, JHICC achieved small-scale production and revenue growth under immense pressure. It now focuses on the stable "niche" DRAM market (e.g., TVs, routers) with a monthly capacity of ~40,000 wafers, aiming for 60,000 by 2026. It holds over 1,000 patents but remains on the Entity List. For Jinjiang, investing in JHICC was a bold industrial leap. The local government provided unwavering financial and logistical support during the crisis, helping the company survive. JHICC has become the anchor for a growing local semiconductor cluster. Though its scale lags behind domestic peers, JHICC's persistence symbolizes a hard-won foothold in a global market long dominated by Samsung, SK Hynix, and Micron. Having missed one boom, it seeks a place in the new AI-driven memory supercycle.

marsbitHace 1 hora(s)

In Jinjiang, Fujian, a Storage Super Unicorn Lies Quiet

marsbitHace 1 hora(s)

Trading

Spot
活动图片