
A $20 Million Loss Lesson: For Buying the Dip in U.S. Stocks, Just Remember These 'Three Dos and Three Don'ts'

marsbitPublicado a 2026-02-14Actualizado a 2026-02-14

Resumen

"Losing 20 Million: A Painful Lesson on Bottom-Fishing in the U.S. Stock Market — Remember the 'Three Dos and Three Don'ts'" The author shares hard-earned insights after significant losses, concluding that while timing the peak is crucial for A-shares, bottom-fishing is key for U.S. stocks. The U.S. market's long-term upward trend makes buying the dip a core strategy, though it is psychologically challenging for many investors accustomed to A-shares' volatility. The article defines market corrections into three levels based on decline magnitude and duration: daily (5%+ drop or 2+ weeks), weekly (10%+ or 4+ weeks), and monthly (15%+ or 4+ months). Only 7 monthly corrections occurred in the S&P 500 over 20 years, each driven by macro events like rate hikes or crises. The core of U.S. stock bottom-fishing is a disciplined, batched approach. The "Three Dos and Three Don'ts" are: 1. Do plan batched entries; don’t make impulsive trades. 2. Prioritize "buying enough" over "buying cheap." 3. Use time-based batches (e.g., buying every few weeks) over price-based batches. For weekly corrections, a three-batch plan over ~10 weeks is suggested. For rarer monthly corrections, a 6-month plan with decreasing batch sizes (1/2, 1/3, 1/6) is advised. The strategy assumes the market’s long-term growth and relatively low volatility. The article also categorizes downturns: natural pullbacks, valuation-driven adjustments, and systemic crises (e.g., 2008, 2020). While black swan events are unp...

Author: SOL, the Unfathomable

After losing $20 million, I finally understood the probabilities of investing: for A-shares, the most important thing is to exit at the top; for U.S. stocks, the most important thing is to buy the dip.

Exiting the top in A-shares, especially a major top, is both the easiest and the most difficult. It's easy because the top of A-shares is typically a peak of euphoria; in hindsight, the word "major top" is almost written on the chart.

It's difficult because A-shares only make money when going long, and the stock market generally rises over the long term. Exiting the top locks in profits but doesn't make money by itself, and human nature is inherently greedy.

In contrast, the most important thing for U.S. stocks is to buy the dip. Looking at the market over the past 20 years, buying on every dip has been the most important investment rule.

One could say that for money already invested, it's simply a matter of holding on; the key is when to buy the dip with new money? And for investing in U.S. stocks, the easiest and most difficult thing is also buying the dip.

It's easy because buying the dip in U.S. stocks means "buy a little on small dips, buy a lot on big dips, don't buy when there's no dip."
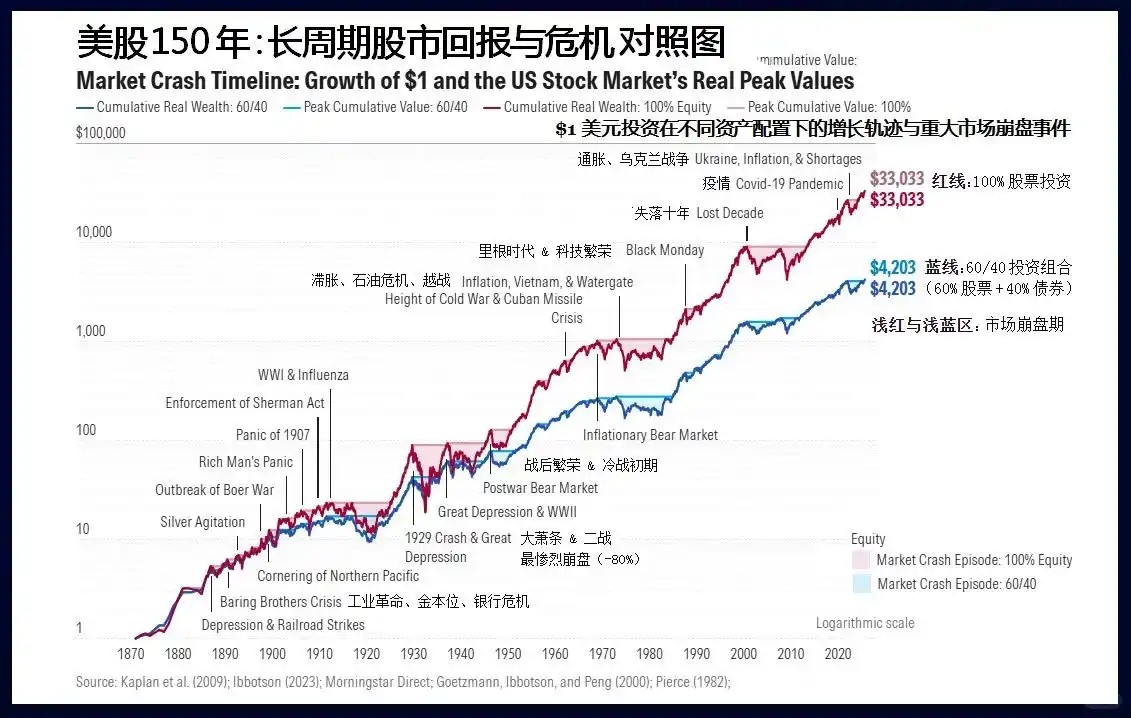
Since 1776, everyone who has bet against America has ultimately ended in their own miserable failure.

It's most difficult because most people come from A-shares, where they've experienced "buying the dip halfway down the mountain," suffering from "dip-buying PTSD syndrome." They always want to buy lower to give themselves some safety cushion, resulting in not daring to buy during the dip and then chasing the rebound.

Therefore, when a dip-buying opportunity arises in U.S. stocks, everyone must clarify two questions:

1. Under normal circumstances, how much does a typical U.S. stock correction fall?

2. If a black swan event occurs and the fall seems endless, what should be done?

1. How deep are U.S. stock corrections? First, let's define what a "correction" is.

Corrections are usually divided into three levels: daily, weekly, and monthly. A round of decline must meet one of two conditions: magnitude or duration (everyone's definition may differ; this article only represents my standard).

  • Daily level: A drop of 5% or more from the highest point, or a duration of more than two weeks (referring to the time span from the highest to the lowest point);
  • Weekly level: A drop of 10% or more from the highest point, or a duration of more than 4 weeks;
  • Monthly level: A drop of 15% or more from the highest point, or a duration of more than 4 months.

Meeting one of the two conditions is sufficient. Some corrections are not deep in magnitude but drag on for a long time; others are the opposite. After clarifying the definition, buying the dip essentially has two goals:

  • Goal one: Buy all the positions you want
  • Goal two: Buy as cheaply as possible

Market trends are always clear in hindsight but confusing in real-time. When a correction is happening, we can only be sure of two things—how much it has fallen from the previous high to today, and how many days it has been falling?

It could continue to fall, consolidate, or start rising again.

So these two goals conflict. Buying too quickly might achieve goal one but at a higher price;

But if you only focus on buying cheap, you might miss out and the price could rise without you.

This requires us to have a probabilistic understanding of the magnitude of corrections in the historical trends of U.S. stocks to set a reasonable goal.
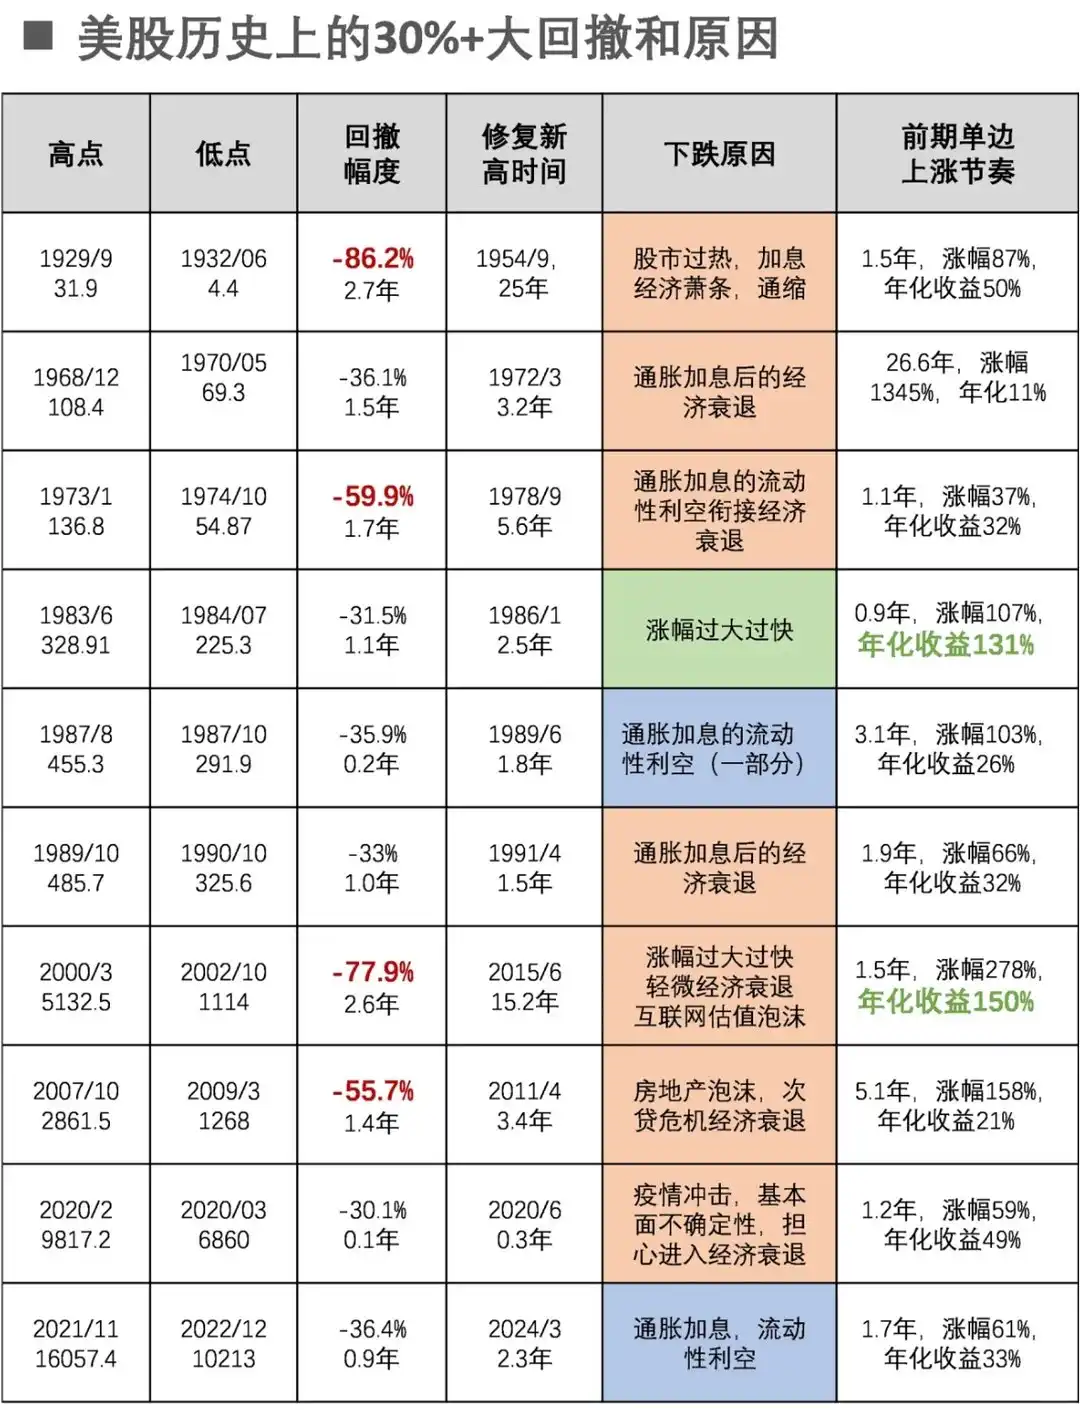
Major Drawdowns of 30%+ in U.S. Stock History and Their Causes

Taking the S&P 500 Index as an example, there have been only 7 monthly-level corrections in the past 20 years since 2004, with reasons分别为:

  • Jan-Oct 2022: The most aggressive interest rate hike cycle in 40 years
  • Feb-Mar 2020: Global public health event
  • Sep-Dec 2018: Trade war combined with interest rate hikes
  • Jul 2015 - Feb 2016: Chinese economic slowdown combined with interest rate hike expectations
  • Apr-Sep 2011: Deepening European debt crisis
  • Apr-Jun 2010: European debt crisis and Goldman Sachs fraud scandal
  • Oct 2007 - Mar 2009: Subprime mortgage crisis

So monthly-level corrections in U.S. stocks are still very rare, occurring on average once every three years, each with macro-fundamental reasons. From September 2011 to July 2015, there was a 44-month period without one, a proper long bull market.

Weekly-level corrections are more frequent, happening 2-3 times a year, and don't necessarily require fundamental reasons; just rising too much can lead to a correction.

Therefore, when buying the dip, the first thing to judge is whether this is a weekly-level or a monthly-level correction?

But stock movements are influenced by various new pieces of information, making accurate prediction difficult. The Fed isn't your family's business; negative and positive news won't arrive according to your plan—fortunately, you can still decide your own goal.

You need to think about a question, imagine it's haggling with a vendor: if you can only choose one goal between "buying" and "buying cheaply," which do you choose?

If it's the former, you should assume the correction is weekly-level and plan accordingly. This way, even if it turns out to be a monthly-level correction, you can still complete your first goal. Similarly, if your goal is "buying cheaply," you should prepare a dip-buying plan for a monthly-level correction.

However, generally, I recommend making "buying" the primary goal, especially when you have idle cash. First, because monthly-level corrections occur only every three years, the probability is indeed low. Second, with idle cash, if you don't buy U.S. stocks, you might end up buying other high-risk products.

With a goal, the plan becomes much simpler.

2. Time Plan vs. Price Plan: The First Question in Buying U.S. Stock Dips—When to Start the Plan?

Taking a weekly-level correction's dip-buying as an example, as long as it doesn't hit a new high for two weeks, a daily-level correction is already happening, and you should prepare a dip-buying plan for a weekly-level correction.

The core of buying U.S. stock dips is two words—scale in.
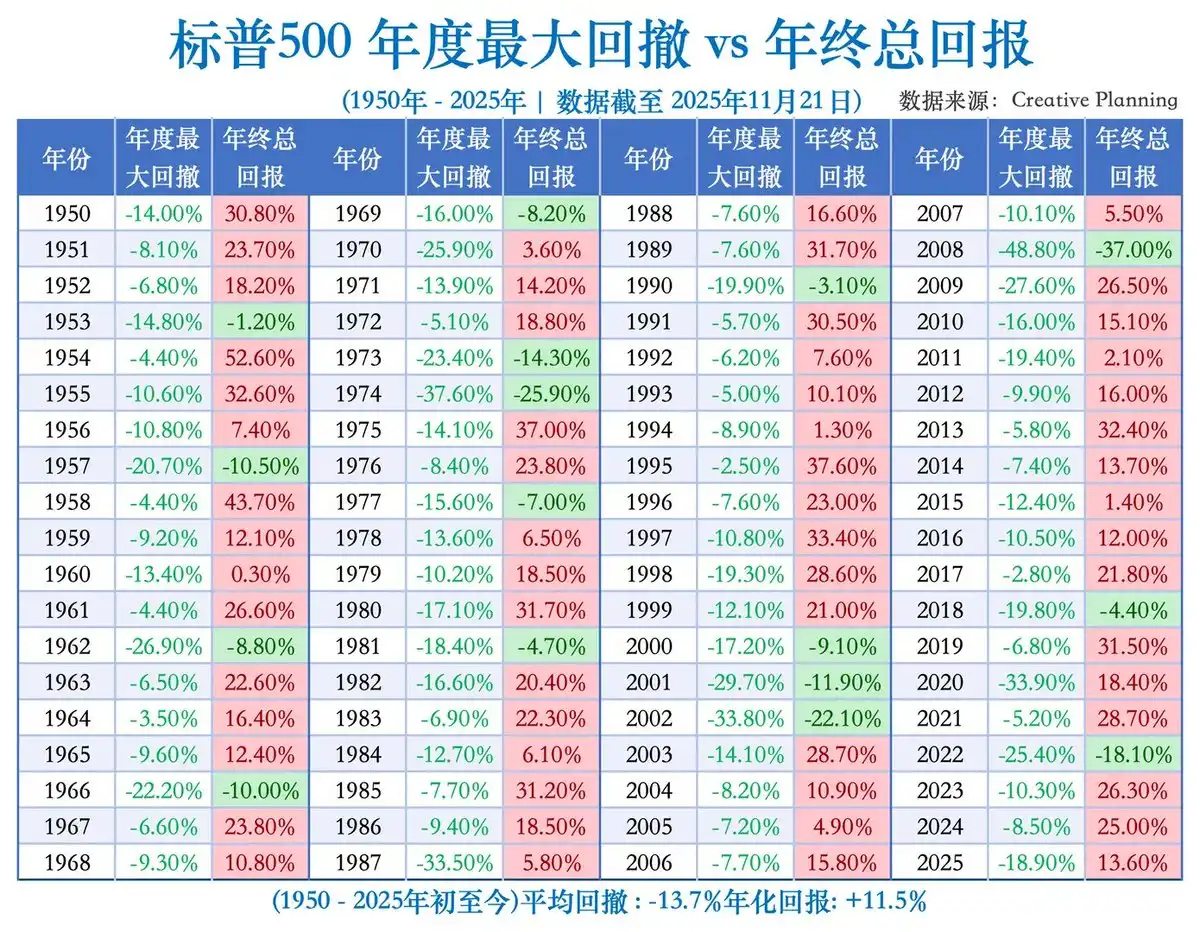
There are two types of scaling-in plans: one is time-based scaling, buying at fixed time intervals; the other is price-based scaling, buying when the price falls to certain levels. Based on the trends of the past 20 years, for weekly-level corrections (excluding monthly-level ones), the average time from high to bottom is 10 weeks. Thus, time-based scaling can be divided into three batches: starting from the high, buy the dip every three weeks afterward, with a longer interval between the second and first batches.

Price-based scaling can also be divided into three batches, buying one batch at a 3% drop from the high. If the maximum drop is 10%, the entire dip-buying plan can be completed.

The completion probabilities of these two plans differ. The time plan can generally be completed unless it's only a daily-level correction that quickly hits new highs—which isn't regrettable, as you've at least seized a daily-level correction opportunity to add positions.

But the price-based plan might not be completed. Many weekly-level corrections in U.S. stocks only last longer without reaching a 10% drop.

For weekly-level corrections, with "completing the dip buy" as the primary goal, "time-based scaling" should be prioritized. Even if the drop hasn't reached the target, once the correction time arrives, execute the scaling-in plan.

Now, considering a dip-buying plan targeting monthly-level corrections: the average time to bottom is 6.5 months, but it varies greatly. So, adopt the mindset of "probably won't complete the buy" and buy as much as possible.

Don't average the position sizes; instead, use a front-heavy approach: three batches at 1/2, 1/3, and 1/6 of the total plan.

The time plan can be batched as: first month, third month, sixth month. The price plan can be batched as: 3% drop, 8% drop, 15% drop. Often, when you target a "monthly-level" correction, you end up completing a weekly-level correction's dip-buying plan but with insufficient volume. Hence, I initially suggest focusing on the weekly-level correction plan as much as possible.

Buying U.S. stock dips can be simply summarized as three dos and three don'ts:

1. Do make a scaling-in plan; don't make random decisions or trade impulsively during the session;

2. Prioritize "buying enough" over "buying cheaply";

3. Prioritize "time-based scaling" over "price-based scaling." Buying U.S. stock dips is a very mechanical plan, and the premise of this plan is the long-term upward and relatively low-volatility trend of U.S. stocks.

But the stock market is ultimately a place of human博弈, and economic operations themselves are unpredictable. Black swan events can happen at any time and will inevitably happen.

If the correction's duration or depth exceeds the plan, how should you respond? If a black swan event occurs, what should be done?

3. Black Swan Events

The above corrections are divided into monthly and weekly levels, which has the advantage of clear standards. But even among monthly-level corrections, differences are significant. For instance, 2008 and 2020 were actually economic crises, not mere stock market corrections.

Thus, market adjustments can also be categorized into three types based on causes:
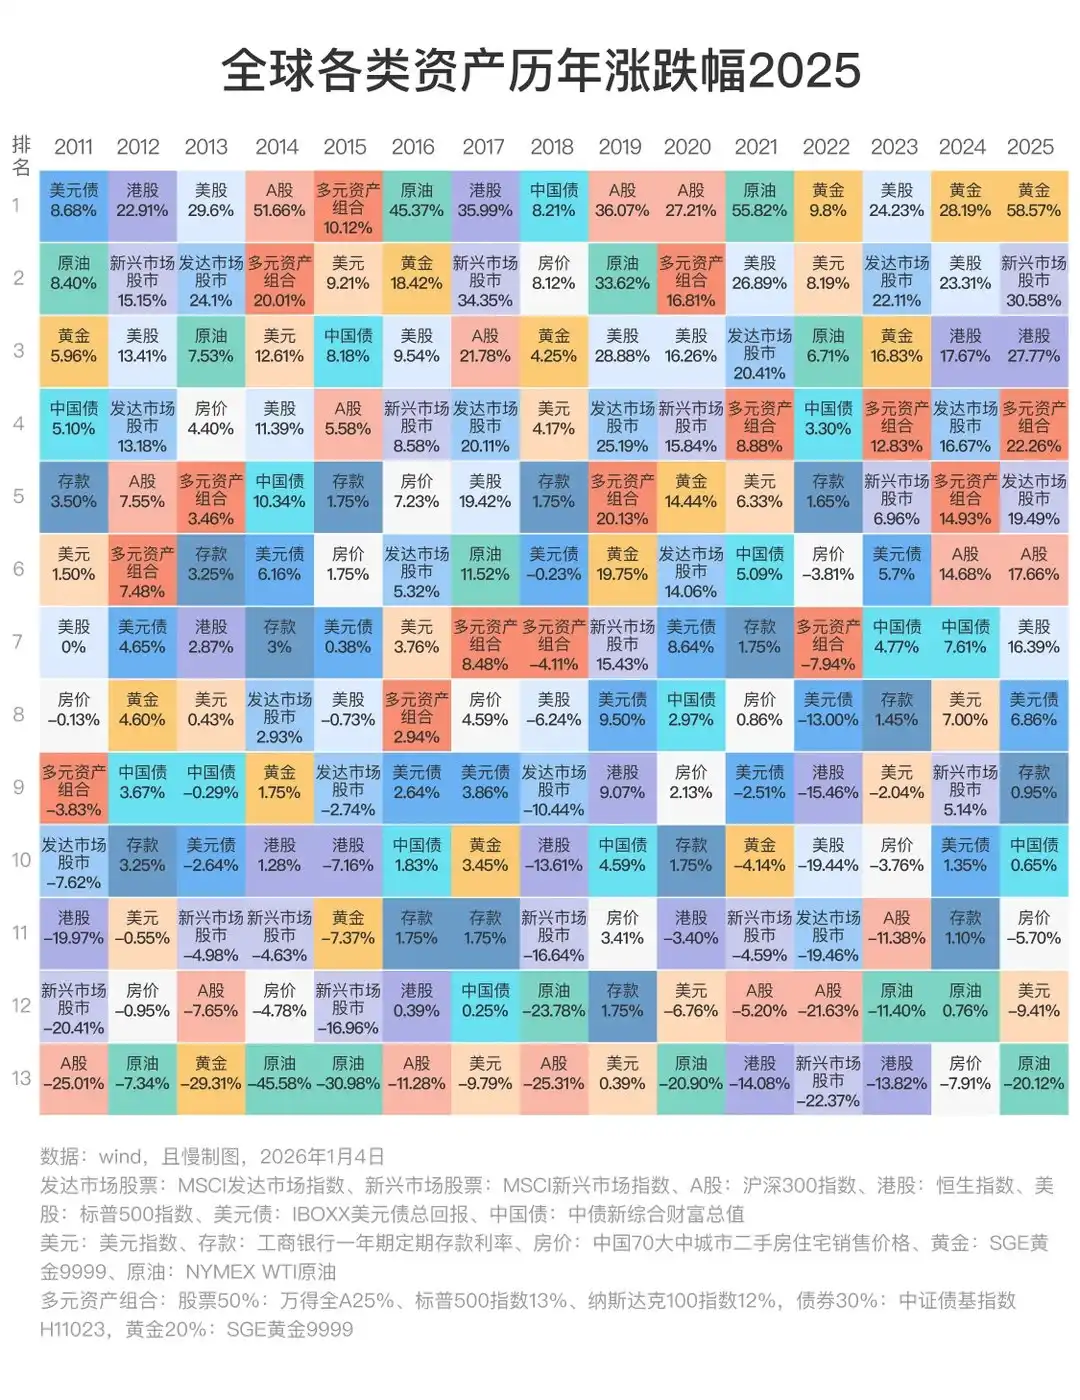
1. Natural correction due to excessive cumulative gains, but macro fundamentals are generally positive—Most daily and weekly-level corrections fall into this category.

2. Correction due to overvaluation combined with economic recession or a shift to hawkish monetary policy—A minority of weekly and most monthly-level corrections belong here.

3. Economic crisis or major recession caused by systemic risk—A minority of monthly-level corrections or long-term bear markets fall into this category.

In the past 20 years, the 2008 subprime crisis and the 2020 public health event belong to the third type. The former fell 58% in over a year; the latter fell 35% in two months. So the third situation exceeds our dip-buying plan and requires separate analysis.

However, crises and corrections are indistinguishable at the beginning. When U.S. stocks started falling in 2007, the market thought it was an economic recession. After the Fed began cutting rates, the market rebounded. By early 2008, investors were already buying the dip aggressively.

Therefore, during the dip-buying process, continuously observe whether new events have occurred initially or whether the initial causes of the decline have worsened.

Taking recent deep declines as examples: A standard bear market like the 27% drop in 2022 is actually the easiest to judge. It's driven by standard macro logic; everyone is discussing rate hikes; all prices are soaring; every month, data tells you it's worse than the last. At most, you might have losses at the initial confirmation of the dip buy; later, you'll naturally know it's a protracted battle, requiring an extended dip-buying timeline.

A "once-in-a-lifetime" crash like the 36% drop in one month during the 2020 public health event, triggered by non-economic black swan factors, is indeed panic-inducing short-term, but once it's over, it's over. In this case, you can only endure.

The most difficult was the 58% drop during the 2008 financial crisis, which was a mix of the above two situations. A crisis event during an ordinary recession triggered a deep recessionary bear market. It couldn't be predicted, only responded to.

Going further back, the 2000 dot-com bubble burst was a rare暴跌 caused by excessive valuation, which in turn dragged down the economy. But the valuation levels then were much, much higher than now. It was a discernible gray rhino event, but no one wanted to "get off first."

Synthesizing these types of U.S. stock declines, you'll find that it's best not to predict U.S. stock declines in advance. The most important thing is to face reality and respond after it happens; the sky won't fall.

Of course, having no expectations and making timely and correct responses after the fact requires you to pay attention to the market. You can't just allocate like wealth management without management. You still need to assess, after a certain stage of decline, whether it might evolve into a crisis.


Criptos en tendencia

Preguntas relacionadas

QWhat are the 'three dos and three don'ts' for bottom-fishing in the U.S. stock market as summarized in the article?

AThe three dos and three don'ts are: 1. Do make a batch plan; don't make random decisions or emotional trades during the session. 2. Prioritize 'buying enough' over 'buying cheap'. 3. Prioritize 'time-based batching' over 'price-based batching'.

QAccording to the author, what is the most important rule for investing in U.S. stocks over the past 20 years?

AThe most important investment rule for U.S. stocks over the past 20 years is to buy on every dip.

QHow does the article define a monthly-level correction for the U.S. stock market?

AA monthly-level correction is defined as a drop of 15% or more from the highest point, or a time span lasting 4 months or more from the peak to the trough.

QWhat are the only two things one can be sure of during a market correction, as stated in the article?

ADuring a market correction, the only two things one can be sure of are how much it has fallen from the previous high to the present day and how many days it has been falling.

QWhat are the three types of market adjustments classified by cause in the article?

AThe three types are: 1. Natural adjustments due to excessive cumulative gains, with macro fundamentals generally sound. 2. Adjustments caused by overvaluation combined with an economic recession or a shift to hawkish monetary policy. 3. Economic crises or major recessions caused by systemic risks.

Lecturas Relacionadas

After Three Consecutive Quarters of Decline, Can the Crypto Market Find a Window for Stabilization in Q3?

The cryptocurrency market has just concluded its worst-performing quarter since 2022, with total capitalization dropping 12.6% to $2.1 trillion. All core metrics indicate capital is leaving the sector, not just rotating within it. Bitcoin fell 14.2% and Ethereum dropped 25.4% in Q2, breaking their previous correlation with US tech stocks. A key driver is the reversal in US spot Bitcoin ETF flows, which saw a net outflow of approximately $4.67 billion in Q2, including a record monthly outflow near $4.5 billion in June. While recent data suggests long-term holders are accumulating again, sustained ETF outflows mean continued selling pressure. Market focus is now singularly on the Federal Reserve. The upcoming July FOMC meeting is seen as the most critical event for Q3. A dovish signal could support Bitcoin reclaiming a $68,000-$84,000 range, while a hawkish stance might establish a new trading band around $50,000-$56,000. Additionally, regulatory uncertainty persists, with the progress of the crucial *CLARITY Act* stalling in the Senate, reducing its perceived 2026 passage probability to 40-45%. Despite the broad downturn, a few sectors showed growth. Prediction markets saw nominal volume surge 48.7% year-over-year to $113.8 billion, and tokenized collectibles transaction volume rose 143% quarterly to $1.4 billion. The Real-World Asset (RWA) tokenization sector also continued steady growth, now representing ~$28.1 billion in on-chain value. The market's foundation for an extreme crash appears limited, with Bitcoin price hovering near its 200-week moving average. However, the trading paradigm has shifted from narrative-driven speculation to decisions based on price action, policy developments, and interest rate expectations, making a broad sentiment-driven rally unlikely in the near term.

marsbitHace 14 hora(s)

After Three Consecutive Quarters of Decline, Can the Crypto Market Find a Window for Stabilization in Q3?

marsbitHace 14 hora(s)

BIT Trading Moment: BTC Still Suppressed by Weekly 200 EMA, Rejection May Restart Decline; Storage and Semiconductors that Surged Last Night Begin Falling in Evening Trading

**Crypto & Stock Market Wrap: Bitcoin Tests Resistance, Stocks Retreat After AI Surge** Bitcoin consolidates around $66,000, facing key resistance near $68,000—an area seen as a major psychological and technical hurdle where previous rallies have failed. Analysts note the cryptocurrency is caught between its 200-week moving average (~$63,333) and 200-week EMA (~$68,328). A clear break above $68k is needed to signal a stronger bullish trend, while a rejection could lead to a retest of $63k support. Market sentiment remains cautious, with low futures open interest pointing to a low-liquidity rebound rather than a full bull market. Bitcoin spot ETFs saw another $203 million inflow. US stock futures pointed lower after a strong Tuesday session led by a massive rebound in semiconductors and memory stocks. The rally was fueled by renewed optimism about AI-driven hardware demand, with Micron, SanDisk, and SK Hynix surging. However, those gains reversed in pre-market trading. Super Micro Computer (SMCI) soared over 20% after hours on strong guidance and a record backlog. Other standouts included Rocket Lab and nuclear energy plays Oklo and X-Energy. Rising oil prices (Brent above $91) and climbing Treasury yields (10-year near 4.64%), however, are reigniting inflation concerns and acting as a headwind for equities. In Asia, markets were mixed. South Korea's KOSPI pared early gains to close slightly higher as semiconductor stocks like SK Hynix gave back initial surges. Japan's Nikkei edged lower as the yen hit a fresh 38-year low against the dollar, raising fears of potential market intervention. Key events to watch include the Samsung Galaxy launch, AMD's AI event, and a slew of major tech earnings from Alphabet, Tesla, and IBM after the close on Wednesday, followed by the ECB meeting and Intel's earnings on Thursday.

marsbitHace 14 hora(s)

BIT Trading Moment: BTC Still Suppressed by Weekly 200 EMA, Rejection May Restart Decline; Storage and Semiconductors that Surged Last Night Begin Falling in Evening Trading

marsbitHace 14 hora(s)

Former CFTC Chairman, Circle President Tarbert: Preaching Long-Termism While Cashing Out $30 Million Himself

Former CFTC Chairman and Circle President Heath Tarbert has consistently advocated for a long-term vision in public, urging patience from investors as Circle’s stock price has fallen significantly from its peak. However, it has been revealed that since Circle’s IPO, Tarbert has continuously sold his CRCL shares through pre-arranged trading plans, cashing out approximately $30 million, without making any public market purchases. This contrast between his public messaging and personal actions has drawn criticism. Tarbert joined Circle in July 2023 as Chief Legal Officer, leveraging his regulatory experience to help guide the company through its IPO and expansion. Despite promoting stablecoins as long-term infrastructure, he established a 10b5-1 trading plan just before Circle went public, leading to substantial stock sales over the following year. In March 2026, he initiated another plan to sell more shares. His career trajectory highlights a pattern of moving between high-level regulatory roles and influential positions in the financial sector. After resigning as CFTC Chairman in early 2021, he joined Citadel Securities as Chief Legal Officer just 27 days later, during a period of intense regulatory scrutiny for the firm. He later joined Circle, aiding its efforts to navigate regulatory challenges for its public listing. While Tarbert's expertise in policy and compliance is valuable to companies like Circle, his actions—advocating long-term confidence while personally divesting—raise questions about the alignment between his public statements and his private financial decisions, leaving investors who followed his advice to bear the market risks.

marsbitHace 14 hora(s)

Former CFTC Chairman, Circle President Tarbert: Preaching Long-Termism While Cashing Out $30 Million Himself

marsbitHace 14 hora(s)

Gate Research Institute: The 'Wall Street-ization' Wave of Crypto Financial Products – Competition or Integration?

The article titled "Gate Research Institute: Are Crypto Financial Products Sparking a 'Wall Street' Wave—Competition or Convergence?" explores the evolving relationship between the crypto ecosystem and traditional finance (TradFi). The piece begins by reflecting on Bitcoin's original 2009 vision of decentralization, disintermediation, and moving away from banks. It then contrasts this with the 2024 landscape, where key crypto assets like Bitcoin are increasingly held through Wall Street products like ETFs issued by giants like BlackRock. The article questions whether this signifies that TradFi is systematically taking over the rights to issue, price, custody, and distribute crypto financial assets. The core argument is that this is not a zero-sum takeover but rather a bidirectional convergence where each side addresses the other's weaknesses. Crypto offers 24/7 global markets, programmable settlement, and open access but lacks compliant channels, institutional-grade custody, deep fiat liquidity, and mainstream distribution. TradFi possesses these but is constrained by legacy systems, limited operating hours, and slow settlement. Two primary convergence paths are highlighted: * **Path A (CEX to TradFi):** Exemplified by Gate, which has progressed from offering tokenized stocks and CFDs to providing direct, real stock trading (US, Hong Kong, South Korea) within its platform, using USDT. * **Path B (TradFi to Crypto):** Exemplified by Robinhood, which has integrated crypto trading, acquired exchanges like Bitstamp, and is moving traditional assets like stocks onto the blockchain via tokenization and its own Layer 2. Both paths are ultimately competing to become the next-generation, unified financial account—a "super account" where users can seamlessly trade cryptocurrencies, stocks, ETFs, RWA (Real World Assets), and tokenized treasury products in one interface. The growth of RWA and tokenized treasuries (e.g., BlackRock's BUIDL) is presented as the asset-layer fusion, providing stable, yield-bearing assets on-chain and acting as a bridge between the two worlds. In conclusion, the "Wall Street-ization" of crypto is framed as a mutual transformation. Decentralized ideals persist in the protocol layer, while at the application layer, a more efficient, global, and accessible unified capital market is emerging from this convergence. The future competition lies not between crypto exchanges and stockbrokers, but between platforms vying to offer the most comprehensive asset coverage, liquidity, and user experience within a single account.

marsbitHace 14 hora(s)

Gate Research Institute: The 'Wall Street-ization' Wave of Crypto Financial Products – Competition or Integration?

marsbitHace 14 hora(s)

Trading

Spot

Artículos destacados

Qué es SOLANA

HarryPotterWifHatMyroWynn10Inu,$solana: Un Análisis del Trendy Meme Coin Project Introducción En el paisaje en constante evolución de las criptomonedas, proyectos innovadores emergen continuamente, capturando la imaginación de inversores y entusiastas por igual. Uno de estos proyectos es HarryPotterWifHatMyroWynn10Inu,$solana, una meme coin que ha comenzado a tallar su nicho dentro de la comunidad cripto. Este artículo tiene como objetivo proporcionarte una visión completa del proyecto, elucidando su propósito, arquitectura, creador, inversores y hitos notables a lo largo del viaje. ¿Qué es HarryPotterWifHatMyroWynn10Inu,$solana? Resumen HarryPotterWifHatMyroWynn10Inu,$solana es un proyecto de meme coin estructurado en la blockchain de Solana, una plataforma reconocida por su escalabilidad y velocidad. Con el objetivo de traer alegría y creatividad al espacio cripto, este proyecto no solo sirve como un token de intercambio, sino también como un catalizador para la generación y el intercambio de contenido de memes. La comunidad en su núcleo es alentada a participar activamente, proporcionando un ecosistema dinámico donde la creatividad y la colaboración prosperan. Metas y Objetivos En su esencia, el proyecto tiene como objetivo fomentar un ambiente donde los entusiastas de los memes puedan congregarse, compartir y crear contenido de memes novedoso. Este enfoque impulsado por narrativas infunde emoción dentro de la comunidad, impulsando el compromiso mientras simultáneamente arroja luz sobre las robustas funcionalidades inherentes a la blockchain de Solana. Al construir un proyecto centrado en la comunidad, HarryPotterWifHatMyroWynn10Inu,$solana también desea explorar el impacto social de las monedas digitales como un medio de expresión. ¿Quién es el Creador de HarryPotterWifHatMyroWynn10Inu,$solana? La identidad del creador detrás de HarryPotterWifHatMyroWynn10Inu,$solana permanece rodeada de misterio. El proyecto ha sido estructurado de tal manera que se ha renunciado a la propiedad; por lo tanto, prospera como una iniciativa liderada por la comunidad. Esta descentralización promueve la transparencia y la participación democrática entre todos los interesados involucrados. Tal enfoque es cada vez más popular en el mundo de las meme coins, donde el compromiso de la comunidad reina supremo. ¿Quiénes son los Inversores de HarryPotterWifHatMyroWynn10Inu,$solana? Hasta ahora, no hay información públicamente disponible acerca de los inversores específicos o fundaciones que respaldan HarryPotterWifHatMyroWynn10Inu,$solana. La ausencia de inversores conocidos enfatiza aún más la ética orientada a la comunidad del proyecto, ya que se mantiene independiente de los marcos financieros tradicionales. Esta independencia permite que el proyecto desarrolle su identidad libre de presiones externas, confiando en cambio en el interés colectivo de su base de usuarios. ¿Cómo Funciona HarryPotterWifHatMyroWynn10Inu,$solana? Modelo Económico El proyecto emplea un modelo económico único que fundamenta su funcionalidad y engagement de usuarios. Las transacciones dentro de HarryPotterWifHatMyroWynn10Inu,$solana están diseñadas para ser beneficiosas para todas las partes involucradas. Cada operación incurre en una tarifa, que se redistribuye entre los actuales poseedores, al mismo tiempo que se impulsa el fondo de liquidez. Los componentes clave de este modelo incluyen: Mecanismo de Reflexión: Una porción de las tarifas de transacción se devuelve a los poseedores, promoviendo la inversión a largo plazo en el token. Adquisición de Fondo de Liquidez: Los fondos se asignan para mejorar la liquidez, asegurando que las operaciones de compra y venta se puedan ejecutar sin problemas. Mecanismos de Quema: Una porción de los tokens puede ser quemada para crear escasez, potencialmente aumentando su valor a medida que la demanda aumenta. Este diseño fomenta un ecosistema autosostenible que prospera a partir de interacciones comunitarias e inversión. Compromiso de la Comunidad En el corazón de HarryPotterWifHatMyroWynn10Inu,$solana está el valor atribuido al compromiso de la comunidad. Al permitir que los usuarios participen en el desarrollo del proyecto a través de diversas actividades, como la creación de memes y promociones, el proyecto fomenta un ecosistema vibrante donde la creatividad puede florecer. Línea de Tiempo de HarryPotterWifHatMyroWynn10Inu,$solana La trayectoria de HarryPotterWifHatMyroWynn10Inu,$solana presenta varios eventos notables que han moldeado su posición actual en la comunidad cripto: Creación: La fecha específica de creación permanece no divulgada, pero la aparición del proyecto está arraigada en la cultura meme que permea la era digital. Toma de Control de la Comunidad: Tras la renuncia de propiedad por parte de su creador, el proyecto transicionó a un modelo liderado por la comunidad, permitiendo que todos los participantes tuvieran un interés en su éxito. Auditoría y Colección de NFT: En un intento por fortalecer su credibilidad, el proyecto completó una auditoría exhaustiva, lanzando simultáneamente una colección de NFT que sirve para encarnar su ética centrada en los memes. Asociaciones y Desarrollo: El proyecto está actualmente en proceso de buscar asociaciones potenciales con otros tokens y organizando el desarrollo de un sitio web único y opciones de merchandising basadas en sus memes legendarios. Puntos Clave En resumen, HarryPotterWifHatMyroWynn10Inu,$solana se erige como un jugador notable dentro del sector de meme coins de las criptomonedas. Aquí hay algunos de los puntos clave: Iniciativa Liderada por la Comunidad: El proyecto prospera como un esfuerzo colaborativo, fomentando contribuciones activas de los miembros de su comunidad mientras se desacopla de reclamos de propiedad. Modelo Económico Innovador: Utilizando mecanismos de reflexión, adquisición de liquidez y quema, crea un entorno financiero robusto y atractivo para los usuarios. Compromiso con NFT y Mercancía: Con el lanzamiento de una colección de NFT, el proyecto busca profundizar el compromiso en su comunidad, reforzando el vínculo entre la cultura meme y la moneda digital. Exploración de Asociaciones: La iniciativa no es estática; el desarrollo continuo y posibles asociaciones indican un enfoque proactivo orientado al crecimiento sostenido. Conclusión A medida que HarryPotterWifHatMyroWynn10Inu,$solana continúa ganando tracción dentro del paisaje de las criptomonedas, su combinación única de compromiso comunitario, estructuras económicas innovadoras e integración de la cultura meme destaca su potencial camino hacia adelante. Incluso con el misterio que rodea sus orígenes y afiliaciones de inversionistas, el proyecto captura una historia intrigante que habla de la esencia de la innovación descentralizada. En un mundo donde las criptomonedas a menudo se ven a través de una lente puramente financiera, HarryPotterWifHatMyroWynn10Inu,$solana demuestra que el movimiento cripto incorpora creatividad, comunidad y colaboración. Ya seas un inversionista experimentado o un recién llegado, el viaje en desarrollo de este proyecto de meme coin ciertamente sirve como un estudio de caso atractivo digno de atención.

927 Vistas totalesPublicado en 2024.04.04Actualizado en 2024.12.03

Qué es SOLANA

Qué es SOLANA 2.0

BarbieCrashBandicootRFK777Inu, $SOLANA 2.0: Un Nuevo Jugador en el Paisaje Cripto Introducción a BarbieCrashBandicootRFK777Inu, $SOLANA 2.0 En el paisaje en constante evolución de las criptomonedas, nuevos entrantes están captando continuamente la atención de inversores y entusiastas por igual. Entre estos proyectos emergentes se encuentra BarbieCrashBandicootRFK777Inu, representado por el símbolo de criptomoneda $SOLANA 2.0. Esta iniciativa única combina elementos de glamour, aventura y cultura meme, proponiéndose desafiar expectativas en una arena altamente competitiva. Con aspiraciones de crecimiento e innovación, este proyecto captura el espíritu de un desvalido luchando contra gigantes establecidos. ¿Qué es BarbieCrashBandicootRFK777Inu, $SOLANA 2.0? En su esencia, BarbieCrashBandicootRFK777Inu es un proyecto de criptomonedas que se inspira en diversas referencias culturales icónicas. Incluyendo la elegancia y el encanto asociados a Barbie, la energía dinámica de Crash Bandicoot y la implacable determinación representada por RFK, el proyecto tiene como objetivo ofrecer una experiencia multifacética en el mundo de las criptomonedas. El objetivo principal del proyecto BarbieCrashBandicootRFK777Inu es fusionar estos elementos dispares en un ecosistema cohesivo que atraiga a una amplia audiencia. Al abrazar la fantasía de la cultura meme mientras se mantiene fundamentado en los principios de descentralización y empoderamiento financiero, el proyecto se ha posicionado como una opción atractiva tanto para inversores experimentados como para novatos en el mundo cripto. ¿Quién es el Creador de BarbieCrashBandicootRFK777Inu, $SOLANA 2.0? A pesar del creciente interés en BarbieCrashBandicootRFK777Inu, la información sobre su creador sigue siendo en gran parte desconocida. El anonimato de su fundador o equipo de desarrollo plantea preguntas sobre la estructura y gobernanza del proyecto. En el mundo de las criptomonedas, no es inusual que los proyectos operen sin creadores que se presenten públicamente. Esta falta de información podría disuadir a algunos inversores potenciales, mientras que otros podrían verlo como una oportunidad para abrazar el espíritu de descentralización que subyace en muchas iniciativas de criptomonedas. ¿Quiénes son los Inversores de BarbieCrashBandicootRFK777Inu, $SOLANA 2.0? Hasta ahora, hay escasa información disponible sobre las fundaciones o organizaciones de inversión que apoyan a BarbieCrashBandicootRFK777Inu. La falta de respaldo de inversión detallada del proyecto resalta la naturaleza independiente de numerosas criptomonedas. En este caso, queda por ver si el financiamiento del proyecto provendrá del apoyo comunitario de base o del respaldo de entidades financieras más grandes. ¿Cómo Funciona BarbieCrashBandicootRFK777Inu, $SOLANA 2.0? BarbieCrashBandicootRFK777Inu está diseñado con una serie de características que contribuyen a su singularidad dentro del abarrotado espacio cripto. Aunque los detalles técnicos específicos siguen siendo confidenciales, se espera que el proyecto incorpore funciones destinadas a mejorar la participación del usuario y fomentar el crecimiento de la comunidad. La combinación de influencias variadas—desde la moda y la aventura hasta los videojuegos—fomenta una atmósfera inclusiva que satisface diversos intereses. Además, los lazos del proyecto con el ecosistema $SOLANA 2.0 sugieren posibles ventajas tecnológicas. Esto podría incluir velocidades de transacción innovadoras, escalabilidad y rentabilidad, alineándose con las capacidades técnicas de la cadena de bloques Solana. Los fundadores del proyecto parecen estar aprovechando esta base tecnológica para crear una experiencia comunitaria duradera y una oferta de productos sustancial. Línea de Tiempo de BarbieCrashBandicootRFK777Inu, $SOLANA 2.0 El viaje de BarbieCrashBandicootRFK777Inu contiene varios hitos clave, proporcionando información sobre el desarrollo del proyecto hasta ahora: Conceptualización del Proyecto: Surgieron ideas iniciales en torno a la fusión de glamour, aventura y cultura meme, proporcionando el marco para el concepto único del proyecto. Creación del Token: Se estableció el token simbólico $SOLANA 2.0, diseñado para encarnar las aspiraciones del proyecto y atraer el interés de potenciales inversores. Desarrollo del Proyecto: Actualmente, el proyecto está en proceso de desarrollo adicional, con énfasis en desafiar a los jugadores establecidos en el espacio cripto y ofrecer propuestas innovadoras. Estos hitos reflejan la trayectoria de crecimiento del proyecto mientras resaltan su compromiso con el desarrollo de una experiencia de criptomonedas pionera. Puntos Clave sobre BarbieCrashBandicootRFK777Inu, $SOLANA 2.0 Concepto Único: BarbieCrashBandicootRFK777Inu se destaca por fusionar elementos de glamour, aventura y cultura meme en un solo proyecto de criptomoneda. Espíritu de Desvalido: El proyecto adopta una personalidad de desvalido, con el objetivo de desafiar a proyectos de criptomonedas establecidos y buscar un nicho en la industria. Fase de Desarrollo: Se están llevando a cabo esfuerzos activos de desarrollo, con la intención de proporcionar ofertas frescas e innovadoras en alineación con las expectativas de la comunidad y los inversores por igual. Conclusión BarbieCrashBandicootRFK777Inu, representado por el símbolo $SOLANA 2.0, es un nuevo participante intrigante en el mercado de criptomonedas. Su combinación única de referencias culturales y visión ambiciosa puede resonar con aquellos que buscan valores alternativos en el paisaje cripto. Si bien el estatus desconocido de su creador e inversores puede levantar cejas, el énfasis del proyecto en el encanto y la aventura presenta una narrativa cautivadora que expande los límites de lo que las criptomonedas pueden encarnar. A medida que el proyecto continúa desarrollándose, será interesante observar su evolución dentro del amplio paisaje cripto y cómo se posiciona entre sus competidores. Para aquellos involucrados, BarbieCrashBandicootRFK777Inu puede desbloquear experiencias sorprendentes que redefinen la interacción con los activos digitales. Por ahora, mientras el proyecto avanza, su viaje se mantiene como un recordatorio de que la innovación en el espacio cripto no conoce límites, ofreciendo todo, desde emoción y entretenimiento hasta el potencial para el empoderamiento financiero.

194 Vistas totalesPublicado en 2024.04.06Actualizado en 2024.12.03

Qué es SOLANA 2.0

Cómo comprar SOL

¡Bienvenido a HTX.com! Hemos hecho que comprar Solana (SOL) sea simple y conveniente. Sigue nuestra guía paso a paso para iniciar tu viaje de criptos.Paso 1: crea tu cuenta HTXUtiliza tu correo electrónico o número de teléfono para registrarte y obtener una cuenta gratuita en HTX. Experimenta un proceso de registro sin complicaciones y desbloquea todas las funciones.Obtener mi cuentaPaso 2: ve a Comprar cripto y elige tu método de pagoTarjeta de crédito/débito: usa tu Visa o Mastercard para comprar Solana (SOL) al instante.Saldo: utiliza fondos del saldo de tu cuenta HTX para tradear sin problemas.Terceros: hemos agregado métodos de pago populares como Google Pay y Apple Pay para mejorar la comodidad.P2P: tradear directamente con otros usuarios en HTX.Over-the-Counter (OTC): ofrecemos servicios personalizados y tipos de cambio competitivos para los traders.Paso 3: guarda tu Solana (SOL)Después de comprar tu Solana (SOL), guárdalo en tu cuenta HTX. Alternativamente, puedes enviarlo a otro lugar mediante transferencia blockchain o utilizarlo para tradear otras criptomonedas.Paso 4: tradear Solana (SOL)Tradear fácilmente con Solana (SOL) en HTX's mercado spot. Simplemente accede a tu cuenta, selecciona tu par de trading, ejecuta tus trades y monitorea en tiempo real. Ofrecemos una experiencia fácil de usar tanto para principiantes como para traders experimentados.

1.9k Vistas totalesPublicado en 2024.12.12Actualizado en 2026.06.02

Cómo comprar SOL

Discusiones

Bienvenido a la comunidad de HTX. Aquí puedes mantenerte informado sobre los últimos desarrollos de la plataforma y acceder a análisis profesionales del mercado. A continuación se presentan las opiniones de los usuarios sobre el precio de SOL (SOL).

活动图片