Over the past couple of weeks, I’ve been a bit obsessed with Vibe Coding.
Not the "I'm going to build an amazing product" kind of obsession, but a sudden realization that many of the little ideas that have been stuck in my head for so long can actually be brought to life, bit by bit.
As you all know, Vibe Coding is about using natural language to command AI to write code for you, to "craft" a product.
I mainly use a combination of Codex and the Claude Code client, describing requirements and functional modules, and they write the code for me. When I run out of quota, I switch to the CLI and continue running with the DeepSeek API.
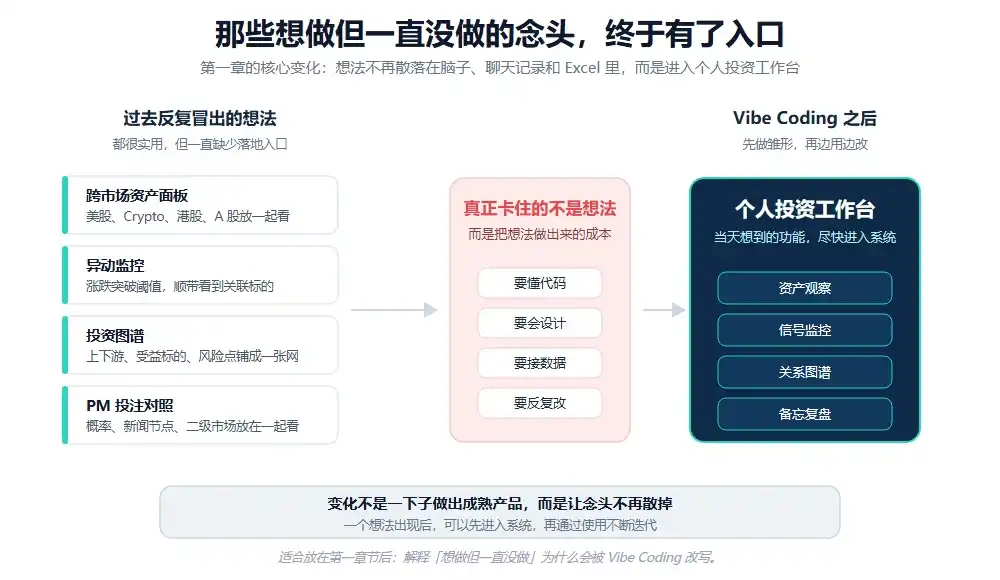
One: Those "I wanted to do it but never did" ideas
I used to have a lot of ideas pop into my head.
For example, could I have a dashboard to view assets like US stocks, Crypto, Hong Kong stocks, and A-shares all together, instead of switching between several apps every day?
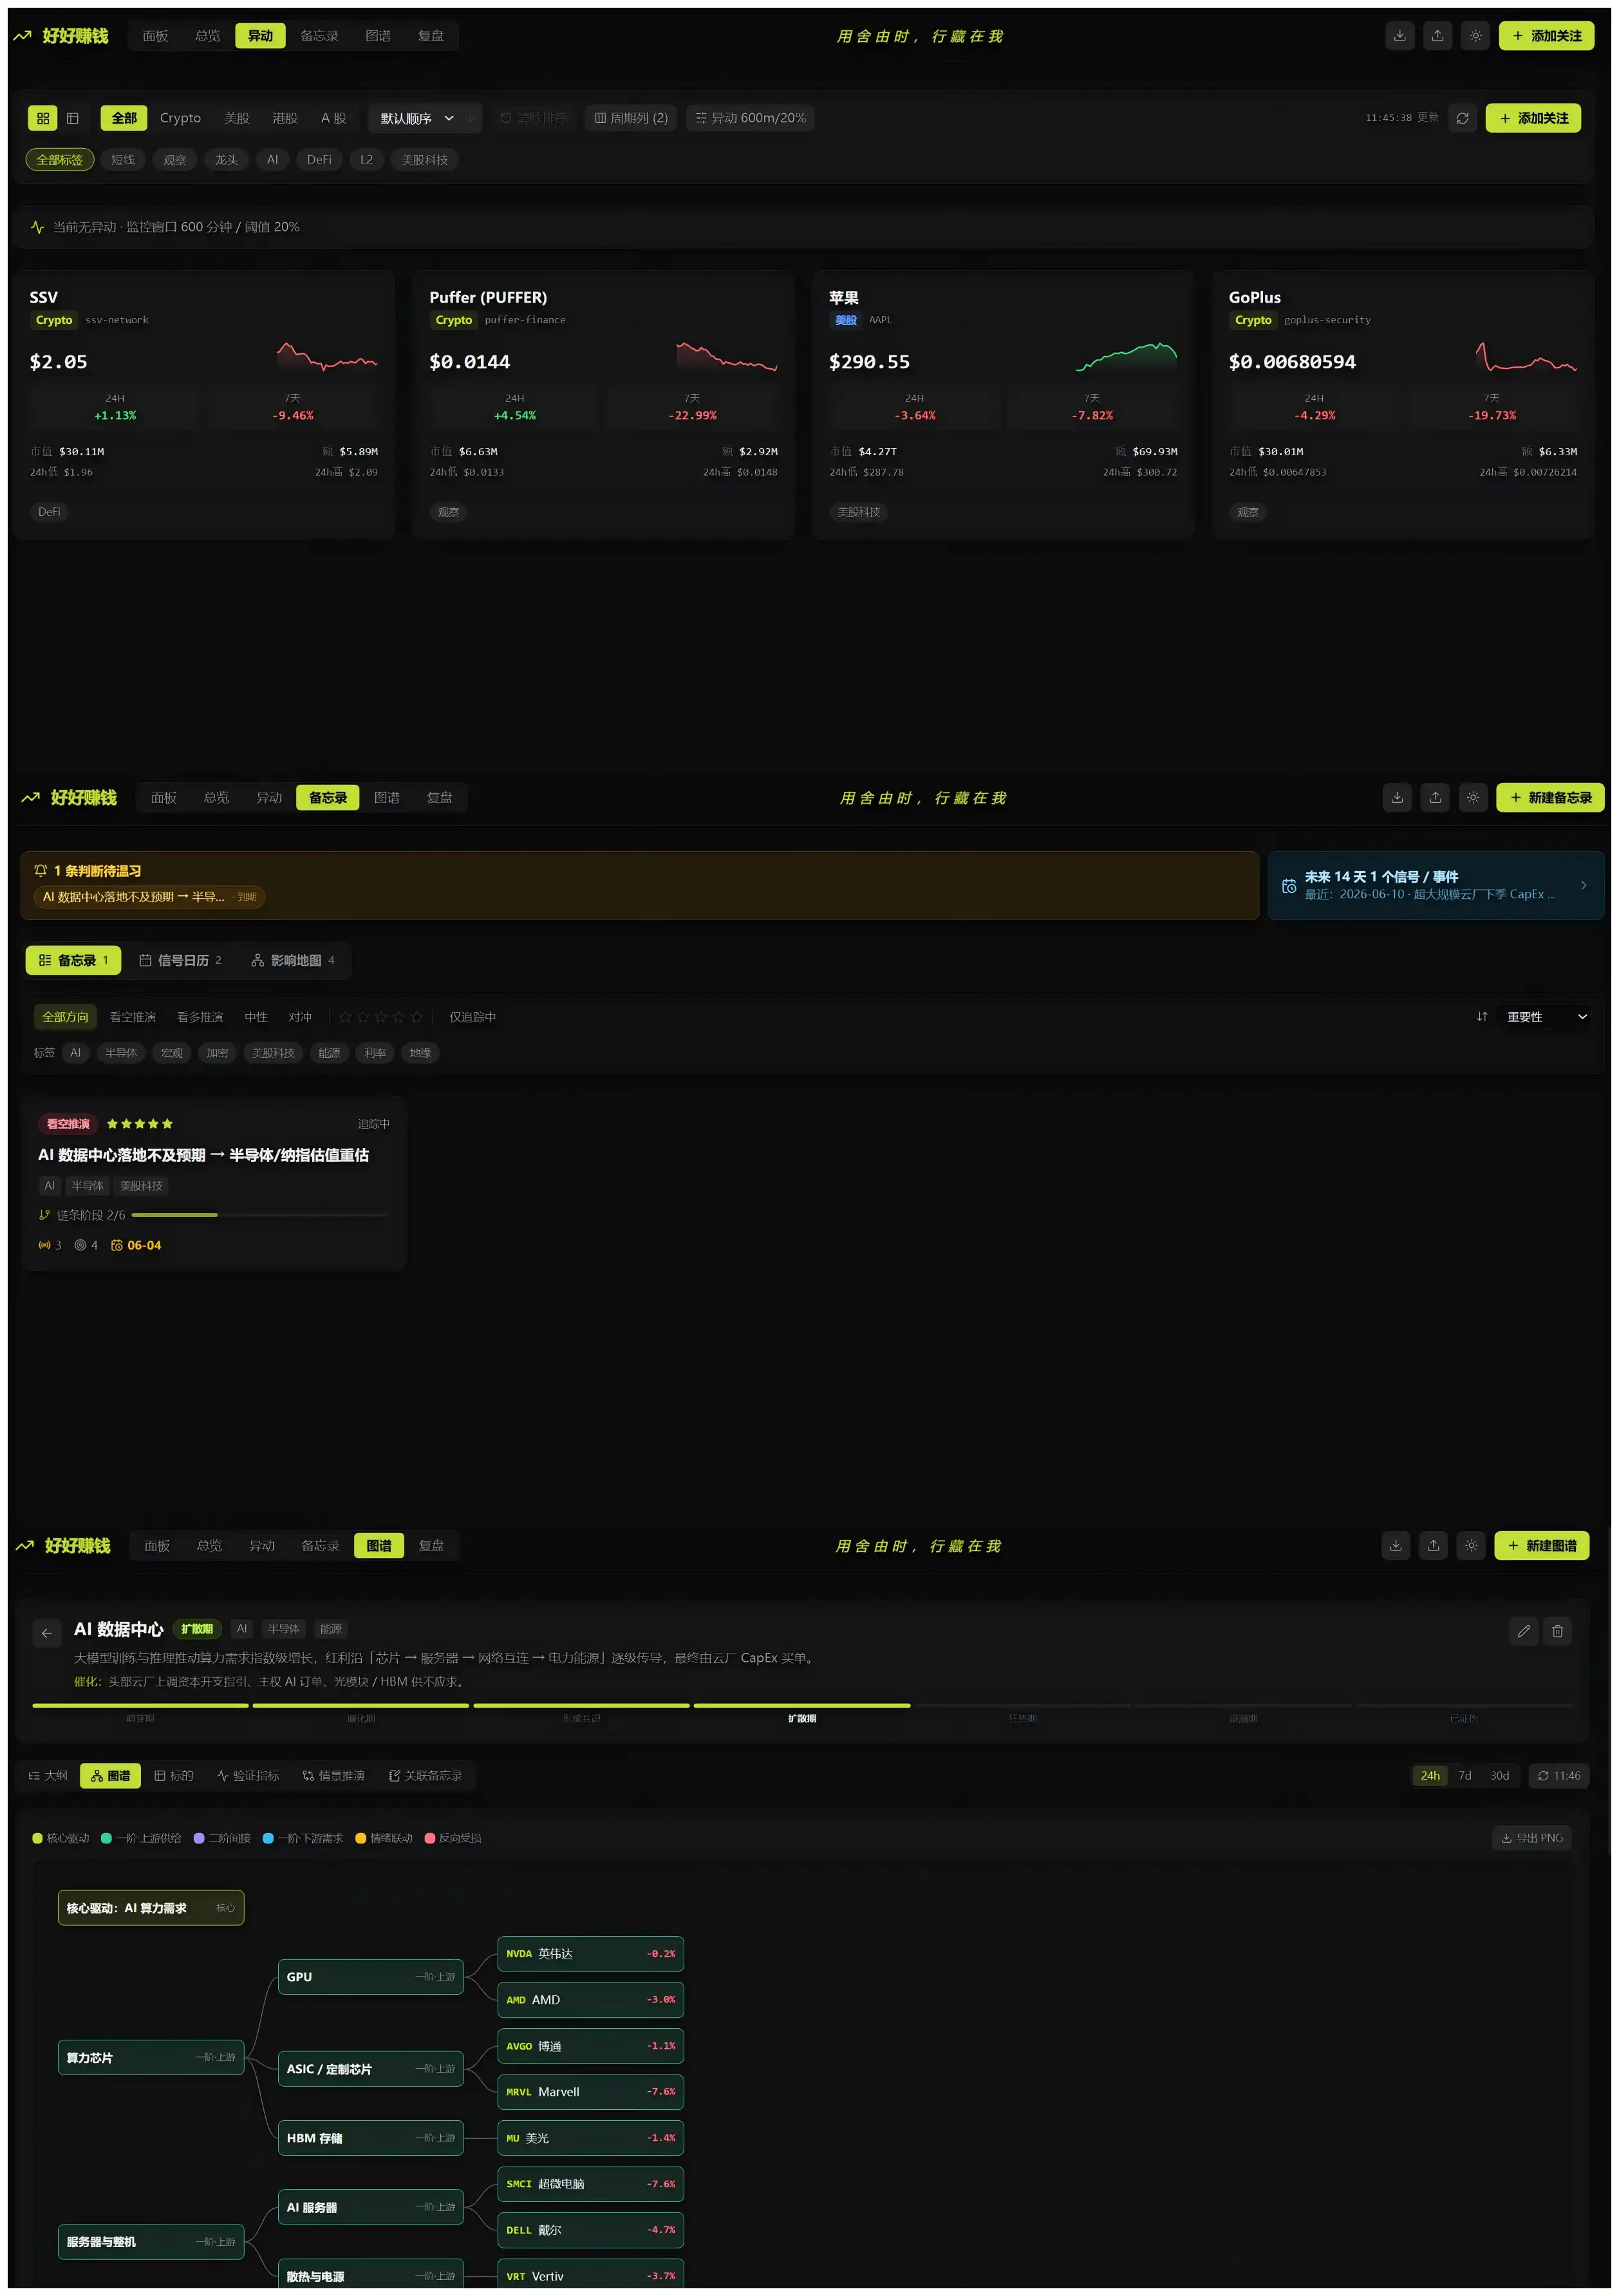
For example, could I create an anomaly monitor, so if an asset suddenly spikes or crashes, I can see it immediately, and also know what other assets or sectors it's related to.
For example, could I build an investment map, so when researching a sector, I don't just focus on one project, but lay out the entire network: upstream, downstream, beneficiaries, potential risks, related assets.
And for example, on prediction markets (PM), there are many bets about unlisted company valuations, market cap overtakes, macro events. Could I put this data together with news events and secondary market changes for comparison?
Plenty of ideas, but actually doing them was too much hassle.
You need to know code, design interfaces, integrate data, and iterate repeatedly; hiring someone is expensive, and requirements aren't always clear. After a few rounds, most ideas ended up with that phrase—"Forget it, let’s just make do with Excel for now."
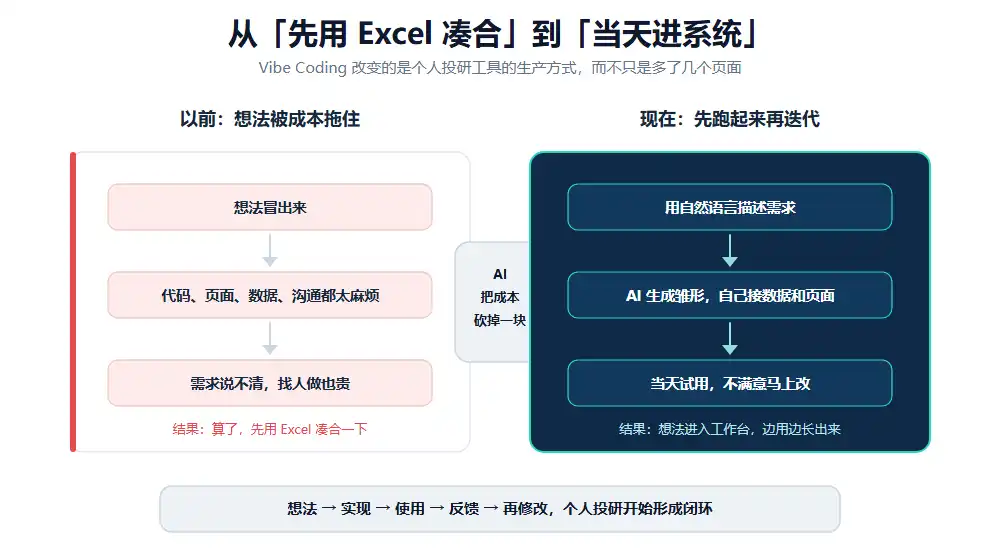
But after tinkering with Vibe Coding for these two weeks, I found this is truly different.
I started building some rough but practical tools for myself. An idea pops up, and it can be integrated into the system the same day, instead of being scattered across chat records, bookmarks, and my own mind.
Two: Four small tools I crafted in two weeks
I mainly built four things in these two weeks (other miscellaneous small tools don't count).
First, Cross-Market Asset Dashboard
The reason was very simple. My assets are scattered across several places: Hong Kong and US stocks in brokerage apps, Crypto on trading platforms, A-shares in another software.
Every day, wanting to see my overall situation meant opening each one, switching back and forth. After checking everything, I still couldn't piece together the full picture. So the first thing I did was stuff all my holdings into one page:
Top section shows total assets, daily P&L. Below, divided by market—one section for US stocks, one for Crypto, one each for HK and A-shares. At a glance, the state of my entire portfolio, who's up and who's down today, is crystal clear.
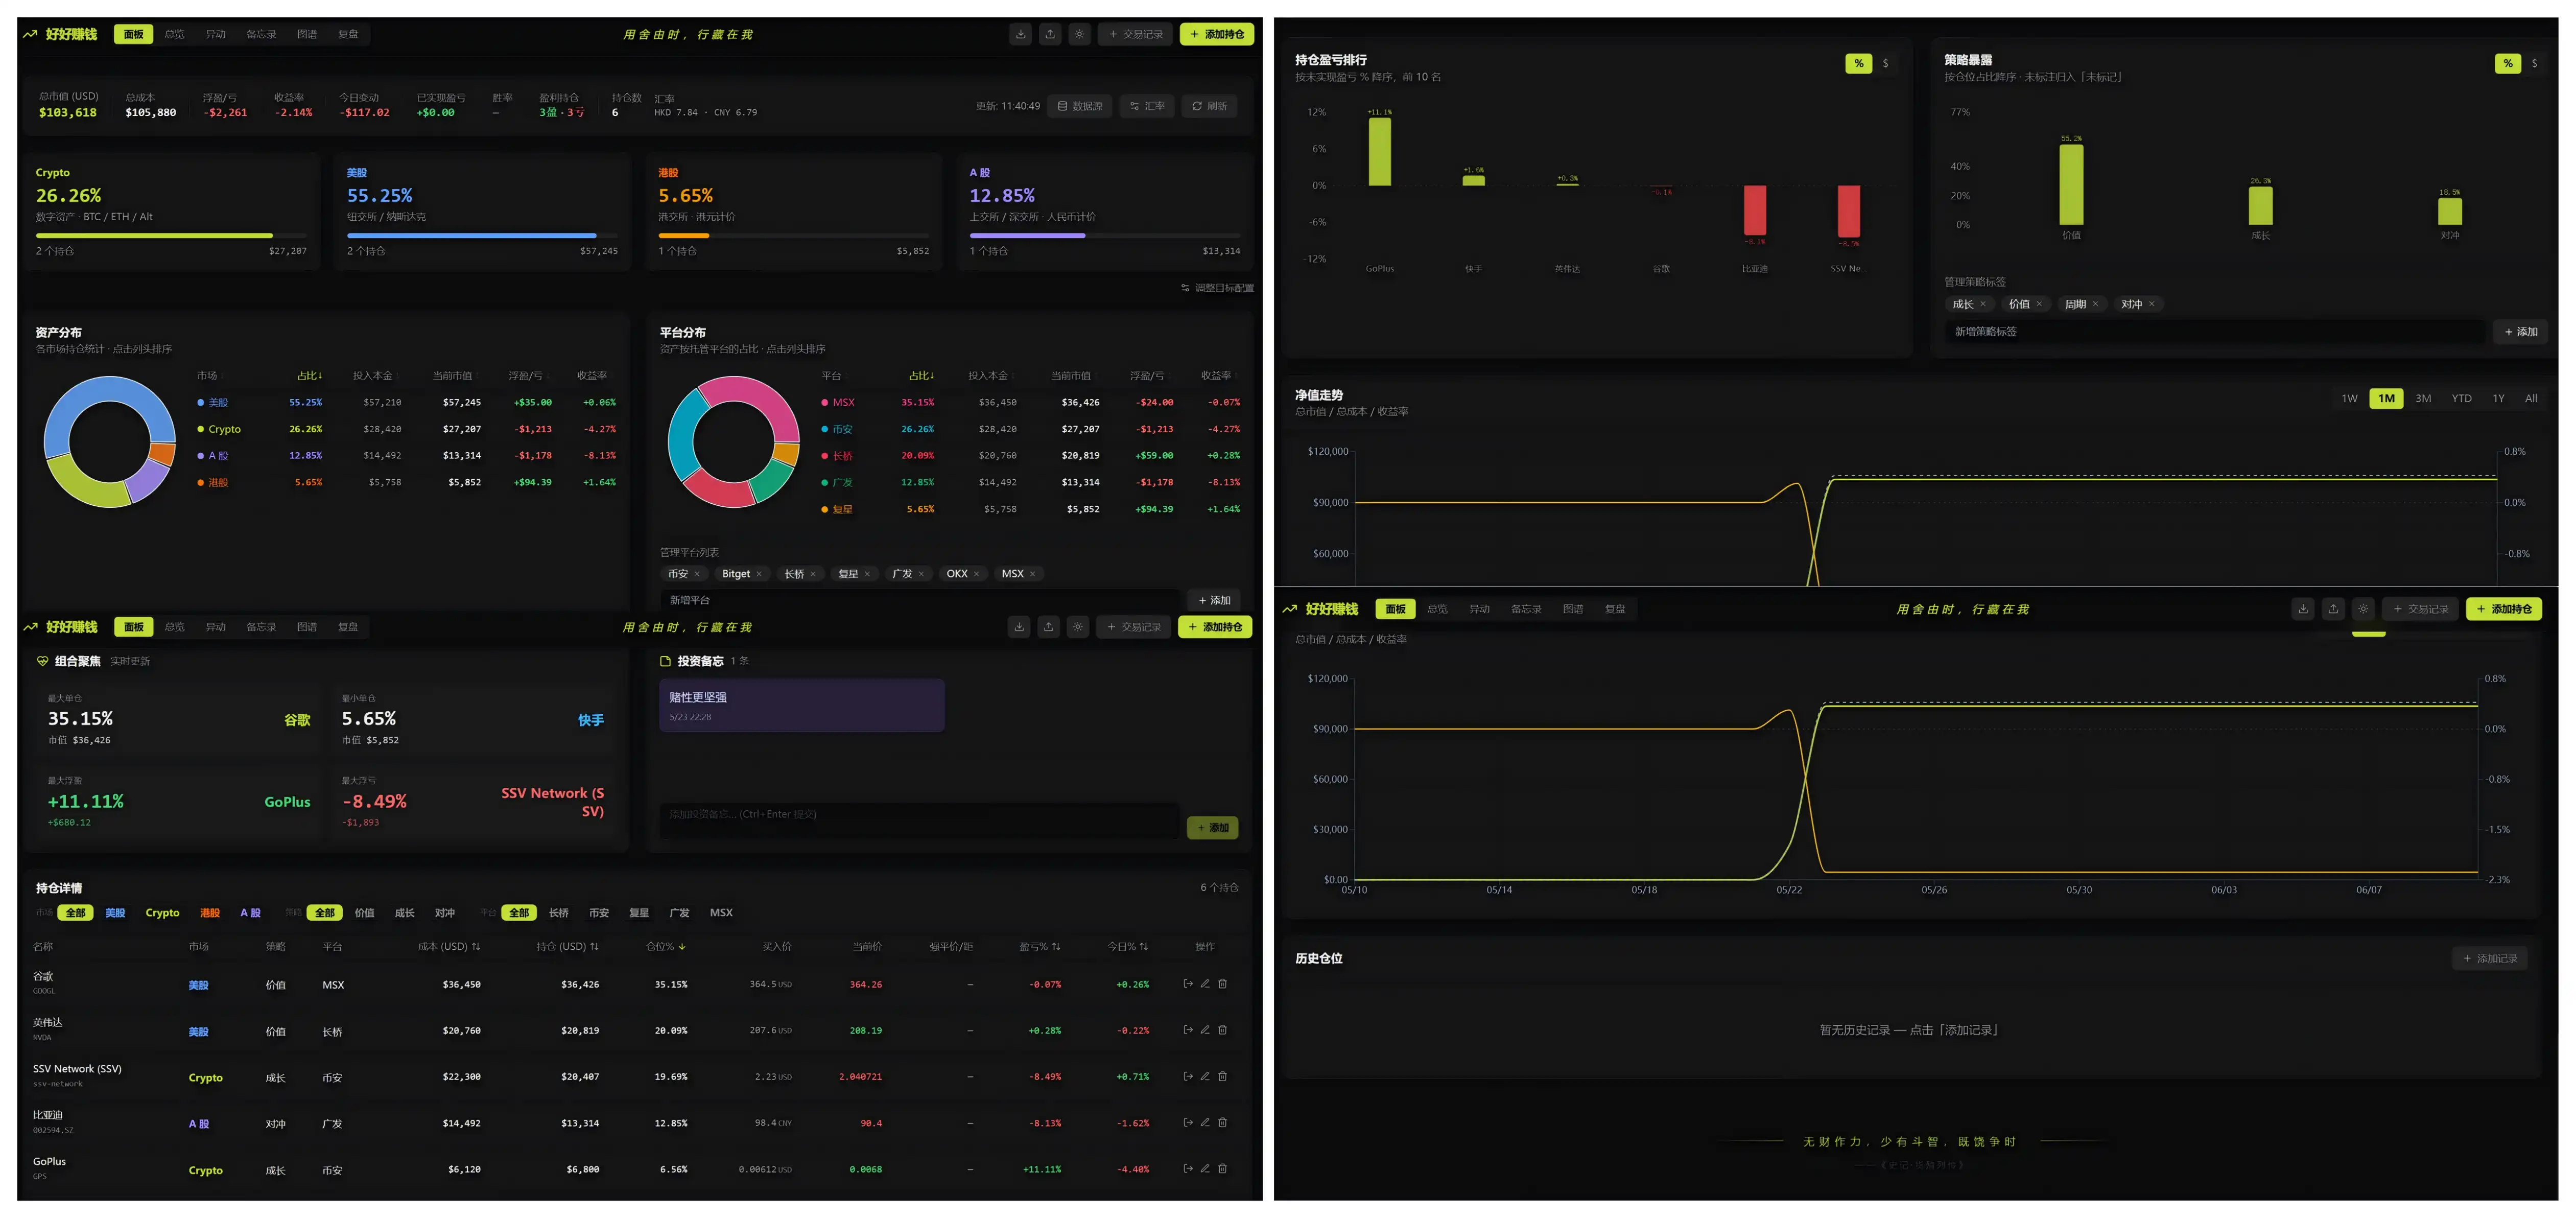
After finishing it, I found it quite useful, and couldn't help but keep adding Tab after Tab, because new needs kept emerging as I used it:
- Anomaly Monitor: I pre-set the assets I care about and thresholds. If anyone suddenly surges or crashes, it highlights it for me, saving me from constantly watching the market.
- Investment Map: When researching a sector, draw the upstream, downstream, beneficiaries, risk points, and related assets into a network, making it easier to trace capital flow chains and relationships.
- Memo + Review: Jot down why I was bullish initially, what happened later, where my judgment was right or wrong, so I can look back later.
Since this dashboard contains all my real holdings, it's quite private, so I deployed it locally.
Second: PM Bet Monitor
This one is specifically for watching prediction markets.
To explain briefly, prediction markets (like PM) are where people use real money to bet on whether a future event will happen. The price itself represents the market's perceived probability—for example, a "yes" for "SpaceX market cap reaches $2 trillion by end of June" priced at 0.8 means the market thinks there's an 80% chance of it happening.
For the bets I care about, like "Will OpenAI/Anthropic's valuation go up by year-end?" "Will a certain market cap overtake event among the Magnificent Seven happen?", "Will xx and xx meet?", I used to have to check each one individually. Now I've centralized them into a single dashboard. I also compare probability changes alongside news events and secondary market fluctuations. Who moves first, who influences whom, becomes clear at a glance.
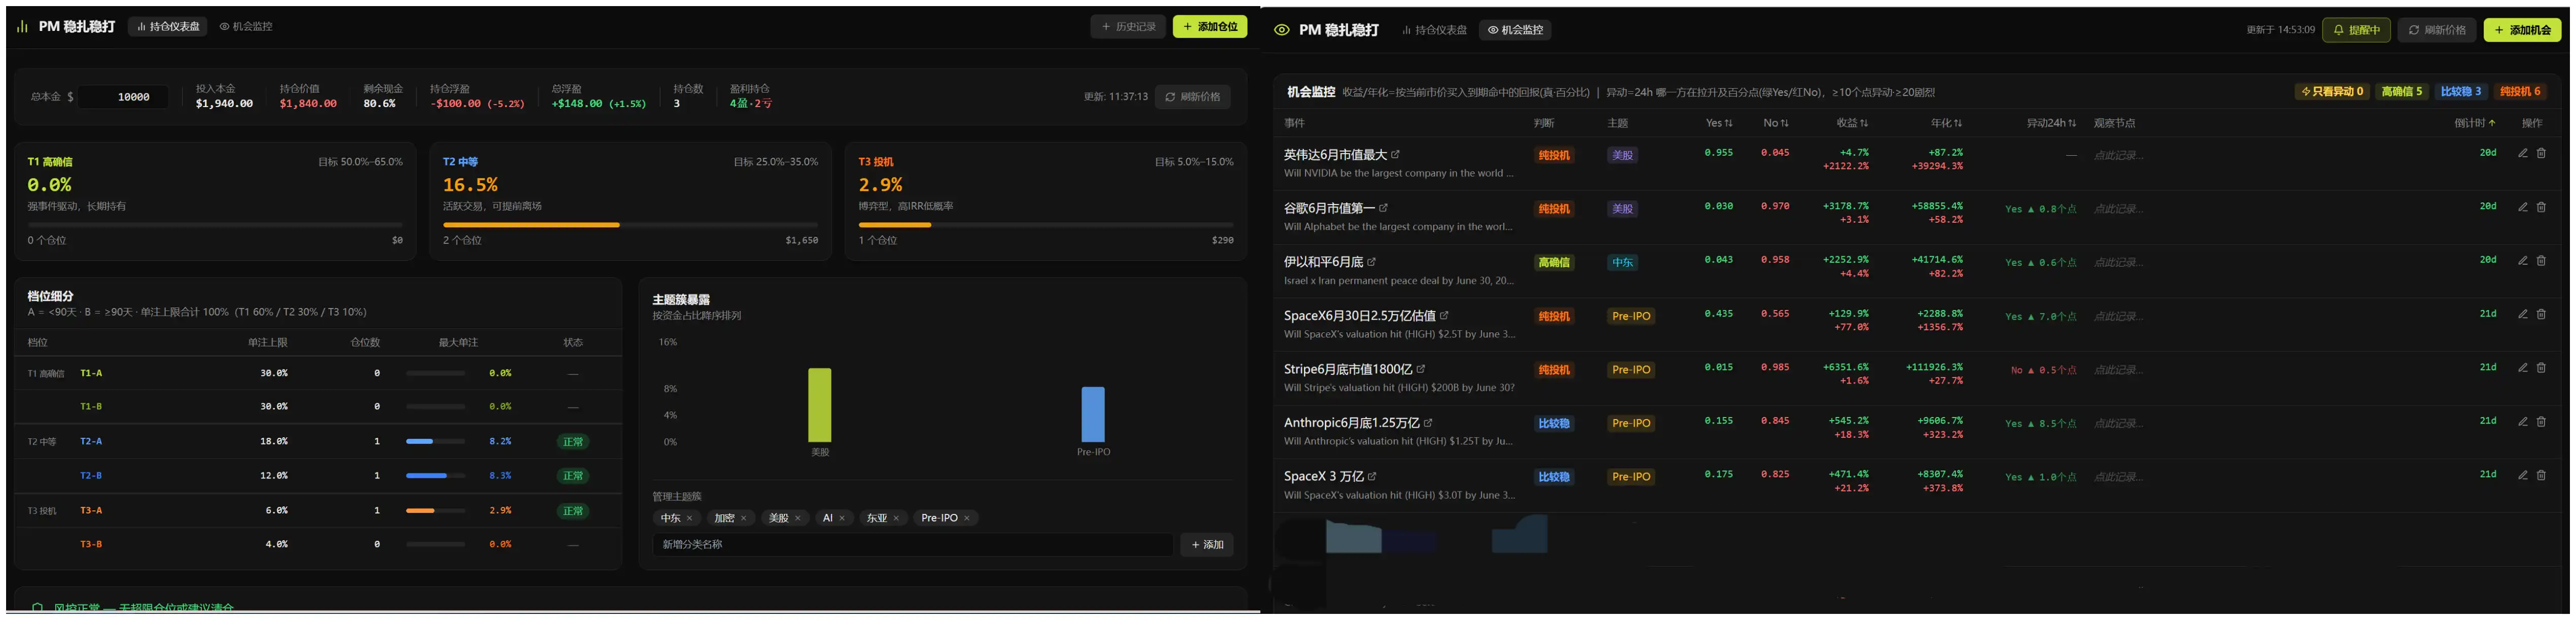
I also tiered these bets according to my own criteria (internally called T1 (high conviction) / T2 (relatively stable) / T3 (pure speculation)), sorted by expected return, so I can instantly distinguish which are just noise.
Honestly, a small edge I have in this market is Chinese information and East Asian political-economic dynamics—many are dominated by Western players, and pricing for this area is often half a step behind. Opportunities hide in this time gap.
Third: Small Operations Backend
This one isn't related to investment; it's for my own writing.
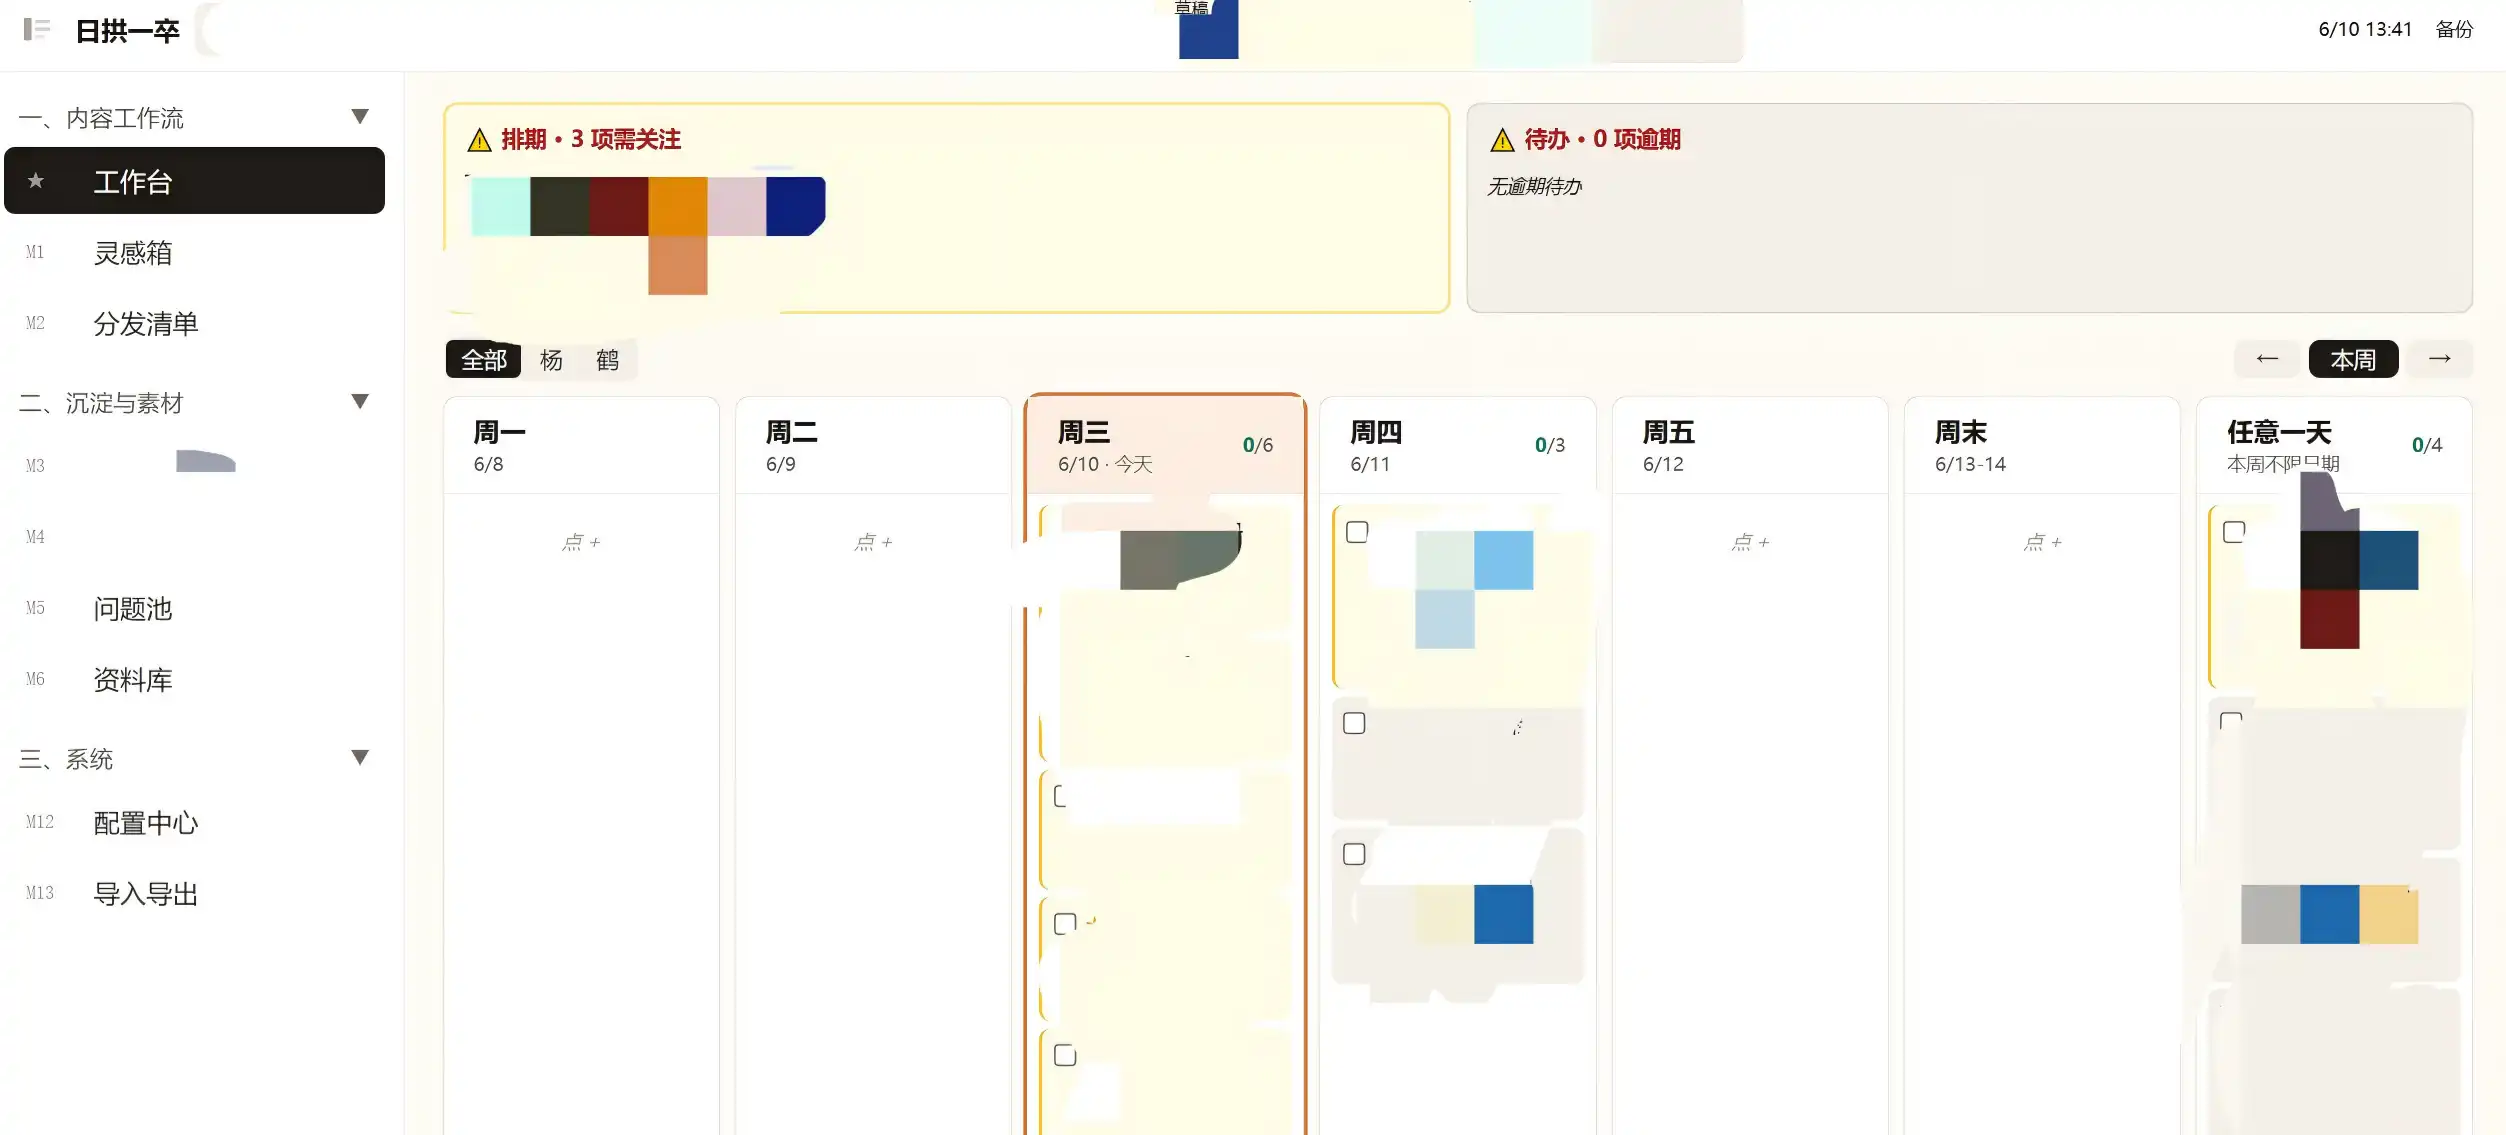
I usually manage topics, write articles, and publish on several platforms. Progress was all in my head or by digging through chat records, often messy. So I made a small backend to manage it, including a topic list, article progress, publishing platforms, and an inspiration box.
Since I might need to use this when I'm out, I didn't make it local, but deployed it to the cloud—using GitHub + Vercel. I can open it on my phone to view and edit, quite convenient.
Fourth: One-Click Formatting Tool
This was mainly to solve a personal minor need. After writing an article, I need to publish it on many platforms, especially for Web3 media. Each platform has different formatting rules, and manually adjusting each time is very time-consuming.
So I created a small tool. Paired with a browser Tampermonkey script I fine-tuned through coding, I throw in an original Markdown or Word document, and it automatically converts it into the corresponding format for each platform and directly inserts images. It's not particularly advanced, but it saves me some mechanical work every day.
To be honest, these four things are still very basic, even a bit ugly, and can't be considered mature products. But for me, they are already very useful because once an idea appears, I can immediately integrate it into the system, rather than letting it scatter and be forgotten.
This is the most important change I feel.
Three: Ordinary People's Investment Research Approach Has Really Changed
Because of this, I increasingly feel that ordinary people doing investment don't necessarily need to start with complex models, but should at least have a few of their own basic systems.
Because the change AI brings to ordinary people isn't suddenly turning you into a guru, but enabling you to first create a prototype for many things you "wanted to do but couldn't" before.
Especially for someone like me who watches the market daily, the feeling is particularly obvious. As long as you have an idea, every ordinary investor can gradually accumulate a few of their own basic systems:
- Asset Observation System: What assets are you actually watching? Which market do they belong to? What recent changes have occurred?
- Signal Monitoring System: Which events, once they happen, might indicate a change in market expectations?
- Map Organization System: A sector isn't a point, but a network. Who's upstream, who's downstream, who benefits from sentiment, who from performance, who from capital flows. Especially over the past year-plus, AI sector stocks have almost rewarded those who could thoroughly understand a sector (from HPC to optical modules to the memory chain).
- Review System: Why were you bullish initially? What happened later? What was right, what was wrong?
These things weren't impossible to do before, but they were too troublesome, hard to sustain. The biggest meaning of AI is that it cuts away a huge chunk of this "trouble."
You may not know how to code, but you can describe requirements, and slowly accumulate your own product design. And you don't have to finish it all at once; release the first version, and modify it while using it.
This is also the most attractive part of Vibe Coding for me: the feedback is so fast. In the past, the gap between an idea popping up and landing could be very long, so long you forgot why you wanted to do it in the first place.
Now, if I think of a feature today, I can try it the same day. If I'm not satisfied after trying, I modify it immediately. After using it for two days, new needs emerge, and I iterate further.
This closed loop of "idea—implementation—use—feedback—modify again," once it starts spinning, really makes you unable to stop.
In Conclusion
Consider this as the first record for the new phase of "太乐 Tyler."
Moving forward, I'll try to update regularly, recording my investment thoughts, tool tests, on-chain operations and arbitrage research, as well as some educational/introductory Web3 operations and investment knowledge points.
Welcome to follow, and feel free to communicate anytime.