BTC Thrice Rejected at $80,000 Threshold, HYPE Reaches New Highs Signaling Opportunity | Guest Analysis

marsbitPublicado a 2026-05-26Actualizado a 2026-05-26

Resumen

**Bitcoin (BTC) Struggles at $80k; HYPE Reaches New Highs | Key Analysis & Strategy** Bitcoin faces continued resistance in the $78.5k - $79.5k zone after failing to sustain a break above its daily chart rising channel. It has retreated to the channel's midline. A failure to hold here could see a test of the $73.5k - $75k support area. The 4-hour chart shows a complex corrective structure. The strategy is neutral for mid-term positions. For short-term trading, two scenarios are outlined: **A)** Selling on a failed rally into the $78.5k-$79.5k resistance, and **B)** Selling on a confirmed breakdown below the $73.5k-$75k support, both with tight risk management. Meanwhile, **HYPE** has posted consecutive highs. The 4-hour chart indicates its current uptrend may be weakening near $65, with models showing potential bearish divergence. The view is that a short-term top could be forming. The strategy advises against chasing the rally and instead looking for a potential long entry on a pullback to the $47.5 - $50 support zone, provided clear reversal signals appear. Last week, a disciplined short BTC trade based on model signals yielded a 2.78% profit. The article emphasizes that all analysis is for informational purposes only and not investment advice, highlighting the importance of strict stop-loss discipline and dynamic position management in a volatile market. *(Note: The text references proprietary models like the "Price Difference Trading Model" and "Momentum Quantificatio...

Continuing our consistent structured analysis framework this week, we focus on two key assets, Bitcoin and HYPE, dissecting the current price action across multiple timeframes. We will examine the ongoing battle between bulls and bears at critical resistance and support zones and formulate specific, actionable operational plans accordingly.

Last week's short position successfully realized a gain of 2.78%, once again validating the trading logic of "signal-driven, disciplined execution." However, a single profitable trade never implies the market direction is definitively correct—the market always retains the potential to move beyond expectations.

The core variable for this week remains the struggle between the resistance zone of $78,500~$79,500 and the support zone of $73,500~$75,000. The outcome will be left for the market to decide.

Summary of This Week's Core Trading Views:

• Analysis of BTC's Multi-Timeframe Price Structure. (Detailed in Part 1)

• BTC Market Forecast and Medium-/Short-Term Trading Strategies for This Week. (Detailed in Part 2)

• Analysis of HYPE's Hourly Chart Price Structure. (Detailed in Part 3)

• HYPE Market Forecast and Short-Term Trading Strategy for This Week. (Detailed in Part 4)

Verification of Last Week's Trading Strategy and Core Views:

• BTC Short-Term Trade Performance: Bitcoin executed one short-term short trade last week (1x leverage), successfully achieving a return of approximately 2.78%. (Detailed in Table 1)

• Market Verification of BTC Trend Forecast: In last week's article, we stated: If the price effectively breaks below the support zone of $78,500~$79,500, it will test the support strength near $75,000. The current market movement has verified our previous forecast.

1. Analysis of Bitcoin's Multi-Timeframe Price Structure

1.1 BTC Daily Chart Structure Analysis

Bitcoin _ Daily Chart:
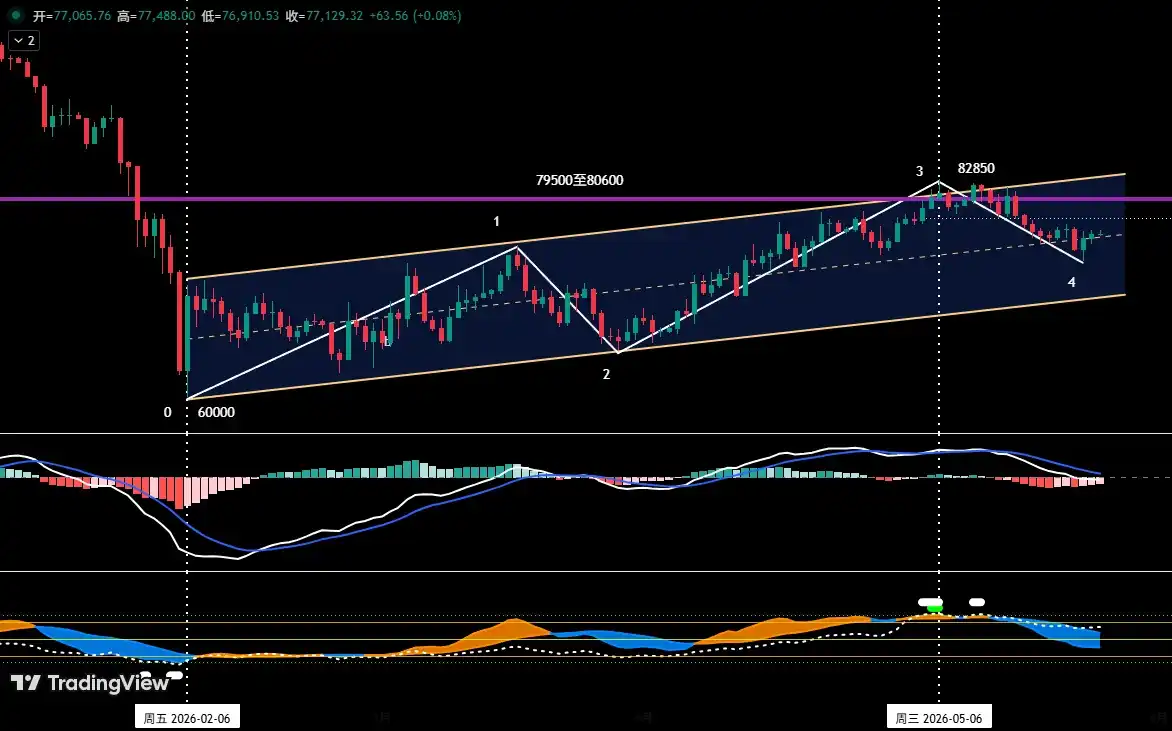
Figure 1

• As shown in (Figure 1), since establishing a significant low near $60,000 on February 6, 2026, Bitcoin's daily chart has constructed and maintained a clearly defined ascending channel: its lower boundary is formed by connecting the lows of February 6 and March 29, while the upper boundary is drawn parallel to the lower boundary through the high of March 17.

• In our weekly review on April 27, we pointed out: "The current price is facing dual resistance from the channel's upper boundary and the $79,500 to $80,600 resistance zone. A breakout is expected to be difficult." Subsequent market action validated this view. After nearly 20 days of struggle between bulls and bears, although a new rebound high of $82,850 was reached on May 6, the price failed to decisively break above this resistance area and subsequently began a corrective pullback.

From the current structure, the price has retraced from near the channel's upper boundary to the mid-channel area. If the price fails to find effective support near the mid-channel and resume its uptrend, the probability of it seeking support at the channel's lower boundary increases.

1.2 In-Depth Analysis of BTC's Hourly Chart Structure

Bitcoin _ 4-Hour Chart
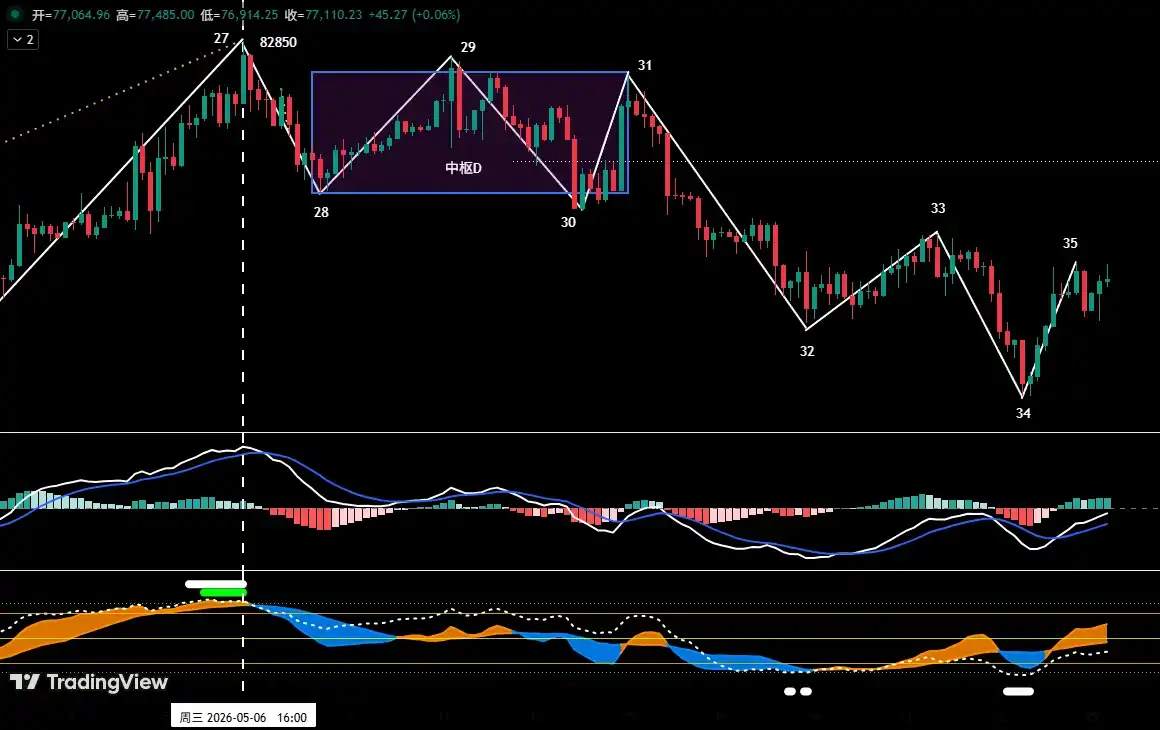
Figure 2

As shown in (Figure 2), from the high of $82,850 on May 6 to the present correction:

• The 4-hour chart shows it can be subdivided into an 8-segment corrective structure: "segment 27-28" to "segment 34-35". Center D: Segments 28-29, 29-30, and 30-31 overlap, constituting Center D.

• From the 4-hour price structure, segment 34-35 is about to rebound to the $78,500~$79,500 zone. If the rebound faces rejection upon reaching this area and fails to form a decisive breakout, the market is likely to continue its current corrective consolidation pattern and test the core support band of $73,500~$75,000 again.

2. Bitcoin Market Forecast and Trading Strategy for This Week

2.1 BTC Market Trend Forecast for This Week:

This week's core view: Focus on the outcome of the battle between bulls and bears over the $78,500~$79,500 resistance zone and the $73,500~$75,000 support zone.

2.2 Core Resistance Levels:

• Primary Resistance Zone: $78,500~$79,500 area (near the boundaries of two centers)

• Secondary Resistance Zone: $83,500~$84,500 area (previous high-volume trading congestion zone)

2.3 Core Support Levels:

• Primary Support Zone: $73,500~$75,000 area (previous significant support level)

• Secondary Support Zone: $69,500~$70,500 area (previous significant support level)

2.4 Trading Strategy for This Week (Excluding Impact of Sudden News)

1. Medium-Term Strategy:

Bitcoin _ Daily Chart: (Position Monitoring Model)
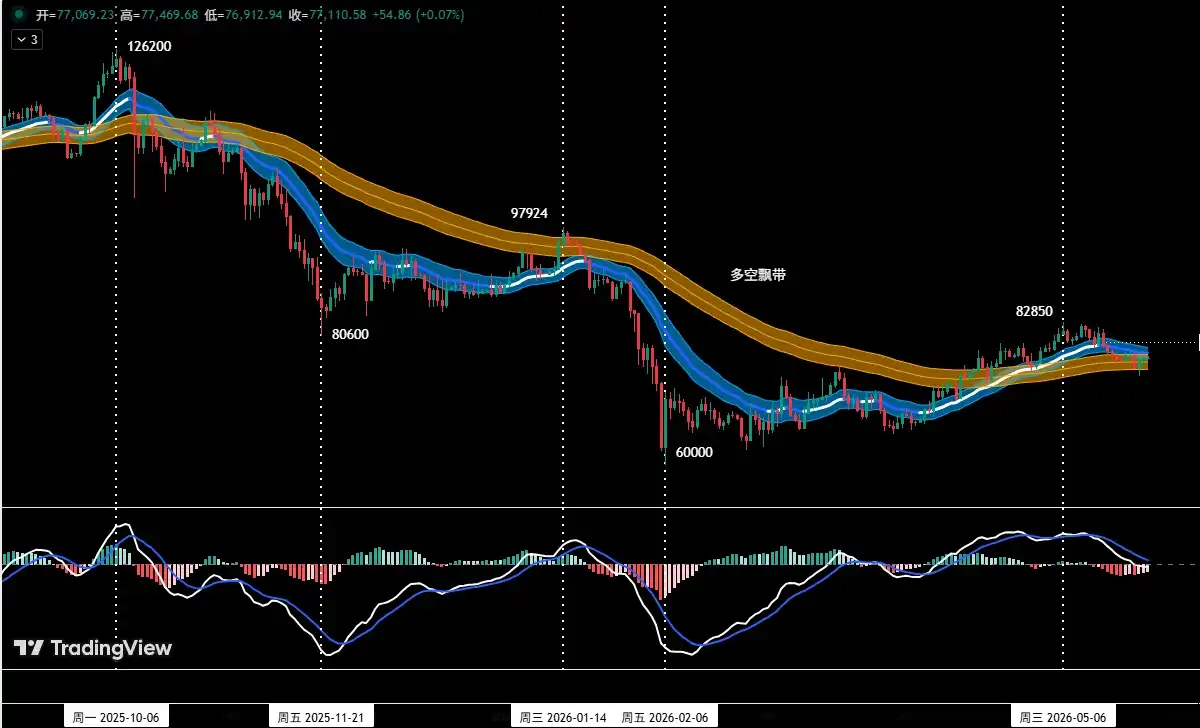
Figure 3

Position Monitoring Model: As shown in (Figure 3), based on trading rules, the medium-term market direction is not yet clear. Maintain a neutral/观望 stance for medium-term positions this week.

2. Short-Term Strategy: Utilize 30% of capital, set stop-losses, and look for "spread" trading opportunities based on support and resistance levels. (Using 30-minute/60-minute charts as the operational timeframe).

3. For short-term operations, to dynamically adapt to the market's complex evolution, we have pre-formulated two specific operational plans: A/B.

Plan A: Rebound Faces Resistance, Sell High.

• Entry: When the price rebounds to the $78,500~$79,500 zone and encounters resistance, combined with a top signal from the quantitative model, a short position of less than 30% can be established.

• Risk Control: Initial stop-loss set above $80,600.

• Exit: When the correction approaches important support levels combined with model signals, gradually close the position to take profits.

Plan B: Support Breached Effectively, Follow the Trend Short.

• Entry: When the price effectively breaks below the $73,500~$75,000 support zone combined with a model top signal, a short position of less than 30% can be established.

• Risk Control: Initial stop-loss set above $76,500.

• Exit: When the decline reaches important support levels combined with model signals, gradually close the position to take profits.

3. Analysis of HYPE's Price Structure

HYPE_4-Hour Chart
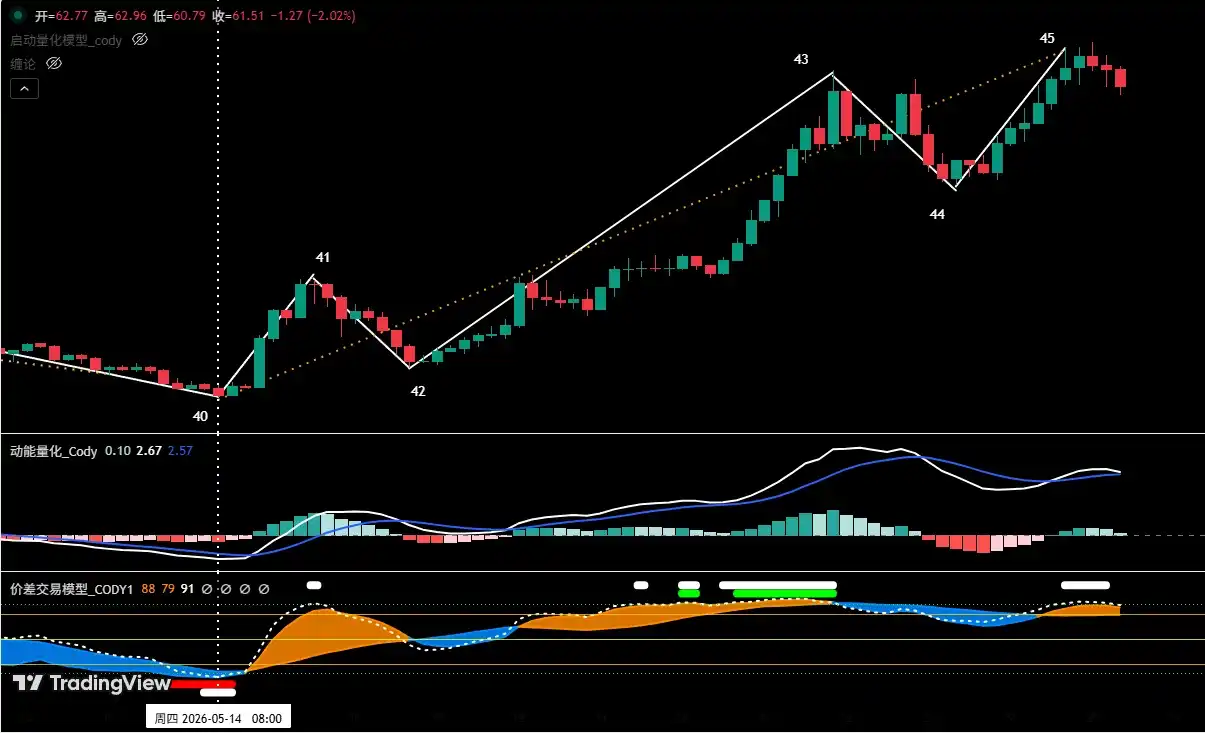
Figure 4

1. As shown in (Figure 4), the rally in HYPE from the low of $38.14 on May 14, on the 4-hour chart, can be divided into a five-segment structure: 40-41, 41-42, 42-43, 43-44, 44-45.

2. Our proprietary "Spread Trading Model" shows that near endpoint 45, a top warning signal (white dot) has been triggered.

3. From the perspective of the "Momentum Quantitative Model," the rising segment (44-45) near $65 has shown signs of waning upward momentum.

4. If a bearish momentum divergence forms at the "endpoint 45" position, overlapping with the top warning signal from the "Spread Trading Model," creating a共振 (resonance), the probability of the price forming a short-term high here increases significantly.

4. HYPE Market Forecast and Short-Term Trading Strategy for This Week

4.1 HYPE Market Trend Forecast for This Week:

This week's core HYPE view:

• Observe whether "endpoint 45" can form a short-term high since the rally began on May 14.

• If a short-term high forms, subsequently look for short-term long opportunities after the price pulls back to a key support area (e.g., $47.5 to $50) and shows clear signs of stabilization.

4.2 HYPE Short-Term Trading Strategy for This Week: (Buy on Support)

Currently, adhere to the strategy of "avoid盲目追涨 (blindly chasing rallies), buy on dips." If the price corrects to the $47.5 to $50 zone, finds support, and shows stabilization signals, combined with bottom signals triggered by both models, consider a light long position. Position size must be controlled below 30%, with strict stop-loss discipline.

5. Trade Review

5.1 Short-Term Trade Review:(See Table 1)

Strictly following the operational plan, based on trading signals from our proprietary "Spread Trading Model" and "Momentum Quantitative Model," we completed one short-term (short) trade last week, achieving a profit of 2.78%.

5.1 Bitcoin Short-Term Trade Details Summary: (Leverage*1x)
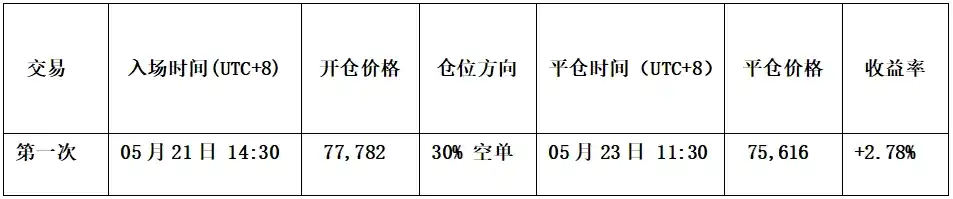
Table 1

5.2 Short-Term Trade Review: (See Figure 5)

• Entry Strategy:

a. When the price rebounded to near $78,500, encountered resistance, and showed bearish pressure signals, with the candlestick forming a "top reversal" bearish signal;

b. The "Spread Trading Model" triggered a top warning signal (white dot), and the "Momentum Quantitative Model" formed a bearish momentum divergence signal.

Therefore, we established a 30% short position at $77,782.

• Exit Strategy:

a. When the price fell to near $75,000 and found support, with the candlestick forming a "bottom reversal" signal;

b. The "Spread Trading Model" triggered a strong bottom warning signal (red dot + white dot), forming a bottom共振 (resonance) signal with the "Momentum Quantitative Model."

Therefore, we closed the entire position near $75,616.

• Summary: This trade successfully realized a profit of approximately 2.78%.

BTC_30 Minute Chart: (Momentum Quantitative Model + Spread Trading Model)
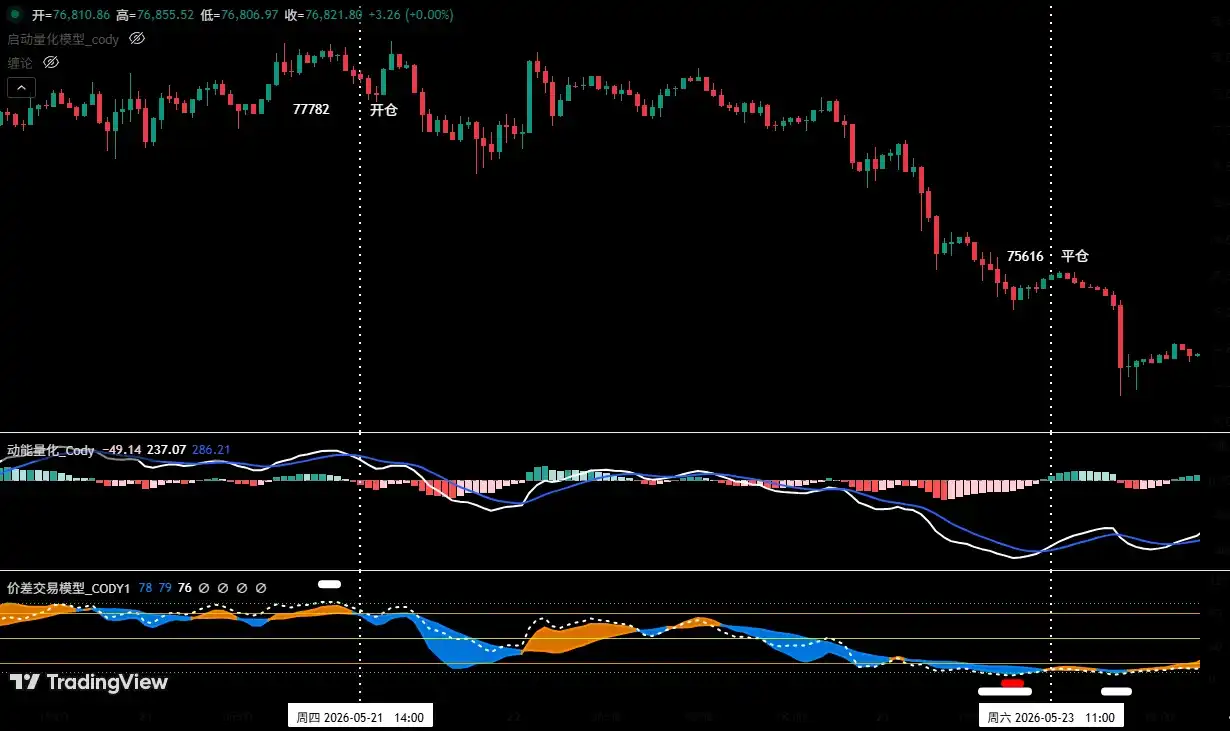
Figure 5 (Short-Term Trade Illustration)

6. Special Reminders:

1. Upon Entry: Immediately set the initial stop-loss.

2. When Profit Reaches 1%: Move the stop-loss to the entry price (breakeven point) to ensure principal safety.

3. When Profit Reaches 2%: Move the stop-loss to the 1% profit level.

4. Continuous Tracking: Thereafter, for every additional 1% profit, move the stop-loss up by 1%, dynamically protecting and locking in profits.

Financial markets are瞬息万变 (constantly changing). All market analysis and trading strategies require dynamic adjustment. All views, analytical models, and operational strategies mentioned in this article are derived from personal technical analysis, intended solely for personal trading journal purposes. They do not constitute any investment advice or operational basis. The market involves risks; invest with caution. Do not make decisions based solely on this content.


Preguntas relacionadas

QWhat is the core resistance zone that Bitcoin (BTC) is struggling to break through according to the article?

AAccording to the article, Bitcoin (BTC) is struggling to break through the core resistance zone of $78,500 to $79,500. This area has acted as a key barrier, with BTC facing it three times already.

QWhat are the two specific short-term operation plans outlined for Bitcoin in the article?

AThe article outlines two short-term operation plans for Bitcoin (BTC): Plan A: 'Rebound meets resistance, sell high' - open a short position if the price rebounds to the $78,500-$79,500 resistance zone and shows signs of pressure. Plan B: 'Effectively breaks support, follow the trend to sell short' - open a short position if the price effectively breaks below the $73,500-$75,000 support zone.

QWhat is the key support area to watch for HYPE according to the analysis?

AThe key support area to watch for HYPE, as per the article, is the $47.5 to $50 region. The strategy suggests looking for short-term buying opportunities if the price falls back to this zone, shows signs of stabilization, and is accompanied by bottom signals from their trading models.

QWhat trading models does the article mention were used for the successful short-term BTC trade last week?

AThe article mentions that last week's successful short-term BTC trade was executed based on signals from two proprietary models: the 'Price Difference Trading Model' and the 'Dynamic Energy Quantification Model'.

QWhat is the overall stance for Bitcoin's medium-term strategy this week according to the 'Position Monitoring Model'?

AAccording to the 'Position Monitoring Model' shown in the article, the medium-term strategy for Bitcoin (BTC) this week is to maintain an empty position and adopt a wait-and-see approach, as the medium-term market direction is not yet clear.

Lecturas Relacionadas

Microsoft Halts Vibe Coding: "Burning Tokens" Is Now More Expensive Than Employees

Microsoft has halted the widespread internal use of Claude Code, withdrawing licenses from most employees by the end of its fiscal year, June 30, 2026. This reversal comes just six months after actively promoting the AI coding tool to boost productivity via "vibe coding"—where developers describe intent in natural language and let the LLM generate code. The core issue isn't the tool's effectiveness; internal reports suggest employees preferred Claude Code over Microsoft's own Copilot CLI. The problem is financial: the "copilot mode" adds a variable, consumption-based token cost on top of existing employee salaries without a proportional revenue increase. As usage grew, the token bills became unsustainable, leading to what sources describe as a cost-structure failure. Similar overruns have been reported at other firms like Uber. The article contrasts this with the approach of AI-native startups, exemplified by Y Combinator's philosophy. Here, high token consumption is strategic—it replaces, rather than supplements, human labor. Startups operate with tiny teams where AI agents handle work previously done by many, making the high token bill financially viable as it offsets much larger personnel costs. The conclusion is that "vibe coding" isn't dead, but its economics fail within traditional corporate structures that treat AI as a productivity add-on for existing staff. Success requires a foundational shift to an AI-native organization, where processes are built to be "legible to AI," and the company's core knowledge and assets reside in documented, AI-accessible systems rather than solely in employees' minds. The future divide will be between companies that merely add AI tools and those that redesign their organizations around them.

marsbitHace 6 min(s)

Microsoft Halts Vibe Coding: "Burning Tokens" Is Now More Expensive Than Employees

marsbitHace 6 min(s)

Metrics Ventures Market Watch: The Brewing Storm

In the past month, the market has been actively trading contrasting expectations, balancing global supply chain disruptions fueling re-inflation against both actual and anticipated (Walsh) interest rate hikes. This volatility has impacted commodities and most equities, though tech has temporarily benefited from concentrated short-term liquidity. Fundamentally, as previously analyzed regarding the Strait of Hormuz situation, the US faces deep-seated balance sheet issues beyond what any single Fed chair can resolve. Hypotheses around a figure like Walsh could only materialize if AI fundamentally reshapes production relations. Until then, most non-AI-leading nations (effectively all except the US and China) risk fiscal and monetary policy collapse, rendering the identity of the Fed chair ultimately irrelevant. For crypto assets, there is currently no clear role in these dominant narratives. The market remains strongly capped by the 200-day moving average. While trends may shift from "anything but AI" to "anything but mines," this phase is dominated by the silicon vs. carbon (AI vs. traditional) dichotomy, leaving little room for crypto—though its time will come. **Market Overview & Commentary** The crypto market lacks significant catalysts beyond hype, plagued by low volume and scarce innovation, with clear technical resistance. Currently, crypto struggles for attention as global focus lies elsewhere. Assets like gold, oil, and grains are more direct hedges against supply-chain-driven inflation/stagflation. Bitcoin needs more time for capitulation and consolidation; this reset is expected to last until at least Q4 2026. Looking ahead, three factors will likely drive future market volatility: 1. Whether Walsh repeats the patterns of predecessors like Bassant or Musk, shifting stance into a new policy cycle. 2. The market underestimates the severity of global supply chain damage and the prolonged time needed for repair, which will eventually lead to recognition of acute resource shortages and price swings. 3. AI non-beneficiary, high-inflation nations (e.g., UK, Japan) will face severe fiscal and monetary crises. Rapid AI-driven displacement could trigger a collapse of existing credit and welfare systems. Ultimately, the market may realize that an AI bubble burst could spark contagious sovereign credit crises. The monetary and fiscal responses to such a scenario could serve as the ultimate catalyst for Bitcoin's next major bull run.

marsbitHace 1 hora(s)

Metrics Ventures Market Watch: The Brewing Storm

marsbitHace 1 hora(s)

Insiders Betting on Musk Are Reaping 'Historic Returns'

The largest IPO in history is imminent as SpaceX, led by Elon Musk, is set to price its offering on June 12. At a targeted valuation near $2 trillion, this event will mint new billionaires from Musk's inner circle of long-time allies, rewarding their loyalty with unprecedented returns. Key beneficiaries include Antonio Gracias, Musk's close friend and confidant, who holds a 7.3% stake potentially worth over $140 billion, making him the second-largest individual shareholder. Gwynne Shotwell, President and COO since 2002, holds shares valued at roughly $2 billion. Bret Johnsen, the CFO, holds stock worth approximately $1.4 billion. Luke Nosek, a PayPal co-founder and early investor, stands to gain about $5.3 billion. The IPO filing also reveals complex and controversial financial arrangements. SpaceX has guaranteed nearly $20 billion in payments from xAI's subsidiary to Gracias's Valor Equity Partners for AI hardware leases—deals auditors flagged as "failed sale-leaseback" transactions, forcing SpaceX to record them as debt. Despite rapid revenue growth, SpaceX is not profitable, posting a $49 billion loss in 2025 and a $4.3 billion loss in Q1 2026. Capital expenditures are soaring, with over 60% directed toward AI. Public investors will inherit these losses, significant debts, and a governance structure heavily controlled by insiders, including a provision granting Musk up to a billion additional shares if one million people live on Mars.

链捕手Hace 1 hora(s)

Insiders Betting on Musk Are Reaping 'Historic Returns'

链捕手Hace 1 hora(s)

Ethereum Reduced to a Chinese Concept Stock

The article titled "Ethereum Becomes a Chinese Concept Stock" presents a critical analysis of Ethereum's perceived decline in market confidence and its structural parallels to Chinese companies listed on US stock exchanges. It begins by noting significant sell-offs by early investors like Wanxiang and key figures like Bankless's Hoffman in 2026, despite Ethereum's strong fundamental activity. The piece questions the erosion of trust in Vitalik Buterin and the Ethereum Foundation (EF), arguing that while other ecosystems have faced founder controversies, Ethereum's issues stem from its internal governance model. The author draws a direct comparison to "China concept stocks," which are Chinese businesses operating globally but reliant on foreign capital and listings. Similarly, Ethereum, funded early by Chinese capital like Wanxiang, developed a strong institutional framework from its IXO to its PoS transition. The core problem, according to the article, is a leadership vacuum regarding price and direction. Vitalik's move to make the EF smaller and less active is framed as a mistake. While he advocates for ETH as a "commodity," the ecosystem lacks a clear entity to steward its price stability, creating tension within the PoS system, as seen with Lido's challenges. The narrative suggests that excessive abstraction and a hands-off approach from the EF have left the community adrift, contrasting with more proactive foundations like Solana's. The article then examines emerging technical narratives for Ethereum: privacy (ZK-proofs), AI integration, and a refocus on Layer-1. However, it observes a shift from Ethereum leading as a "world computer" to merely adapting to trends like AI, where crypto-native projects are finding success independently of Ethereum. The piece posits that Ethereum's unique value in an increasingly fragmented world may be as a permissionless, global financial testing ground—a neutral platform amid geopolitical tensions. In conclusion, it asserts that Ethereum's fate mirrors that of China concept stocks: an asset born from one region (conceptually "A"), funded by another ("B"), and dependent on "B" for exit liquidity. While Ethereum's "golden age" may be over, and selling pressure from early backers will continue, it remains positioned as a critical linkage point in a divided global landscape, standing at a new, albeit uncertain, starting point.

marsbitHace 1 hora(s)

Ethereum Reduced to a Chinese Concept Stock

marsbitHace 1 hora(s)

Trading

Spot
Futuros

Artículos destacados

Cómo comprar HYPE

¡Bienvenido a HTX.com! Hemos hecho que comprar Hyperliquid (HYPE) sea simple y conveniente. Sigue nuestra guía paso a paso para iniciar tu viaje de criptos.Paso 1: crea tu cuenta HTXUtiliza tu correo electrónico o número de teléfono para registrarte y obtener una cuenta gratuita en HTX. Experimenta un proceso de registro sin complicaciones y desbloquea todas las funciones.Obtener mi cuentaPaso 2: ve a Comprar cripto y elige tu método de pagoTarjeta de crédito/débito: usa tu Visa o Mastercard para comprar Hyperliquid (HYPE) al instante.Saldo: utiliza fondos del saldo de tu cuenta HTX para tradear sin problemas.Terceros: hemos agregado métodos de pago populares como Google Pay y Apple Pay para mejorar la comodidad.P2P: tradear directamente con otros usuarios en HTX.Over-the-Counter (OTC): ofrecemos servicios personalizados y tipos de cambio competitivos para los traders.Paso 3: guarda tu Hyperliquid (HYPE)Después de comprar tu Hyperliquid (HYPE), guárdalo en tu cuenta HTX. Alternativamente, puedes enviarlo a otro lugar mediante transferencia blockchain o utilizarlo para tradear otras criptomonedas.Paso 4: tradear Hyperliquid (HYPE)Tradear fácilmente con Hyperliquid (HYPE) en HTX's mercado spot. Simplemente accede a tu cuenta, selecciona tu par de trading, ejecuta tus trades y monitorea en tiempo real. Ofrecemos una experiencia fácil de usar tanto para principiantes como para traders experimentados.

175 Vistas totalesPublicado en 2024.12.11Actualizado en 2026.04.28

Cómo comprar HYPE

Discusiones

Bienvenido a la comunidad de HTX. Aquí puedes mantenerte informado sobre los últimos desarrollos de la plataforma y acceder a análisis profesionales del mercado. A continuación se presentan las opiniones de los usuarios sobre el precio de HYPE (HYPE).

活动图片