Trazando el camino de FET hacia $0.35 mientras la oferta se ajusta ante salidas de $2.3 millones

ambcryptoPublicado a 2026-03-27Actualizado a 2026-03-27

Resumen

El token FET de Artificial Superintelligence Alliance ha registrado salidas de intercambio por valor de 2,33 millones de dólares, lo que indica un endurecimiento de la oferta y una estructura de tendencia fortalecida. Este movimiento reduce la cantidad de FET disponible en los exchanges, limitando la presión de venta inmediata y permitiendo una estabilización más eficiente del precio durante las fases de recuperación. El precio ha rebotado desde la base de 0,1422 dólares y ha recuperado el nivel de soporte de 0,20 dólares, acercándose ahora a la zona de resistencia de 0,26 dólares. Los indicadores DMI muestran una presión compradora dominante, con un ADX de 38,43 que confirma la fortaleza de la tendencia. Los flujos netos negativos persistentes reflejan una preferencia por la retención sobre la liquidación, lo que respalda una expansión gradual al alza. Si se mantienen estas condiciones y se supera la resistencia de 0,26 dólares, es probable que la recuperación se extienda hacia el siguiente objetivo significativo en 0,35 dólares.

Artificial Superintelligence Alliance [FET] ha registrado más de $2.33 millones en salidas de exchanges mientras el precio recuperaba los $0.20 al cierre de esta edición, lo que señala un ajuste de la oferta en medio de un fortalecimiento de la estructura de tendencia. Este movimiento ha reducido directamente la cantidad de FET disponible en los exchanges, lo que típicamente limita la presión de venta inmediata.

A medida que los tokens salen de las plataformas de trading, la liquidez en el lado de la venta se ajusta, permitiendo que el precio se estabilice de manera más eficiente durante las fases de recuperación. Este comportamiento a menudo se alinea con la acumulación, especialmente cuando los grandes tenedores eligen mantener en lugar de distribuir.

Como resultado, la estructura del mercado comienza a favorecer un movimiento alcista controlado en lugar de una volatilidad bajista brusca impulsada por entradas repentinas.

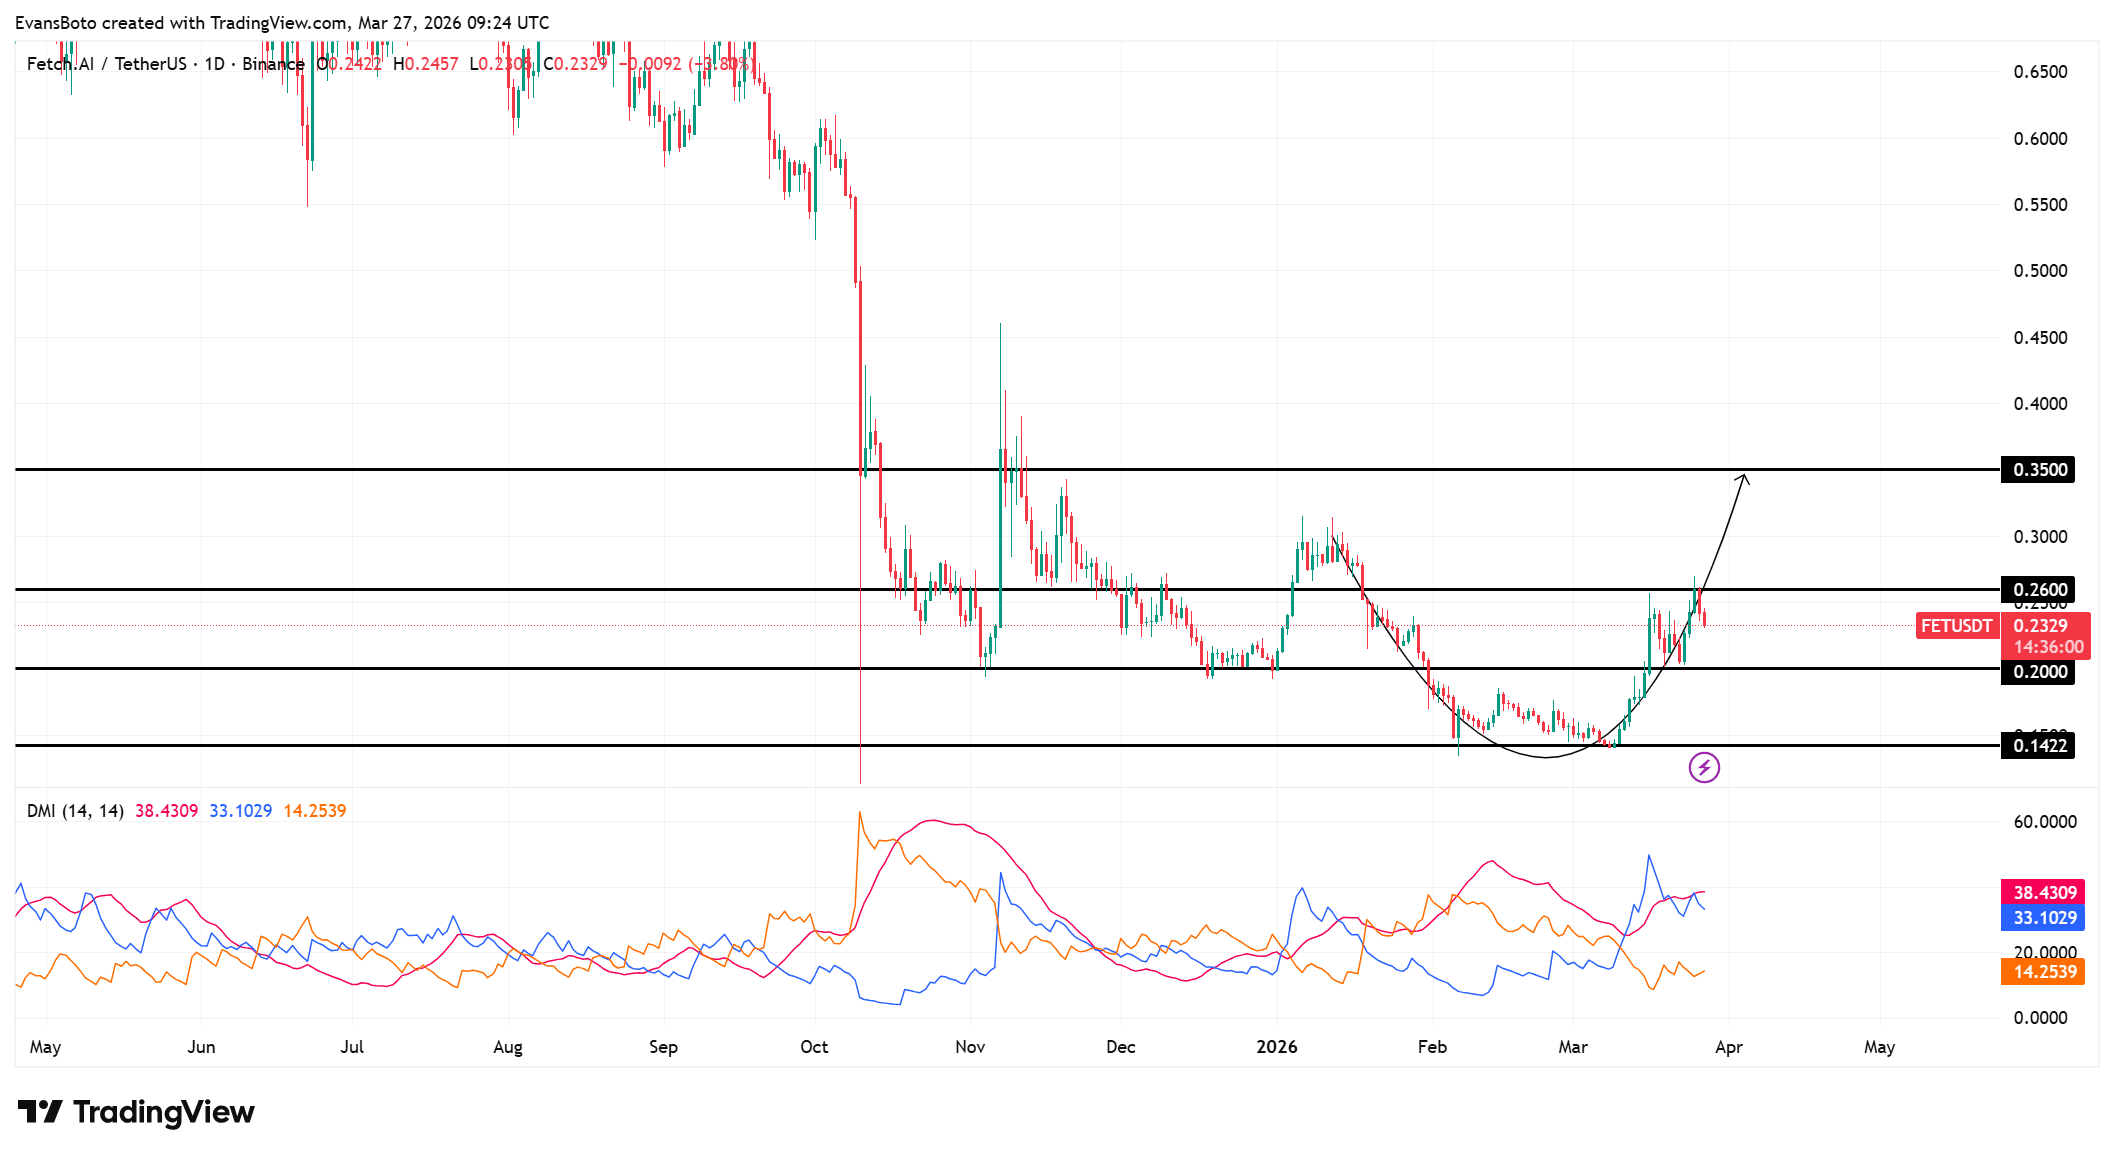
FET presiona los $0.26 tras recuperar los $0.20

El precio se ha recuperado con fuerza desde la base de $0.1422 y ha recuperado con éxito el nivel de soporte de $0.20, marcando un cambio estructural tras una prolongada presión bajista. Después de formar un fondo redondeado, FET ahora cotiza cerca de $0.2329 mientras presiona la zona de resistencia de $0.26.

Este nivel representa una barrera crítica que anteriormente limitó los intentos de recuperación. A medida que el precio se acerca nuevamente a esta zona, refleja una demanda fortalecida en lugar de rebotes de alivio débiles.

Una mantención sostenida por encima de $0.20 ya ha reforzado la intención alcista, mientras que un movimiento claro por encima de $0.26 expondría el próximo nivel importante cerca de $0.35, alineándose con la estructura de recuperación más amplia visible en el gráfico.

Al cierre de esta edición, las lecturas del DMI han cambiado decisivamente a favor de los compradores, con el +DI manteniéndose alrededor de 33.10 mientras el -DI permanecía suprimido cerca de 14.25. Este diferencial refleja claramente una presión compradora dominante en lugar de condiciones equilibradas.

Además, el ADX ha subido a 38.43, confirmando que la tendencia se ha fortalecido en lugar de debilitarse.
Fuente: TradingView

Las salidas continuas reflejan una reducción de la presión de venta

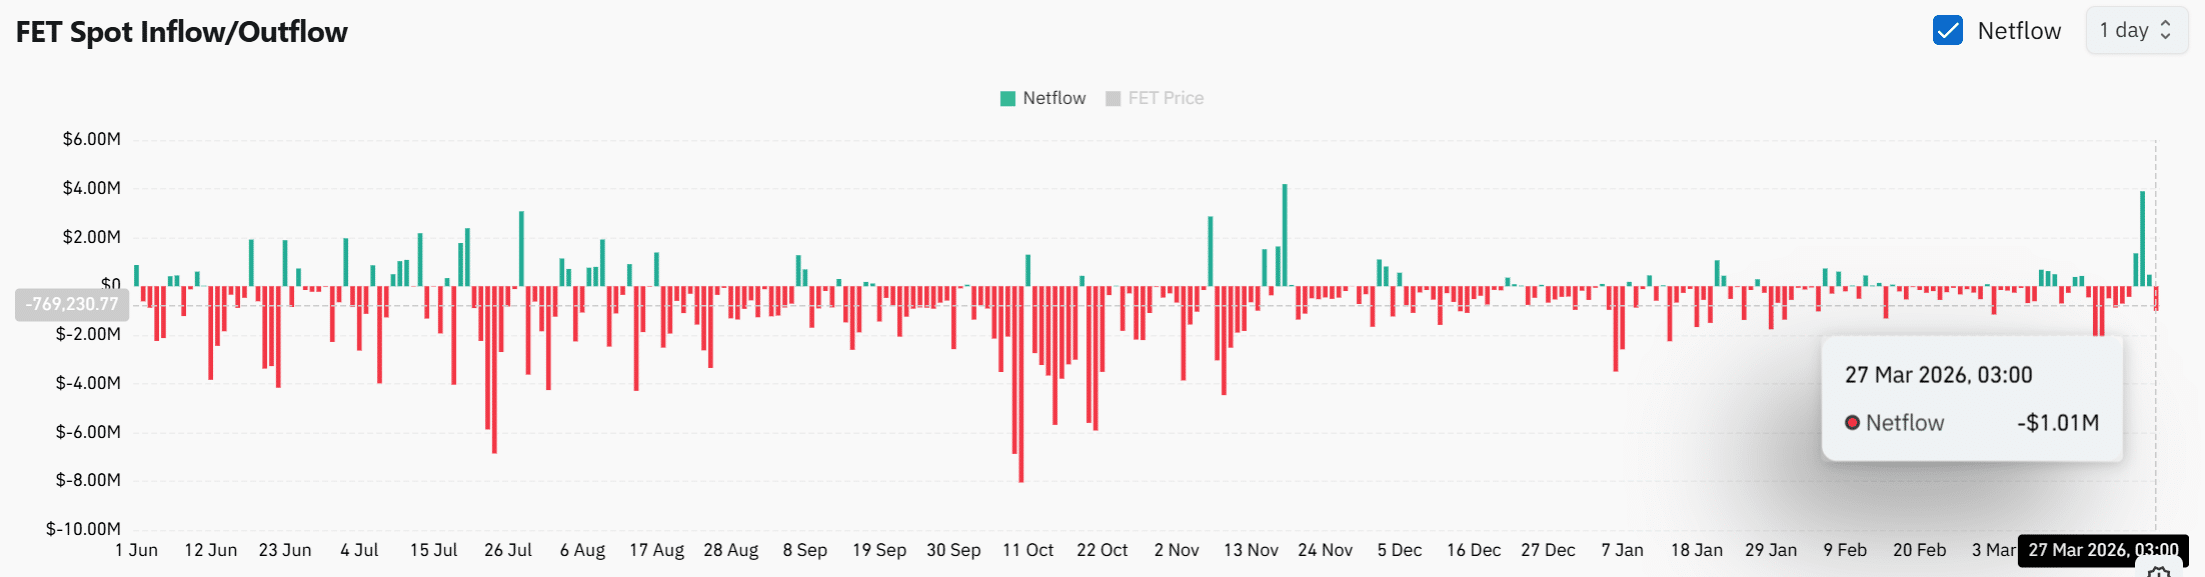
Los datos de Flujo Neto Spot continúan mostrando valores negativos, con la última lectura en aproximadamente -$1.01 millones. Este patrón consistente de salidas indica que sale más FET de los exchanges del que entra, reforzando la contracción de la oferta ya observada a través de las retiradas de ballenas.

A medida que persiste esta tendencia, quedan menos tokens disponibles para la venta inmediata, lo que estabiliza el comportamiento del precio durante los movimientos alcistas. A diferencia de los mercados impulsados por entradas que a menudo señalan distribución, las salidas sostenidas sugieren que los tenedores prefieren la retención sobre la liquidación.

Dicho entorno favorece una expansión alcista gradual, especialmente cuando se combina con un fortalecimiento de la estructura técnica en el precio y los indicadores.
Fuente: CoinGlass

¿Puede FET mantener este impulso hacia $0.35?

FET ahora opera dentro de un entorno de oferta ajustada mientras la fuerza de la tendencia se mantiene elevada y el posicionamiento de los traders favorece la continuación.

El precio ya ha recuperado soportes clave y ahora desafía la resistencia con respaldo estructural. A medida que estas condiciones se alinean, el mercado se inclina hacia una mayor progresión alcista en lugar de un retroceso.

Un movimiento decisivo por encima de $0.26 probablemente extendería la recuperación hacia $0.35, siempre que las dinámicas actuales persistan sin interrupciones.


Resumen Final

  • La estructura de FET refleja una fuerza controlada a medida que el ajuste de la oferta y la alineación de la tendencia continúan favoreciendo una expansión alcista gradual.
  • Es probable que el precio se extienda más alto si se rompe la resistencia, ya que el posicionamiento y la fuerza estructural continúan apoyando la convicción direccional.


Criptos en tendencia

Preguntas relacionadas

Q¿Qué cantidad de salidas de exchange ha registrado Artificial Superintelligence Alliance (FET) según el artículo?

AArtificial Superintelligence Alliance (FET) ha registrado más de 2.33 millones de dólares en salidas de exchanges.

Q¿Qué nivel de soporte clave ha recuperado FET, indicando un cambio estructural?

AFET ha recuperado con éxito el nivel de soporte clave de 0.20 dólares, lo que marca un cambio estructural tras una prolongada presión a la baja.

Q¿Qué indicador de tendencia muestra una fuerza de tendencia elevada con un valor de 38.43?

AEl ADX ha subido a 38.43, lo que confirma que la tendencia se ha fortalecido en lugar de debilitarse.

Q¿Qué sugiere el patrón persistente de flujos netos negativos en el spot para FET?

AEl patrón persistente de flujos netos negativos sugiere que los tenedores prefieren retener los tokens en lugar de liquidarlos, lo que reduce la presión de venta inmediata.

Q¿Hacia qué nivel principal se extendería la recuperación si FET supera decisivamente la resistencia de 0.26 dólares?

ASi FET supera decisivamente la resistencia de 0.26 dólares, es probable que la recuperación se extienda hacia el nivel principal de 0.35 dólares.

Lecturas Relacionadas

Low Investment Isn't Apple's Immunity Pass

While Meta and Google face investor scrutiny over ballooning AI capital expenditures, Apple's minimal AI investment has paradoxically become a strength. Its market cap recently reclaimed the global top spot, surpassing $5 trillion. The irony is deep: Apple's own AI efforts have lagged, with "Apple Intelligence" delayed and core talent lost, forcing reliance on partners like Google Gemini and Alibaba's Qianwen. Its Q3 FY2026 (Q2 CY) earnings initially seemed stellar. Revenue hit $109.4B (up 16% YoY), with iPhone and Mac sales, growing 22% and 29% respectively, driving most of the growth. However, the stock fell over 8% post-earnings. The primary concern was a weaker Q4 revenue growth forecast of 9-11%, below expectations, due to looming supply chain constraints. Apple is feeling the indirect cost of the AI boom. Soaring memory and chip prices, fueled by massive data center investments from Microsoft, Amazon, and others, are forcing Apple to raise Mac and iPad prices significantly. The upcoming iPhone launch is also expected to see substantial price hikes. Despite avoiding heavy AI infrastructure spending—its capital expenditures are actually down 28%—Apple cannot escape the industry-wide supply and cost pressures. While Apple's operating cash flow remains robust, its substantial R&D spending (up 32% YoY) has yet to yield major AI breakthroughs. As Tim Cook prepares to step down as CEO, Apple faces a challenging transition: balancing its premium hardware success against the strategic and cost pressures of the AI era it has so far cautiously navigated.

marsbitHace 11 min(s)

Low Investment Isn't Apple's Immunity Pass

marsbitHace 11 min(s)

PA Graphics Explanation | One Chart to Understand the Major Web3 Events in August 2026

**PANews Crypto Calendar: Key Web3 Events in August 2026** PANews introduces its revamped crypto calendar, featuring comprehensive coverage, flexible filtering, and easy export options. The market in August will be shaped by multiple key events across macroeconomics, regulation, tokenomics, and project developments: * **Macro & Policy:** Key US economic data releases (July Non-Farm Payrolls, CPI), the Federal Reserve meeting minutes, and the Jackson Hole Economic Symposium will be in focus. On the regulatory front, the US Senate plans to release a new draft of the *CLARITY Act*, while the EU's expanded crypto ban against Belarus comes into effect. * **Token Unlocks:** Significant token unlocks are scheduled for assets including ENA, AVAX, CONX, ZRO, and KAITO, which may influence market volatility. * **Project Updates & Shutdowns:** Several services, including Exchange Art, Ctrl Wallet, Zapper, NFTfi, and Summer.fi, are set to cease operations or undergo major adjustments. Users are advised to manage their assets accordingly. * **Corporate Activity:** Q2 earnings reports from companies like SpaceX, Circle, and Nvidia are due. Unitree Robotics will initiate its IPO subscription on the STAR Market, and Moonshot AI plans to begin a Pre-IPO financing round. * **Industry Events:** Major conferences such as Bitcoin Asia 2026 and the 2026 Digital Expo will take place. The overarching market narrative for August will revolve around macroeconomic expectations, regulatory developments, token unlock schedules, and ongoing industry consolidation.

marsbitHace 21 min(s)

PA Graphics Explanation | One Chart to Understand the Major Web3 Events in August 2026

marsbitHace 21 min(s)

Wall Street's Most Famous 'Cassandra' Now Has His Sights Set on Nvidia

Michael Burry, the famed "Big Short" investor, has once again captured Wall Street's attention with a series of short positions against major tech and semiconductor stocks, most notably Nvidia. In late June and July, through his "Cassandra Unchained" newsletter, Burry disclosed short bets against Nvidia, Tesla, Applied Materials, Caterpillar, the SOXX semiconductor ETF, and later, Micron Technology. His core thesis revolves around potential distortions in the AI infrastructure boom, specifically questioning whether extended depreciation schedules (e.g., 6 years vs. a realistic 2-3 years for AI chips) by cloud giants like Microsoft and Google artificially inflate profits. He also raises concerns about possible "off-balance-sheet circular financing," where chip demand might be propped up by vendor-backed funding to clients. Nvidia's stock experienced volatility following these disclosures, briefly dipping but largely holding near Burry's reported entry points, leaving his positions roughly flat or slightly underwater as of late July. This move is part of a pattern for Burry, whose track record since his legendary 2008 bet is mixed. He has faced notable losses, such as on Tesla in 2021, while scoring on broader market turns like the 2020 pandemic crash. His methodology focuses intensely on free cash flow and scrutinizing original financial documents to spot overvaluation and structural risks, but it often struggles with timing the market. The article contrasts Burry's stance with other prominent investors. Steve Eisman, another "Big Short" figure, is not shorting Nvidia, citing strong fundamentals but expressing nervousness about sustainability. Jim Chanos agrees with the broad "accounting mismatch" concern—comparing it to the dot-com bubble—but targets financial leverage in private equity firms rather than the chip stocks themselves. While Nvidia's short interest remains relatively low at 1.3-1.4% of float, the massive stock size means absolute short losses have been significant, exceeding $5 billion earlier this year. The piece concludes that for ordinary investors, the key takeaway is not replicating specific short bets but learning from the critical frameworks these investors use: questioning rosy accounting, identifying structural vulnerabilities, and maintaining skepticism during market euphoria, even if pinpointing the exact catalyst for a downturn remains elusive.

marsbitHace 46 min(s)

Wall Street's Most Famous 'Cassandra' Now Has His Sights Set on Nvidia

marsbitHace 46 min(s)

Weekly Selection丨Epic Stock Market Volatility, Changxin Tech's IPO Reshapes Storage Landscape, Saylor Aims to Re-Anchor STRC Around September 8th

PANews Weekly Digest: Market Turmoil, Tech Breakthroughs, and Crypto Developments. The week saw significant volatility across global markets. South Korea's KOSPI index experienced extreme turbulence, including multiple trading halts, largely driven by sharp declines in AI hardware stocks like SK Hynix. In contrast, China's Changxin Xinqiao (CXC) achieved a landmark IPO with a market cap surpassing 4 trillion yuan, marking a major success for the domestic DRAM industry after a decade of losses. In the crypto and Web3 space, several key narratives emerged. AI is driving demand for new infrastructure, with projects like AI agent wallets and programmable payments gaining traction, attracting interest from firms like Coinbase. The Bitcoin mining sector is pivoting, with companies like MARA focusing on energy management as electricity becomes a core AI-era asset. Meanwhile, the RWA (Real World Assets) sector faces a "utilization puzzle," with hundreds of billions in on-chain assets remaining dormant. Notable market movements included a historic single-day surge of over 17% for the KOSPI index and a significant migration of $16.5 billion in staked ETH within the Lido ecosystem. Michael Saylor announced a target to re-peg the STRC stablecoin around September 8th. Other highlights include discussions on Ethereum's ambitious 2030 roadmap for scaling and privacy, analysis showing high protocol revenues not always translating to token price gains, and warnings from Citi about potential extreme commodity price shocks by late 2026.

marsbitHace 51 min(s)

Weekly Selection丨Epic Stock Market Volatility, Changxin Tech's IPO Reshapes Storage Landscape, Saylor Aims to Re-Anchor STRC Around September 8th

marsbitHace 51 min(s)

When the Market Begins to Question AI Capex: A Full Analysis of Q2 Earnings Reports from Five Tech Giants

In late July 2026, five major US tech giants—Alphabet, Intel, Microsoft, Meta, and Apple—released their Q2 earnings reports. While all companies exceeded revenue and profit expectations, driven by strong AI-related business growth, investor reactions diverged sharply due to concerns over escalating AI capital expenditures (capex) and their impact on free cash flow. Alphabet reported strong revenue growth and a surging cloud business, but its stock fell after announcing a doubled year-on-year capex and negative quarterly free cash flow for the first time. Intel posted its strongest revenue growth in over 15 years, but its stock experienced volatile trading after significantly raising its full-year capex guidance. Microsoft saw its stock surge after beating estimates and, crucially, lowering its capex forecast while projecting positive free cash flow. Meta faced the most severe sell-off as its profits declined despite revenue beats, with free cash flow plunging over 90% and its capex guidance raised. Apple reported record June-quarter results, but its stock plummeted after providing Q4 revenue guidance that fell short of expectations, citing supply chain constraints and forex headwinds. The overall takeaway is that the market's focus has shifted from validating AI demand to scrutinizing the timeline for returns on massive AI investments. Companies demonstrating a clearer path to managing capex and preserving free cash flow, like Microsoft, were rewarded, while those signaling continued aggressive spending faced investor skepticism.

Odaily星球日报Hace 1 hora(s)

When the Market Begins to Question AI Capex: A Full Analysis of Q2 Earnings Reports from Five Tech Giants

Odaily星球日报Hace 1 hora(s)

Trading

Spot

Artículos destacados

Cómo comprar FET

¡Bienvenido a HTX.com! Hemos hecho que comprar FETCH.ai (FET) sea simple y conveniente. Sigue nuestra guía paso a paso para iniciar tu viaje de criptos.Paso 1: crea tu cuenta HTXUtiliza tu correo electrónico o número de teléfono para registrarte y obtener una cuenta gratuita en HTX. Experimenta un proceso de registro sin complicaciones y desbloquea todas las funciones.Obtener mi cuentaPaso 2: ve a Comprar cripto y elige tu método de pagoTarjeta de crédito/débito: usa tu Visa o Mastercard para comprar FETCH.ai (FET) al instante.Saldo: utiliza fondos del saldo de tu cuenta HTX para tradear sin problemas.Terceros: hemos agregado métodos de pago populares como Google Pay y Apple Pay para mejorar la comodidad.P2P: tradear directamente con otros usuarios en HTX.Over-the-Counter (OTC): ofrecemos servicios personalizados y tipos de cambio competitivos para los traders.Paso 3: guarda tu FETCH.ai (FET)Después de comprar tu FETCH.ai (FET), guárdalo en tu cuenta HTX. Alternativamente, puedes enviarlo a otro lugar mediante transferencia blockchain o utilizarlo para tradear otras criptomonedas.Paso 4: tradear FETCH.ai (FET)Tradear fácilmente con FETCH.ai (FET) en HTX's mercado spot. Simplemente accede a tu cuenta, selecciona tu par de trading, ejecuta tus trades y monitorea en tiempo real. Ofrecemos una experiencia fácil de usar tanto para principiantes como para traders experimentados.

105 Vistas totalesPublicado en 2024.12.11Actualizado en 2026.06.02

Cómo comprar FET

Discusiones

Bienvenido a la comunidad de HTX. Aquí puedes mantenerte informado sobre los últimos desarrollos de la plataforma y acceder a análisis profesionales del mercado. A continuación se presentan las opiniones de los usuarios sobre el precio de FET (FET).

活动图片