Bit360
06/15 06:35
Can price of SUI follow its chain activity?
Can price of SUI follow its chain activity?
Despite growth in chain activity, SUI price was correcting lower to a major demand area around $2.80 -3.00 after losing its pace over the $3.50 resistance.
The rejection at around $4.00 earlier in the month of May confirmed the falling trend, and SUI found itself at a crossroad.
The MACD histogram continued to be negative and the MACD line was below the signal line, indicating a bearish momentum.
However, provided that the $3 support level held, SUI could attempt a recovery to around $3.50. Alternatively, a breakdown would put a route to retest support at around $2.50.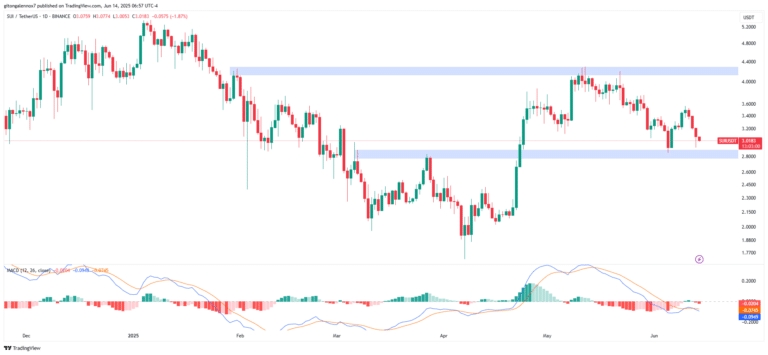
Higher lows were still being honored by the daily structure, but recent candles showed a sign of more selling pressure. To the bulls, it was critical to hold the $2.80 -$3.00 area.
It had a bullish divergence on the MACD which could confirm a bounce.
On the other hand, the further rejection at the $3.20 level and another unsuccessful MACD crossover may drive the trend downwards. Momentum has to change in order to see SUI attacking the $3.50 resistance once more.
Todos los comentarios0Lo más recientePopular