Crypto Express
06/10 01:52
XRP Technical analysis
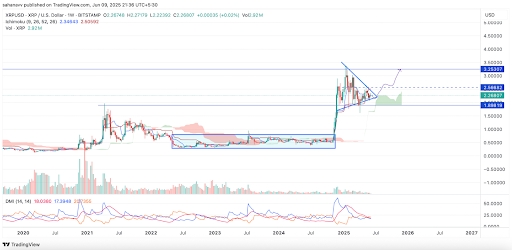
Technically, XRP is currently forming a classic bullish flag pattern on the higher timeframes and hence a breakout could initiate a fresh upswing.
Similar to the daily chart, the weekly chart shows the price being stuck within a decisive symmetrical triangle ever since it faced a rejection from the yearly highs. As seen in the above chart, after breaking above a prolonged consolidation, the XRP is heading towards the edge of the decisive symmetrical triangle. The volume has drained to a large extent, signifying an extreme squeeze. On the other hand, the conversion line of the Ichimoku has turned into a strong support, while the baseline is a resistance. Besides, the DMI levels have converged, validating a squeeze.
A bullish breakout could initiate a bullish crossover, which may push the levels above $2.5, which is a crucial resistance to achieve. Once done, the XRP price is expected to maintain a healthy upswing to form new highs. Meanwhile, the Nasdaq files its crypto expansion, adding up 4 more cryptos, which includes XRP, which could be a major bullish signal for the token. The impending Ripple vs. SEC outcome, along with a potential ETF and now Nasdaq inclusion, suggests more green days for the fourth-largest token.
Considering the current trade setup, the $10 target for the XRP price rally could be realistic, while the timeline could be extended ahead of 2025.
#Share Your Thoughts on Popular Assets in June#Check In to Win a 20g Gold Bar#Claim1,200 USDT in the Monthly Creation Challenge
25Compartir
Todos los comentarios0Lo más recientePopular