The live price of RenderToken (RENDER) is $1.73 USD and its current market capitalization is $-- USD.
Get real-time RENDER/USD updates on HTX. Stay informed with the latest data and market trends to make smart trading decisions. HTX, your trusted source for accurate cryptocurrency price information.
Track RenderToken price movements with chart views spanning 1 day, 30 days, 60 days, 90 days, 1 year, and the period since it was listed on HTX.View more data for the RenderToken prices
Time
Change
Change%
Highest Price
Lowest Price
No data
RENDER Market Information
Get the latest RenderToken price details on HTX: 24-hour high and low, all-time high (ATH), and daily price change percentage.
24h Low
$0
24h High
$0
All-Time High
$0
Market Cap
$0.00
24h Volume (USD)
$--
Circulating Supply
--
What is RENDER?
RenderToken (RENDER) is a distributed GPU rendering network built on top of the Ethereum blockchain, aiming to connect artists and studios in need of GPU compute power with mining partners willing to rent their GPU capabilities out.
It's super easy to buy RENDER on HTX. Simply click here to view a complete guide to buying RenderToken with ease.
Real-Time RENDER Markets
View real-time RenderToken prices on HTX's spot markets. Switch between spot and futures markets to instantly compare live prices and 24-hour price changes.
Based on the historical performance of RenderToken, our prediction tool estimates that the price of RenderToken (RENDER) could reach -- by --.
Predicted RENDER Price in --
Our most recent forecast indicates the price of RenderToken (RENDER) will increase to -- by --, with a price change of --% and a cumulative ROI of approximately --%.
Buy your first RENDER on HTXSign Up
RENDER FAQs
QWhat is the RenderToken (RENDER) price today?
AThe current price of RenderToken (RENDER) is $1.73 USD.
QWhat is the RenderToken (RENDER) market cap?
AThe current market capitalization of RenderToken (RENDER) is $0.00 USD, calculated by multiplying its circulating supply by its current price.
QWhat is the RenderToken (RENDER) circulating supply?
AThe current circulating supply of RenderToken (RENDER) is -- RENDER.
QWhat is the RenderToken (RENDER) all-time high?
AAs of 2026-06-16, the all-time high of RenderToken (RENDER) is $0 USD.
QWhat is the RenderToken (RENDER) 24h trading volume?
AThe 24-hour trading volume of RenderToken (RENDER) is -- USD on HTX.
QCan I buy RenderToken (RENDER) on HTX?
AYes, HTX offers industry-leading trading fees and deep liquidity, ensuring a smooth and secure RenderToken (RENDER) purchase experience.
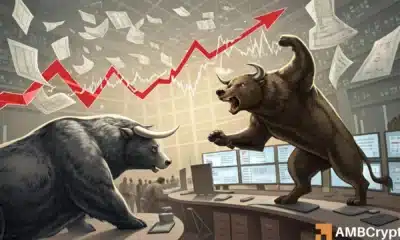
RENDER token experienced a significant surge of 4.21%, with its price climbing from a low of $2.33 to a high of $2.70, currently trading around $2.43. The daily trading volume exploded by 229.41%, reaching $245.14 million, while the market cap stands at $1.27 billion. Technical indicators suggest bullish momentum, with MACD above the signal line, a CMF of 0.11 indicating moderate buying pressure, and an RSI of 57.23 showing room for further upside. Key resistance levels are at $2.49 and $2.55, while support lies near $2.37 and $2.31. The market shows cautious optimism with slight bullish dominance.
RENDER surged 22% to a 2-month high of $2.7, breaking above key EMAs, but retraced to $2.47 with an 8.2% daily gain. Volume spiked 230%, indicating renewed interest. On January 11, buyers dominated with high accumulation volume and strength, though sellers later increased profit-taking. Futures activity rose sharply, with open interest up 30.96% and a long/short ratio of 1.02, reflecting bullish sentiment. The RSI dipped from 69 to 75 but remains in bullish territory. If buyer momentum continues, RENDER could retest $2.7 and target $3.5; increased selling pressure may push it down to $2.1.
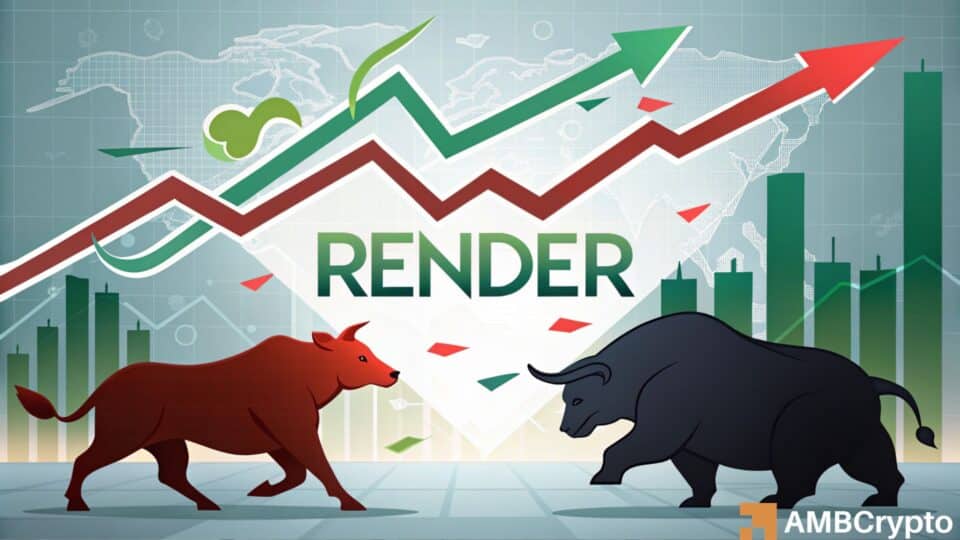
Despite an impressive 85% price surge in early January, Render (RENDER) has since retraced, with Open Interest declining nearly 30%. Although it broke past the key $2 resistance, the price has returned to that level, failing to break the longer-term downtrend or surpass November's $2.94 high. While indicators like OBV and RSI show some bullish momentum, the liquidation map suggests a potential drop to the $1.86-$1.88 zone. Traders are advised to wait for a dip toward $1.80 before considering buys, expecting a rebound above $2.15 afterward. The overall structure remains bearish despite recent stability above $2.
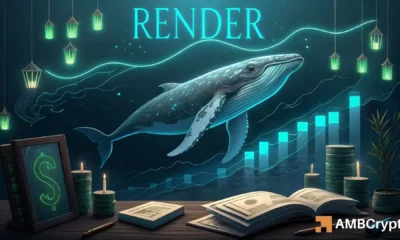
Render (RNDR) surged 12% in 24 hours, largely driven by broader dollar weakness following lower-than-expected CPI data, which boosted risk assets like cryptocurrencies. Two key factors supported the rally: a significant spike in whale orders, indicating strong conviction and potential accumulation rather than distribution, and a notable increase in both spot and futures trading volume, reflecting heightened market participation and momentum. However, the token faces resistance near prior distribution zones. For the rally to sustain, bulls must absorb selling pressure, with a key liquidity cluster around $1.680 potentially triggering a breakout if whale interest and trading activity remain elevated.
Render (RENDER) surged 11.23% to $1.91, reaching a three-week high, with trading volume rising 48% to $81.5 million. Derivatives data showed strong bullish sentiment, as Open Interest increased by 21% to $60 million and the Long/Short Ratio rose to 1.28, indicating dominant long positions. However, spot netflow turned positive at $460k, suggesting increased selling pressure as profit-taking resumed. Technical indicators like the RSI at 64 and positive DMI signal strong upward momentum, but if profit-taking intensifies, RENDER could retrace to the $1.6 support level. Breaking the $2 resistance is possible if bullish conditions persist.
ambcrypto2026.04.03
Threads
Welcome to the HTX Community. Here, you can stay informed about the latest platform developments and gain access to professional market insights. Users' opinions on the price of RenderToken (RENDER) are presented below.
Related Questions
Welcome to the Crypto FAQ. Users' questions and answers on RenderToken (RENDER) are presented below.