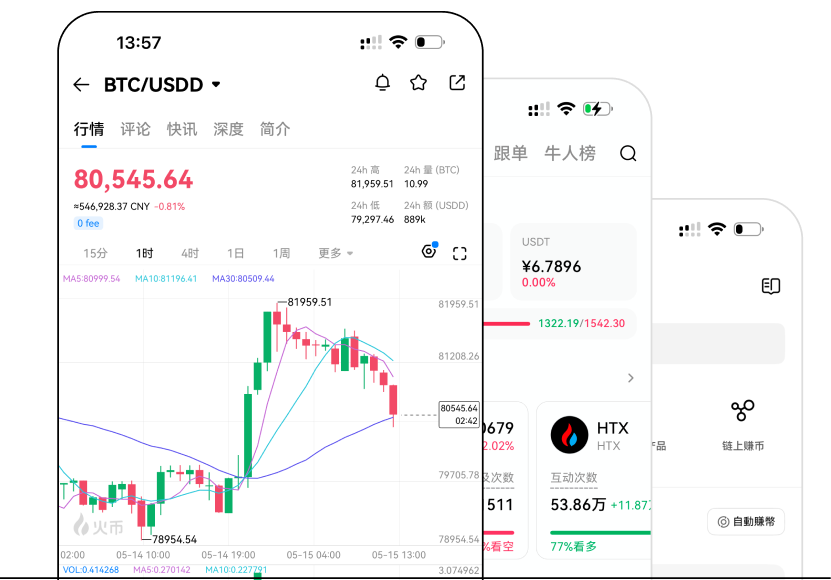
This page displays the daily OHLCV historical price data for AiAkita AIAKITA/USDT, covering the period from -- to --, with a total of 0 complete records. The most recent complete period is --, and the data was generated at --. The highest price in this dataset is -- on --, and the lowest price is -- on --. Historical data does not represent future performance.
Data Snapshot
Historical prices do not represent future returns. The information on this page does not constitute investment advice.
30D Change--
60D Change--
90D Change--
1Y Change--
Data SourceHTX Spot Market
Generation Time--
Latest Complete Period--
Time ZoneUTC+8
Quote CurrencyUSDT
Data Coverage--
Search Historical Prices by Period and Date

No records
Sign up and trade to win rewards worth up to 1,500 USDT.Join Now About AiAkita Price History
Keeping an eye on how the price of AiAkita changes over time is super important for people who invest in cryptocurrencies. It helps them see how their investments are doing. This tool shows everything from when AiAkita starts trading each day to when it hits its highest and lowest prices and when it finishes trading. It also shows how much AiAkita is being traded each day. Plus, it quickly tells you if the price changed a lot on any given day.All the price info here comes straight from HTX, so you know it's reliable. You can get historical price data for AiAkita for different timeframes like 1 day, 1 week, or 1 month. It covers everything from how much it started trading for to its highest and lowest prices and how much was traded. This data is checked carefully to make sure it's accurate, making it great for testing trading strategies. You can download this data for free and it's always being updated, which is really helpful for investors.
Gain a Trading Edge with AiAkita Historical Data
Historical data for AiAkita provides a foundation for developing effective trading strategies. Here’s how traders can make the most of this data:
- Technical Analysis
Traders use historical AiAkita data to identify market trends and patterns. They analyze these patterns using tools such as charts to help them make informed buying and selling decisions. An effective approach is to store historical AiAkita data in GridDB and analyze it with Python using visualization tools such as Matplotlib and data analysis libraries such as Pandas, NumPy, and SciPy.
- Prediction
Analyzing historical data is crucial for forecasting AiAkita price movements. By studying historical trends, traders can gain insights into potential future market behavior. HTX provides detailed historical data for AiAkita, recorded at one-minute intervals and including open, high, low, and close prices. This data is essential for building predictive models and helping investors make informed trading decisions.
- Risk Management
Accessing historical data enables traders to assess the risks associated with investing in AiAkita. Understanding the volatility of AiAkita helps them make more informed investment decisions.
- Portfolio Management
Historical data helps traders track investment performance over time. Traders can identify underperforming assets and adjust their portfolios accordingly to pursue higher returns.
- Training Trading Bots
Historical market data downloaded for AiAkita can be used to train Trading Bots for AiAkita and help improve their performance in the market. These tools and resources allow traders to analyze the historical data of AiAkita in depth, gain valuable insights, and potentially optimize their trading strategies.
How to Analyze AIAKITA Candlestick Charts
First, understand historical candlestick patterns and market conditions, then learn the intended use cases of different automation tools. This page does not automatically recommend strategies or generate parameters from historical data. The following content does not constitute investment advice, and all Trading Bot products are non-principal-protected.
How to Read AIAKITA Candlesticks
Candlestick Chart Basics: A Quick Guide
The horizontal axis of a candlestick chart represents time, while the vertical axis represents price, similar to line and bar charts. Each candlestick uses two colors: green indicates that the closing price is higher than the opening price (the price increased), while red indicates that the closing price is lower than the opening price (the price decreased).
Basic Components of Candlesticks
By combining OHLC (open, high, low, close) prices and volume, you can observe volatility ranges, trend directions, and potential trend reversals, which form the foundation of technical analysis.
Use Historical Market Data to Assess Market Conditions
Bullish Trend
Prices continue to rise, with predominantly green candles. Grid bots may still miss one-way market moves depending on the parameters set.
Bearish Trend
Prices continue to fall, with predominantly red candles. Grid bots may keep buying as prices decline, potentially increasing unrealized losses.
Sideways
Prices fluctuate within a range, which is the primary market scenario for range grid trading bots. However, profits are not guaranteed.
Grid Bots Overview
Risk Reminder: Grid and Trading Bot products are non-principal-protected and may result in the total loss of principal. Past market performance and backtest results do not represent future returns. This page does not provide personalized advice for choosing Trading Bots. Please read the product terms before use and make decisions based on your own risk tolerance.
Range-Bound MarketExecutes buy and sell orders automatically within a preset price range. Range breakouts, trading fees, and parameter settings may affect final results.
Profit from Market VolatilityFutures Grid automatically executes batch trades to profit from price fluctuations. Because it uses leverage, it is highly susceptible to liquidation and significant losses during one-way trends.
Rebound After a PullbackAdd positions in batches during pullbacks according to preset rules. Consecutive declines can rapidly increase position exposure and capital risk.
FAQ
What is the historical price data for AiAkita on htx.com?
HTX.com provides comprehensive historical price data for AiAkita, including open, high, low, close, and volume information. The data is available at various granularities, such as minute-level, hourly, daily, and monthly, allowing users to analyze AiAkita's price history in detail.
How often is the historical price data for AiAkita updated on htx.com?
HTX.com updates the historical price data for AiAkita in real-time. As new price information becomes available, it is automatically added to the historical data, ensuring that users have access to the most up-to-date and accurate price history for AiAkita.
How does htx.com's historical price data for AiAkita compare to other data providers?
HTX.com strives to provide the most reliable, accurate, and comprehensive historical price data for AiAkita. Our data is sourced from multiple trusted exchanges and undergoes rigorous validation processes to ensure its quality. We offer competitive data granularity, update frequency, and ease of access compared to other data providers in the market.
Can I view AiAkita's price history on htx.com for a specific date range?
Yes, htx.com allows users to view AiAkita's price history for a specific date range. On the /price/AiAkita/historical-data page, you can use the date picker to select your desired start and end dates, or you can manually enter the date range. The historical price data will be displayed accordingly.
What are the sources of htx.com's historical price data for AiAkita?
HTX.com aggregates historical price data for AiAkita from multiple reputable cryptocurrency exchanges. We carefully select our data sources to ensure the highest level of data integrity and reliability. Our data undergoes strict validation and normalization processes to maintain consistency and accuracy across all sources.
Can I download AiAkita's historical price data from htx.com in various formats (e.g., CSV, JSON)?
Yes, htx.com provides the option to download AiAkita's historical price data in various formats, including CSV and CHECKSUM. On the /price/AiAkita/historical-data page, you will find a 'Download' button that allows you to select your preferred format and download the data for further analysis or integration with other tools.
How can I use AiAkita's historical price data from htx.com for technical analysis or backtesting?
AiAkita's historical price data from htx.com is a valuable resource for technical analysis and backtesting. You can use the data to calculate various technical indicators, identify trends and patterns, and test trading strategies. Our data is available in formats compatible with popular analysis tools and libraries, making it easy to integrate into your workflow.
What is the update frequency of historical data?
HTX.com updates the historical price data for AiAkita in real-time. As new price information becomes available from our data sources, it is immediately incorporated into the historical data. This ensures that you always have access to the most recent and accurate price history when conducting analysis or making trading decisions.
View AIAKITA Related Pages
The price history page covers historical data only. Live prices, futures scenarios, purchasing, project insights, and conversions each have their own dedicated SEO pages.
Real-Time PriceAIAKITA Price
Current price, market data, 24h performance, and real-time market updates.
View Current Price PredictionAIAKITA Price Prediction
View the prediction period, key assumptions, scenario results, and risk disclosures.
View Price Prediction Project InfoAbout AIAKITA
Learn about the AiAkita network, AIAKITA use cases, supply mechanism, and project risks.
View Token Page Crypto ConversionConvert AIAKITA to USDT
Get market quotes or real-time convert quotes. Do not confuse these with exchange rates.
Visit Convert Page Buying GuideHow to Buy AIAKITA
View purchase steps, supported methods, account requirements, and regional availability.
View Now What to Know Before Using Historical Price Data
Historical data is suitable for research and comparison, but it cannot replace real-time market data, trade confirmations, or future price predictions.
Past Performance Does Not Indicate Future Returns
Past price fluctuations, historical highs, and volatility do not guarantee future prices or returns.
Not Real-Time Execution Quotes
The price history page displays only records for completed periods. For real-time prices and order book depth, please check the price page or trading market.
Exchange Data May Vary
Differences in liquidity, trading pairs, and aggregation methods across platforms may cause variations in OHLCV data.
Delays and Missing Data May Occur
Data source timeouts, trading halts, or no trades may result in delays or N/A values. The page will never display 0 as a substitute.
Quote Currency Affects Results
BTC/USDT and BTC/USD are not the same dataset. Please confirm the quote currency and time zone before making comparisons.
Not Investment Advice
This page is for informational and data research purposes only and does not constitute an offer or recommendation to buy, sell, hold, or guarantee returns.
View AIAKITA Current Price or Download Historical Data
The price history page provides searchable, verifiable, and downloadable data. For live market quotes and trading, please visit the corresponding pages.