XRP Bulls and Bears on the Brink of Showdown: Prolonged Resistance Attack Fails as Bears Gather Strength

金色财经Published on 2025-12-08Last updated on 2025-12-08

Abstract

XRP Price Analysis: Key Resistance Test at $2.10 XRP has initiated a rebound above the $2.050 support level, showing positive momentum but facing significant resistance near $2.10. The price is currently trading above $2.060 and the 100-hour Simple Moving Average. A connected descending trendline is forming with resistance near $2.090 on the XRP/USD hourly chart. If buyers manage to push the price above the $2.10 barrier and secure a close above $2.160 (the 76.4% Fibonacci retracement level of the recent drop from the $2.2130 high to $1.990 low), further upward movement toward $2.220, $2.280, and possibly $2.350 could follow. The next major resistance sits near $2.450. However, failure to break above $2.10 could trigger a fresh decline. Initial support is near $2.050, followed by a major support at $2.00. A break below $2.00 might lead to a drop toward $1.9650, with further downside potential toward $1.920 and even $1.850. Technical indicators show the hourly MACD is gaining momentum in the bullish zone, and the RSI is above 50, suggesting near-term strength. Key support levels are $2.020 and $2.00, while key resistance levels are $2.10 and $2.160.

XRP price started a rebound above $2.050. The price is currently showing positive signs, but it may struggle to break through the resistance at $2.10.

  • XRP price started a rebound above $2.050.

  • The price is currently above $2.060 and the 100-hour simple moving average.

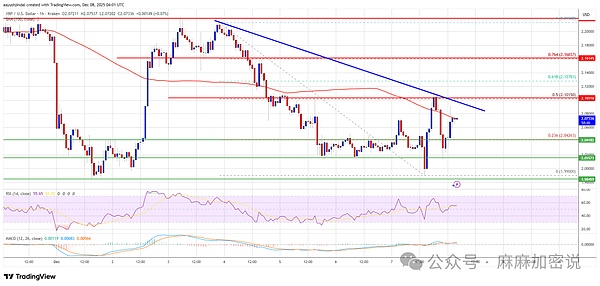
  • On the XRP/USD hourly chart, a connecting downtrend line is forming with resistance near $2.090 (data source: Kraken).

  • If the pair stabilizes above $2.160, it could continue to rise.

XRP Price Faces Severe Challenges

XRP price found support above $2 and started to rebound, similar to Bitcoin and Ethereum. The price climbed above $2.020 and $2.050, entering an upward range.

The XRP/USD price clearly broke through the 23.6% Fibonacci retracement level of the decline from the $2.2130 high to the $1.990 low. However, the price is currently facing resistance near $2.10. Additionally, on the XRP/USD hourly chart, a connecting downtrend line is forming with resistance near $2.090.

The price is currently above $2.060 and the 100-hour simple moving average. If the price continues to rise, it may encounter resistance near $2.10 and near the trendline. The first major resistance is near $2.1250.

A close above $2.1250 could test $2.160, the 76.4% Fibonacci retracement level of the decline from the $2.2130 high to the $1.990 low. The next resistance is at $2.220. A decisive break above the $2.220 resistance could push the price further towards the $2.280 resistance. Further gains might lead to a test of the $2.350 resistance. The next major resistance for the bulls could be near $2.450.

Another Decline?

If XRP fails to break through the $2.10 resistance, it could start another decline. The initial support on the downside is near $2.050. The next major support is near $2.00.

If the price breaks down and closes below $2.00, it could continue to fall towards $1.9650. The next major support is near $1.920. A break below this support could lead the price to test $1.850.

Technical Indicators

Hourly MACD – The MACD for XRP/USD is currently accelerating in the bullish zone.

Hourly RSI (Relative Strength Index) – The RSI for XRP/USD is currently above the 50 level.

Major Support Levels – $2.020 and $2.00.

Major Resistance Levels – $2.10 and $2.160.

Related Questions

QWhat is the key resistance level that XRP is struggling to break above according to the article?

AThe key resistance level that XRP is struggling to break above is $2.10.

QWhat is the significance of the $2.160 price level for XRP?

AThe $2.160 level is the 76.4% Fibonacci retracement level from the drop from the $2.2130 high to the $1.990 low. A close above this level could allow the price to continue rising.

QWhat are the two main technical indicators mentioned, and what do they currently signal?

AThe two main technical indicators mentioned are the hourly MACD and the hourly RSI. The MACD is accelerating in the bullish zone, and the RSI is currently above the 50 level, both indicating positive momentum.

QWhat could trigger a new decline in the XRP price?

AA new decline could be triggered if XRP fails to clear the $2.10 resistance zone.

QWhat are the listed major support levels if the price starts to decline?

AThe listed major support levels are $2.020 and $2.00. A break below $2.00 could lead to further declines towards $1.9650 and $1.920.

Related Reads

Solana's Two Leading Lending Protocols Clash, Foundation Steps In to Mediate

Summary: Over the weekend, a public dispute erupted between Solana's two leading lending protocols, Jupiter Lend and Kamino, centered on the definition of "risk isolation." The conflict began when Kamino's co-founder, Marius Ciubotariu, accused Jupiter Lend of misleading users. He argued that Jupiter's early marketing claimed its lending pools were "risk-isolated," preventing cross-contamination between assets. However, Kamino contends that Jupiter Lend's design, which allows for the rehypothecation (re-use) of collateral across pools, creates a risk of contagion, contradicting its marketing. In response, Jupiter's COO, Kash Dhanda, admitted the initial "zero contagion risk" social media posts were inaccurate and apologized. The debate highlights a core disagreement on the definition of "risk isolation." Jupiter and its supporters argue the term has design flexibility, noting that while pools share a liquidity layer, each has independent parameters. Kamino and its allies insist that any rehypothecation negates true risk isolation. The dispute escalated when Tushar Jain, a partner at Kamino investor Multicoin Capital, strongly criticized Jupiter, accusing the team of being either incompetent or deliberately misleading. In contrast, Solana Foundation President Lily Liu urged for cooperation, emphasizing that the Solana lending market is much smaller than Ethereum's and that internal conflict only helps competitors. The clash is seen as an inevitable result of intense competition. Kamino was long the Solana lending leader, but Jupiter Lend has rapidly gained significant market share. In a tighter market with reduced liquidity and heightened safety concerns, the competition between the two protocols has become increasingly fierce.

marsbit10m ago

Solana's Two Leading Lending Protocols Clash, Foundation Steps In to Mediate

marsbit10m ago

Trading

Spot
Futures
活动图片