Author: danny
Original Title:
Why Do the Memes You Buy Only Fall? — Deconstructing the Growth Spiral and Volume of Memes Using First Principles
In the eyes of most people, Meme coins are irrational狂欢, a fool's赌场. But from a mathematical perspective, the birth of every ten-thousand-fold myth is not accidental; it is actually a middle school spatial geometry evolution word problem.
This article proposes a颠覆性的 perspective: The market value of Meme coins is not "grown" but "propped up." The value of Memes can be calculated!
We are accustomed to focusing on the fluctuations of the Z-axis (price height), but we overlook that what determines life and death is the base radius constructed by the X (narrative density) and Y (propagation nodes) axes. A Meme with only height and no base is just a very thin "needle" that topples with the wind; only by continuously expanding the consensus radius can it support a stable, geometrically growing wealth cone under the gravity of capital.
Note: This article is a popular science article on "financial physics," not a rigorous econometric paper, and is only intended to provide a new perspective for viewing Memes.
1. The Beginning of the Theory: The Three-Dimensional Coordinate System of Memes
In the current cryptocurrency market, Meme coins are often seen as irrational狂欢. But is that really the case?
If we strip away the noise of emotions, KOL shilling, and community bandwagoning, we will find that the birth and death of every phenomenal Meme follows a strict mathematical logic.
The essence of Meme coins is the tokenization of the attention economy. Their market value is not determined by traditional discounted cash flow (DCF) but is jointly constructed by the breadth of the narrative, community resonance, and the explosive power of funds.
For better discussion, we define these factors as the XYZ three-dimensional growth spiral model.
These three axes are not just independent variables; there is a strong reflexivity between them—that is, a change in one variable reinforces another, forming a positive feedback loop.
Let's explain these parameters:
X-axis: Narrative Density and Cultural Memes
Definition: The "genes" of a Meme. Includes the core梗 (e.g., Doge), origin story (e.g., CZ's pet name), cultural symbols (e.g., Pepe the Frog), and the richness of community二次创作.
Key metrics: Narrative originality, replicability, emotional resonance.
Y-axis: Propagation Potential and Node Network
Definition: The transmission pipeline of information. From top-tier nodes (CZ, Elon Musk) to secondary nodes (Alpha Callers, KOLs), and then to end nodes (ordinary retail investors).
Key metrics: Node weight, propagation coverage, shilling frequency.
Z-axis: Fund Flow and Liquidity Carrier
Definition: The monetization result of attention. Includes on-chain fund inflows, liquidity depth—i.e., the沉淀的价值 or the total amount of sell orders that can be承接.
Key metrics: Market capitalization, trading volume, turnover rate, and liquidity (the most important metric).
2. Diagram of the Growth Curve of XYZ Axis Interaction
If we plot these three axes in three-dimensional space, the growth trajectory of a successful Meme will generally show a spiral upward trend: (as shown in the figure below)
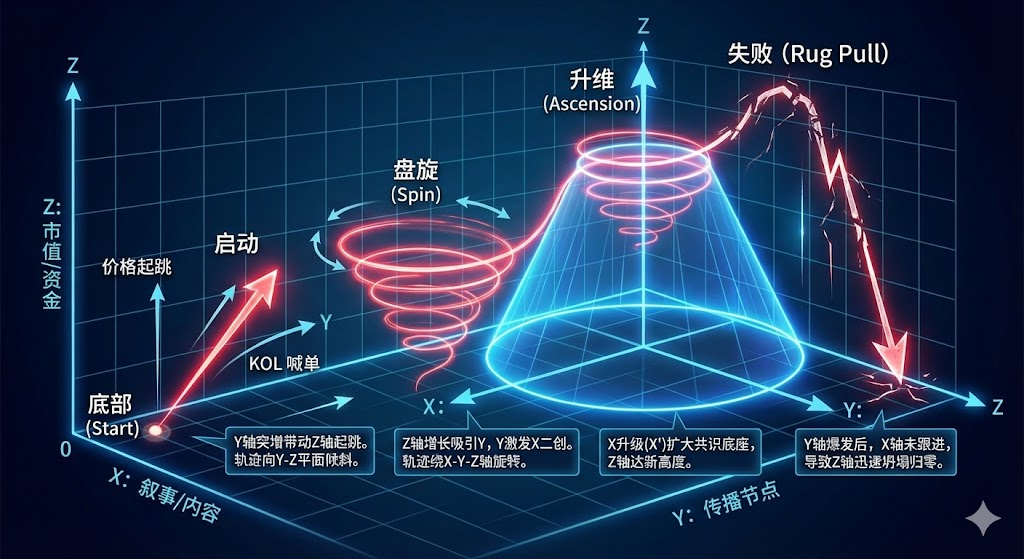
Bottom (Start): X, Y, Z are all close to zero.
Ignition: The Y-axis surges (KOL shilling), driving the Z-axis (price) to jump. The trajectory line tilts toward the Y-Z plane.
Spin: The growth of the Z-axis attracts more Y (more people discussing), and Y stimulates X's二次创作 (enriching content). The trajectory line begins to rotate around the X-Y-Z axes.
Ascension: As X is upgraded (X'), the base area of the cone expands (broader consensus range), and the Z-axis (market capitalization) reaches a new height.
Failed Meme (Rug Pull): Usually表现为 the Y-axis爆发后, the Z-axis briefly rises, but the X-axis fails to follow up with an upgrade (narrative scarcity), causing the Z-axis to quickly collapse to zero. The trajectory line shows an inverted V-shaped fall.
3. Evolution of the Growth Curve: The Spiral Ascension of Four Stages
From the previous section, we know that the lifecycle of a Meme is not linear but a vortex that continuously expands around the Z-axis (fund flow). In this section, we will analyze it based on the four development stages of Memes.
The figure below shows its standard evolution path: (I was also shocked at how cool AI drew it?!)