Ether (ETH) has oscillated around $3,000 for the past three weeks, a consolidation period following its flash crash to $2,620 on Nov. 21. Ether traders are now questioning the likelihood of a further correction if support at $2,800 is lost.
Key takeaways:
Ether slid below $3,000 again due to a lack of futures demand and aggressive selling by long-term holders.
Declining Ethereum network fees and activity suggest lower onchain demand.
Weak technical setups warned of a drop to $2,300 if the next support is lost.
ETH price stuck between two trendlines
Ether’s recent recovery was rejected by resistance from the 50-day exponential moving average (EMA), which currently sits at $3,260, as shown on the daily chart below.
Related: Ether price trend forecasts triple-digit rally as ETH ETF inflows resume
This move, however, saw ETH/USD find support from the $2,800-$2,600 demand zone. The 200-week EMA is currently within this zone.
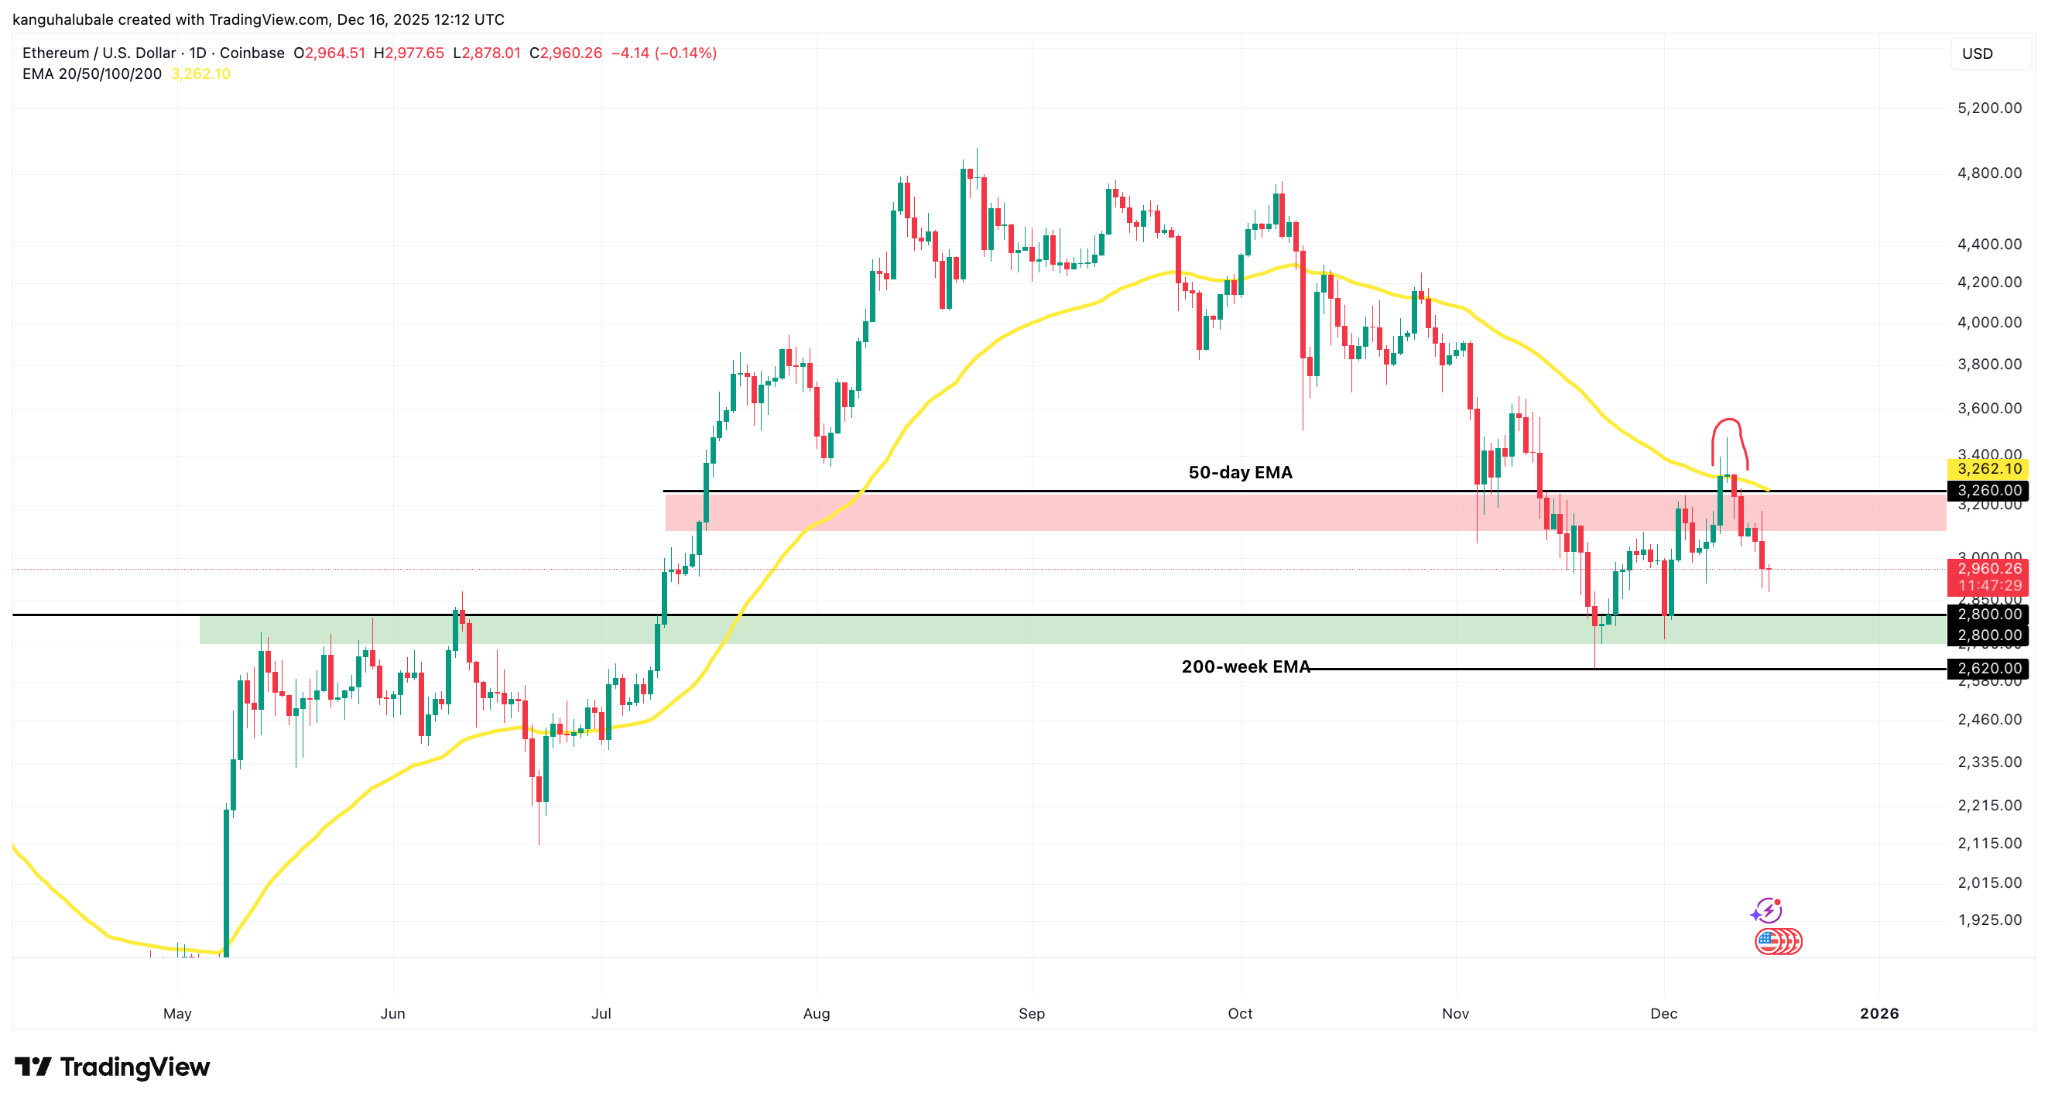
ETH must rise above the resistance at $3,000 and surpass the 50-day EMA to break out of consolidation for a sustained recovery toward $4,000.
The Glassnode cost basis distribution heatmap showed resistance between $3,100 and $3,250, where investors acquired roughly 5.9 million ETH.

On the downside, the key support area is around $2,800, where 5.8 million ETH were previously purchased.
Ether price lacks bullish momentum
Ether futures are currently trading at a 3% premium relative to bearish ETH spot markets, reflecting declining demand from buyers using leverage.
In bearish market conditions, futures premiums typically stay below 5%, signaling weak demand for leveraged long positions and less optimism among traders.
More concerningly, even last week’s recovery to $3,750 did not restore sustained bullish sentiment among traders.

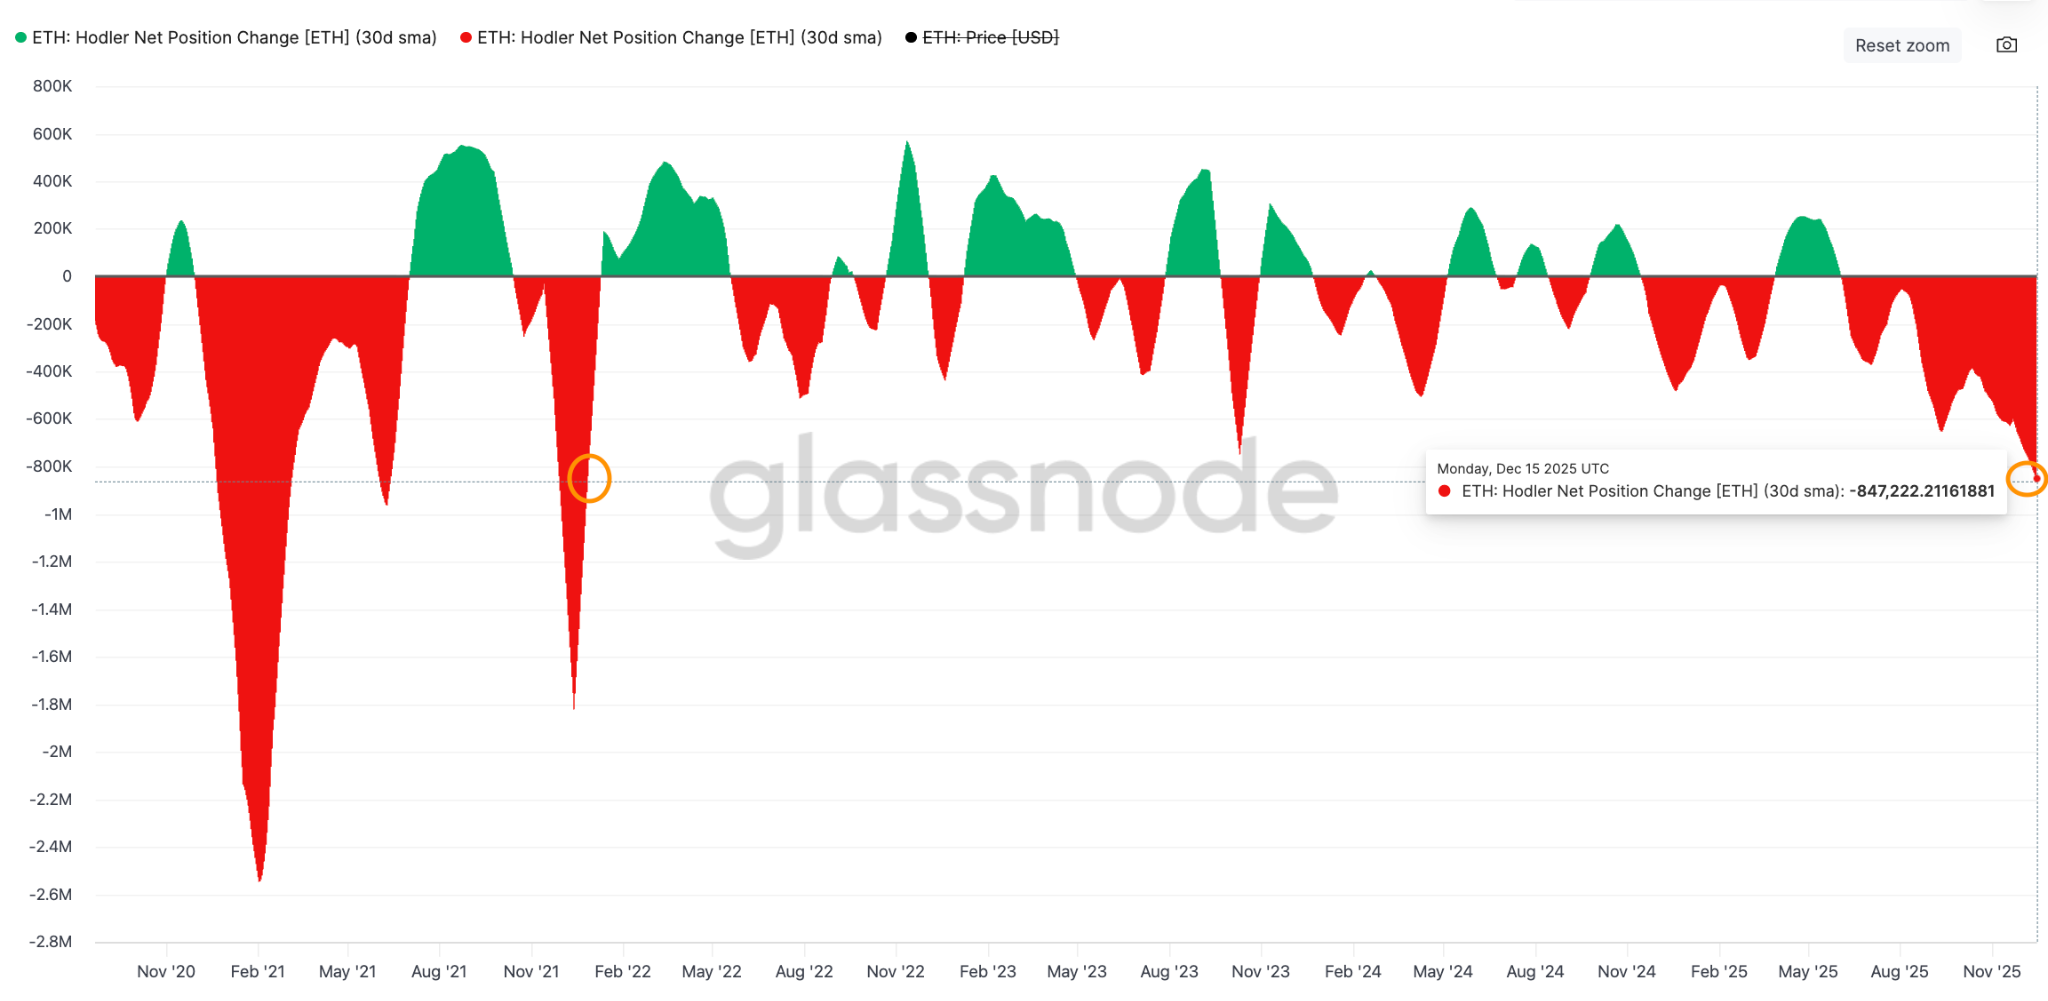
The bearish trend in Ether futures coincided with a decline in long-term holder supply, which has decreased by 847,222 coins over the past 30 days, the largest drop since January 2021. This adds to the sell-side pressure that keeps ETH from staying above $3,000.
Ether’s inability to stay above $3,000 can also be attributed to the decline in Ethereum network fees, although this issue has affected the entire cryptocurrency market.
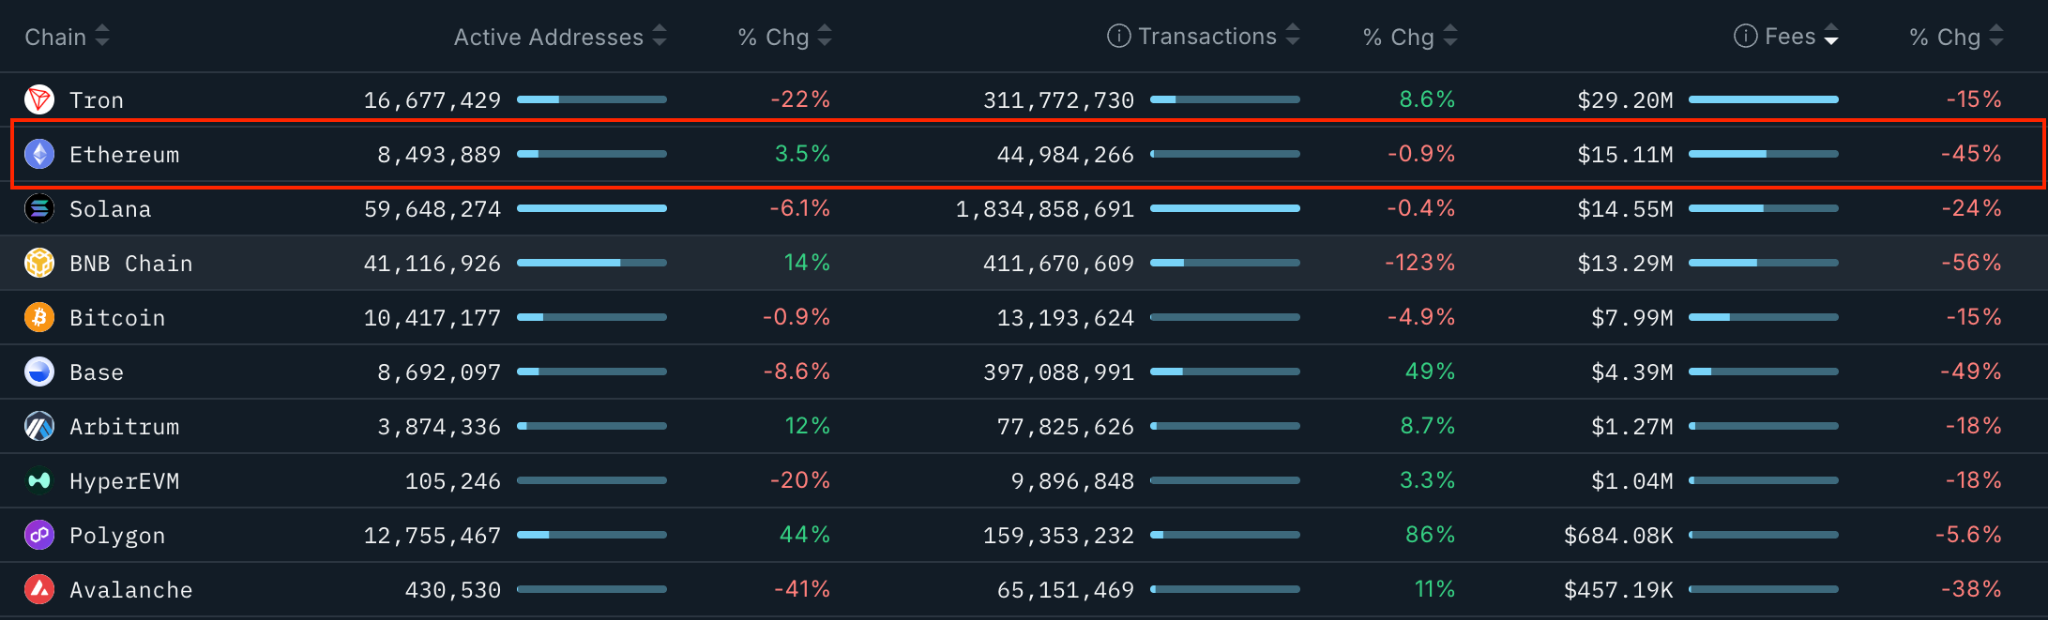
Ethereum chain fees totaled $15.1 million over the past 30 days, representing a 45% decrease from the previous month. By comparison, fees on BNB Chain dropped 56%, and Tron experienced a 15% decline.
Although the number of active addresses on Ethereum’s base layer increased by 3.5% over the same period, it has decreased by 14% over the last seven days. The number of transactions is down by 11% over a seven-day period.
Ethereum bears target $2,300 ETH price
The ETH/USD pair has validated a bear flag on the daily chart after dropping below its lower boundary at $3,200, as shown below.
“Ethereum is consolidating after a sharp sell-off, forming a bear flag beneath prior support near the 3,173 to 3,250 zone,” said analyst Danny Naz in an X post on Sunday, adding:
“That area has flipped to resistance.”
The measured target of the flag is $2,300, representing a 22% drop from the current price.

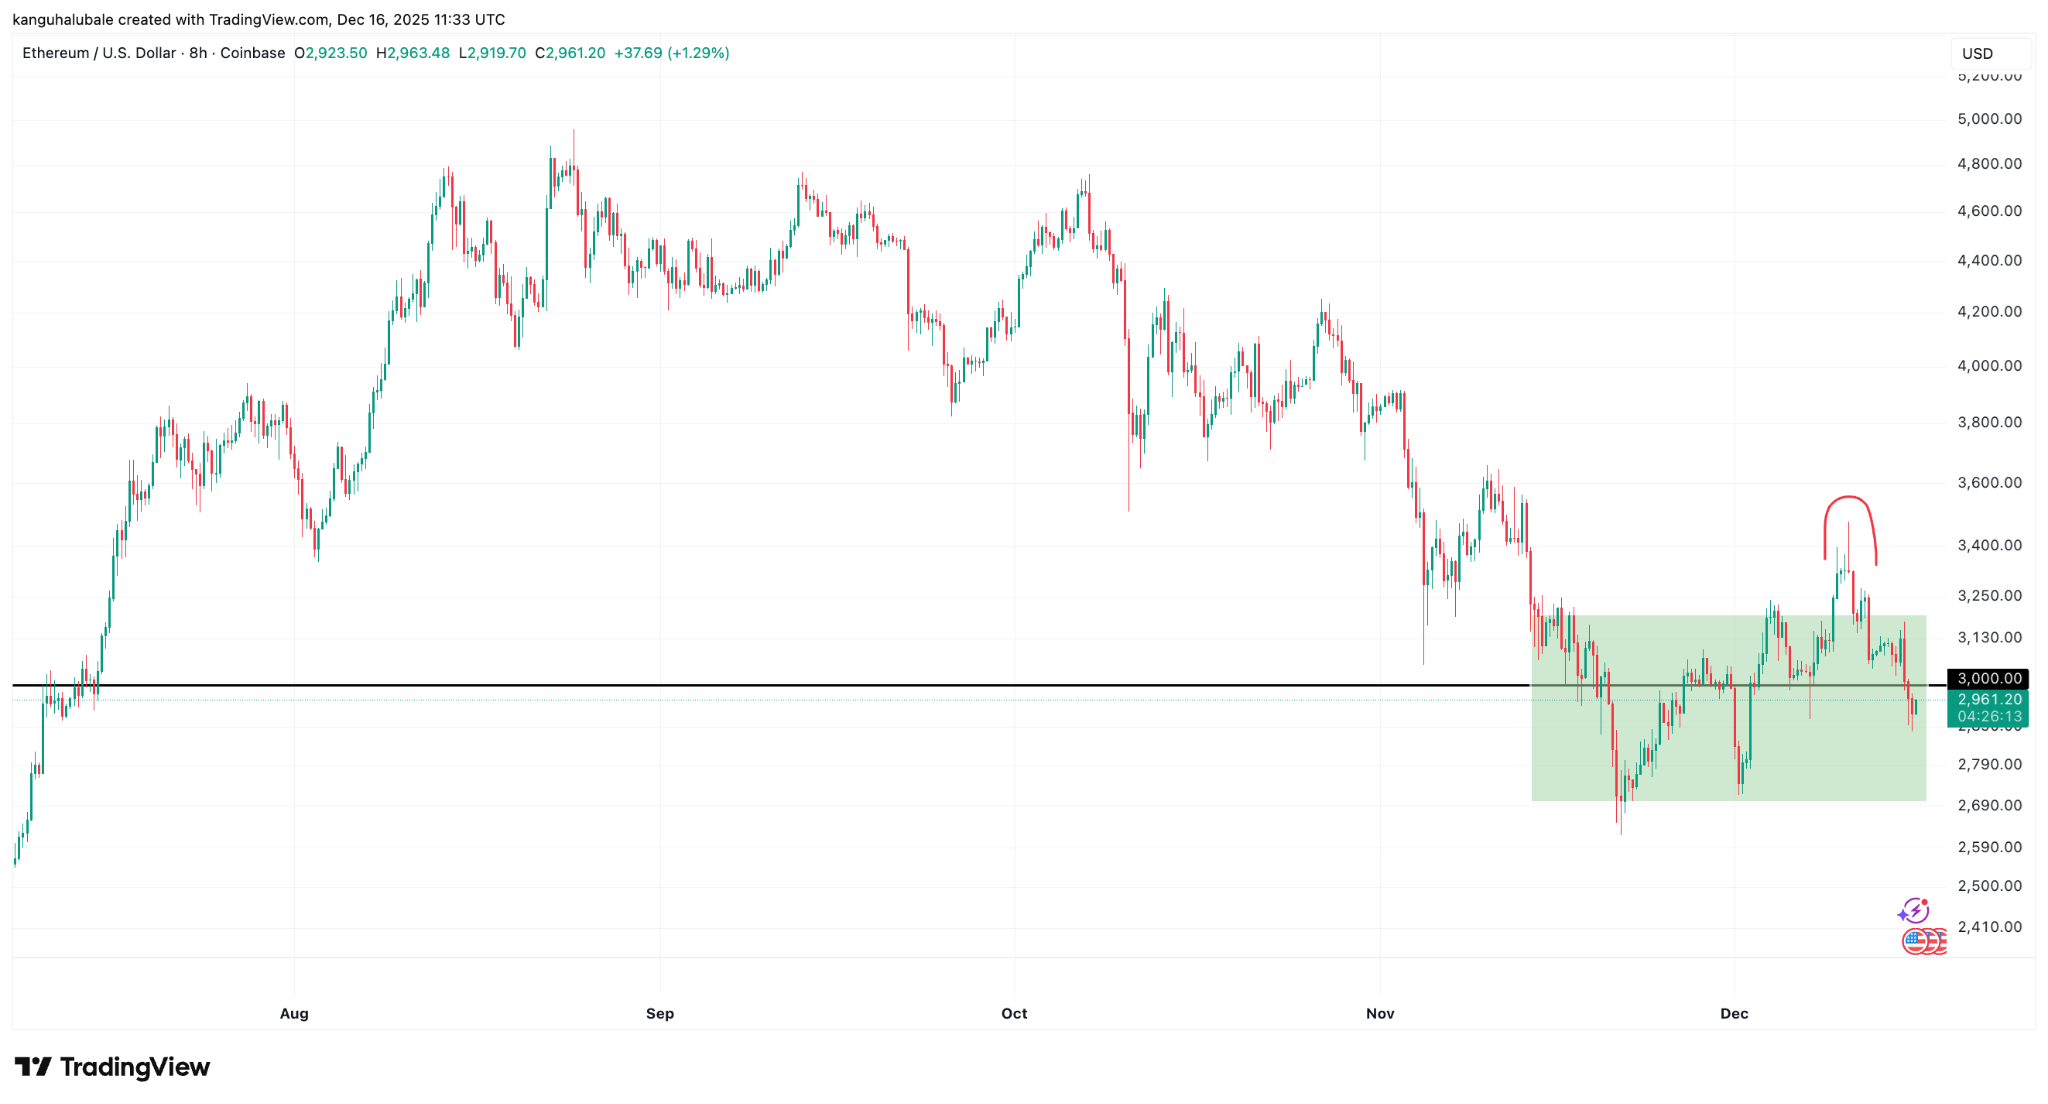
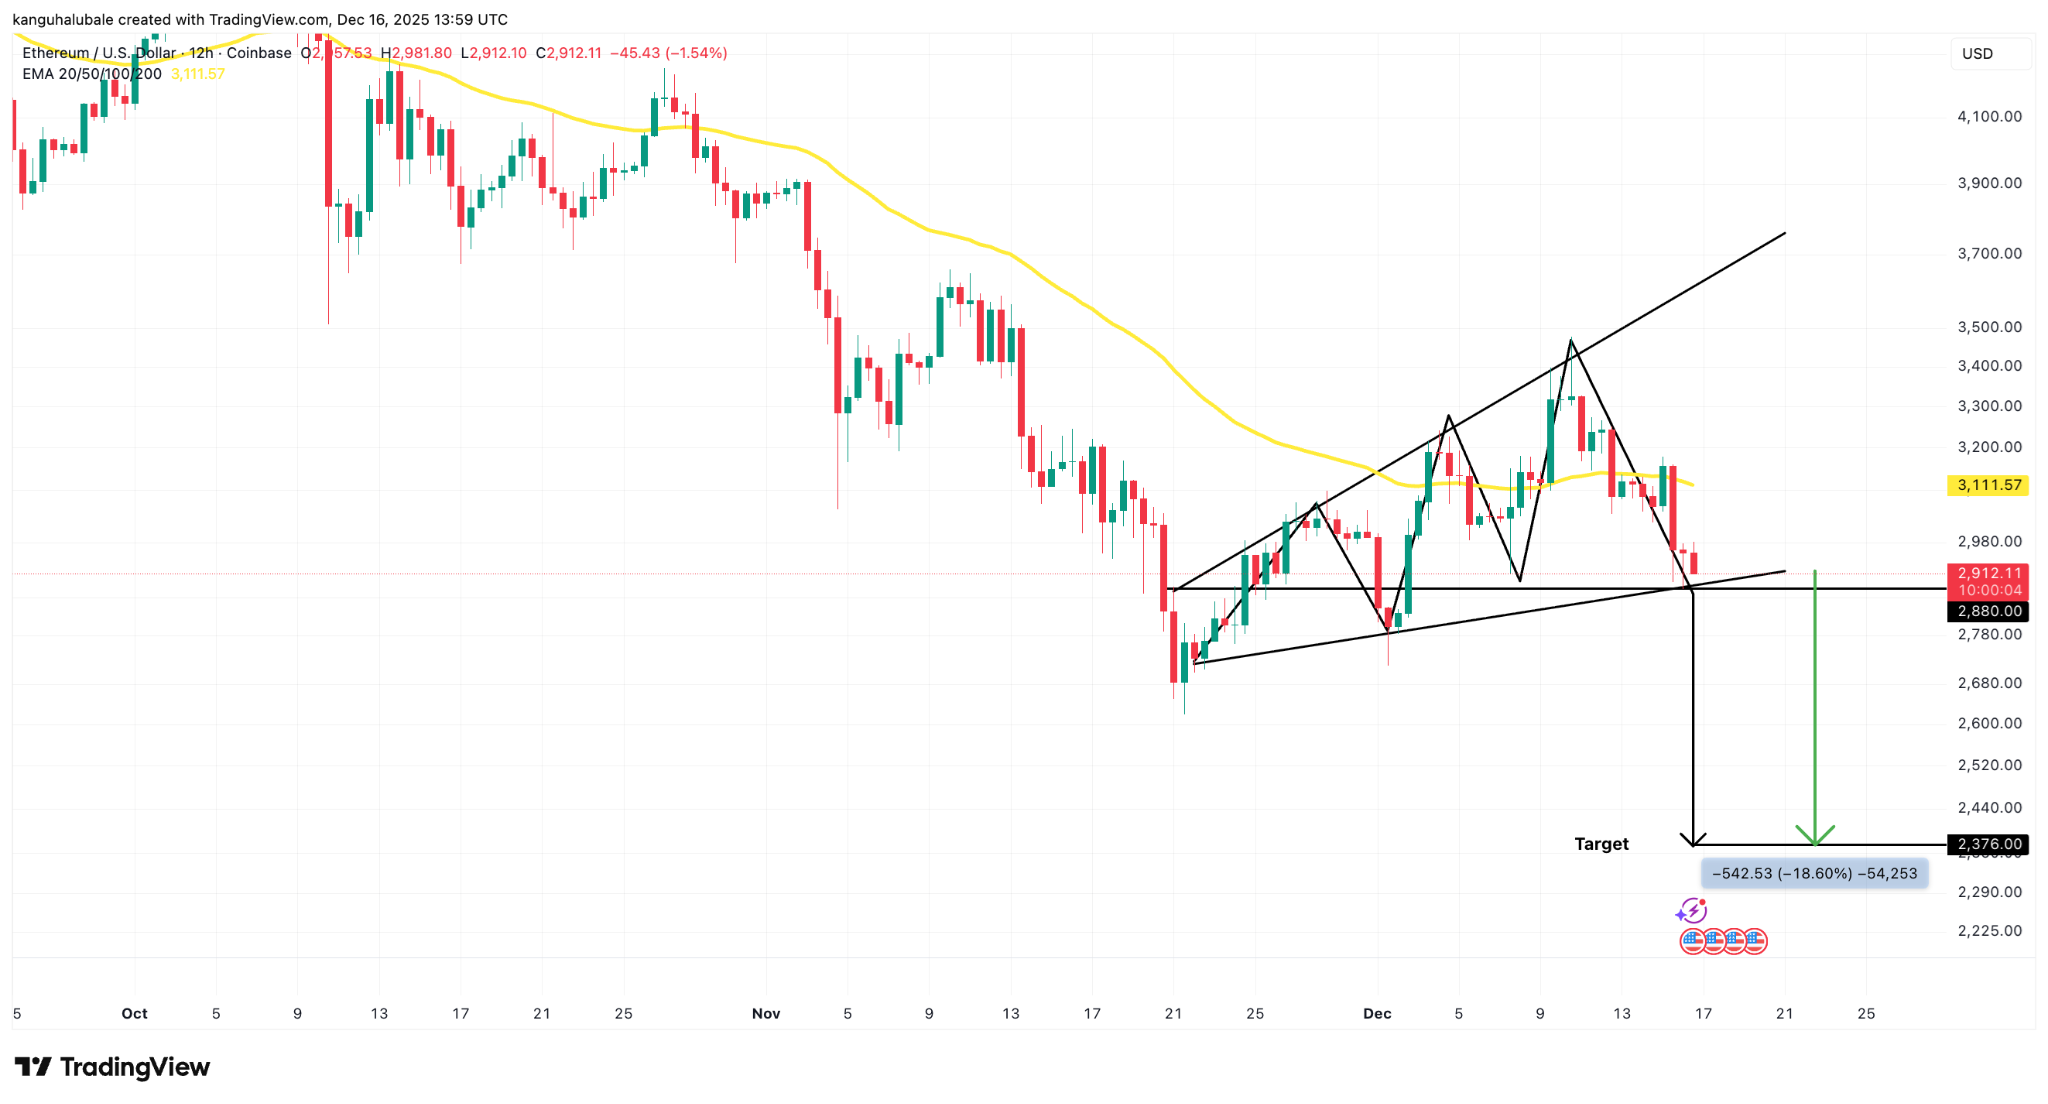
Zooming into the 12-hour time frame, a break and a close below the lower trendline of a megaphone pattern at $2,800 would open the way for a deeper correction toward the measured target of the pattern at $2,376.
Such a move would represent an 18% drop from the current price.
If this support fails and the bears manage to pull the price below $2,800, ETH price could descend to the next $2,716 to $2,623 support zone.
This article does not contain investment advice or recommendations. Every investment and trading move involves risk, and readers should conduct their own research when making a decision. While we strive to provide accurate and timely information, Cointelegraph does not guarantee the accuracy, completeness, or reliability of any information in this article. This article may contain forward-looking statements that are subject to risks and uncertainties. Cointelegraph will not be liable for any loss or damage arising from your reliance on this information.