Violent Attacks On Crypto Holders Escalate Worldwide, Data Shows

bitcoinistPublished on 2026-01-06Last updated on 2026-01-06

Abstract

Data shows a significant escalation in violent "wrench attacks" – physical robberies and kidnappings targeting cryptocurrency holders to force asset transfers – both in frequency and severity worldwide. Security researcher Haseeb Qureshi analyzed an incident database maintained by Jameson Lopp, finding 269 categorized attacks, with over half classified as "Serious" and 5% as "Fatal." The data indicates attacks are becoming more violent over time, with 2025 showing the highest incident count. Approximately 45% of the variation in attacks is explained by crypto market capitalization, meaning higher prices correlate with more incidents. However, when normalized per user (using Coinbase active users as a proxy), attack rates spiked in earlier market cycles, fell after 2019, and have recently risen again toward 2021 levels. Geographically, Western Europe and North America have the most incidents, but Latin America and Africa have significantly higher fatality rates. Notably, zero fatal attacks have occurred in North America. Researchers warn these events are transitioning from rare occurrences to a recurring risk for crypto participants.

Violent “wrench attacks” against crypto holders, physical robberies and kidnappings meant to force victims to hand over coins, appear to be rising in absolute terms and trending more severe, according to a new visualization built from a long-running incident database maintained by security researcher Jameson Lopp.

Dragonfly partner Haseeb Qureshi said he analyzed Lopp’s dataset and built an interactive dashboard to stress-test a question many traders and builders have been asking quietly for years: is simply holding crypto becoming physically more dangerous? “You’re not imagining it: the number of attacks has been increasing over time,” Qureshi wrote on X. “Not only that, the attacks are getting more violent.”
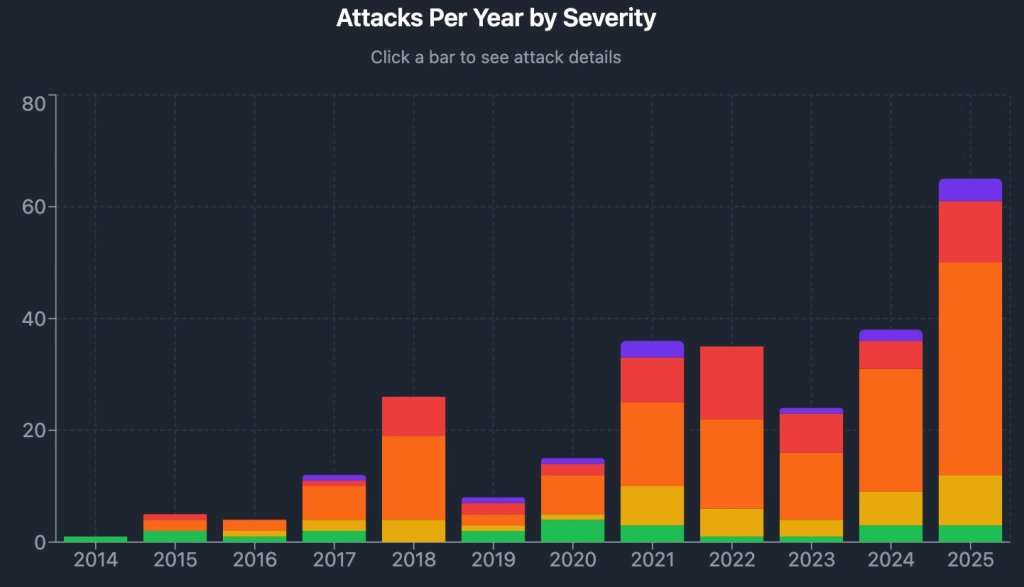
Attacks per year by severity | Source: X @hosseeb

The dashboard breaks reported incidents into five severity bands — Minor, Moderate, Serious, Severe, and Fatal and the distribution skews heavily toward the sharp end of the spectrum. Of 269 categorized incidents shown, 137 (51%) were labeled “Serious,” 57 (21%) “Severe,” and 13 (5%) “Fatal,” with the remainder split between 39 (14%) “Moderate” and 23 (9%) “Minor.”

The year-by-year bars show the later years carrying a larger share of “Severe” and “Fatal” outcomes than the early history of the dataset, with 2025 appearing as the highest-incident year on the chart.
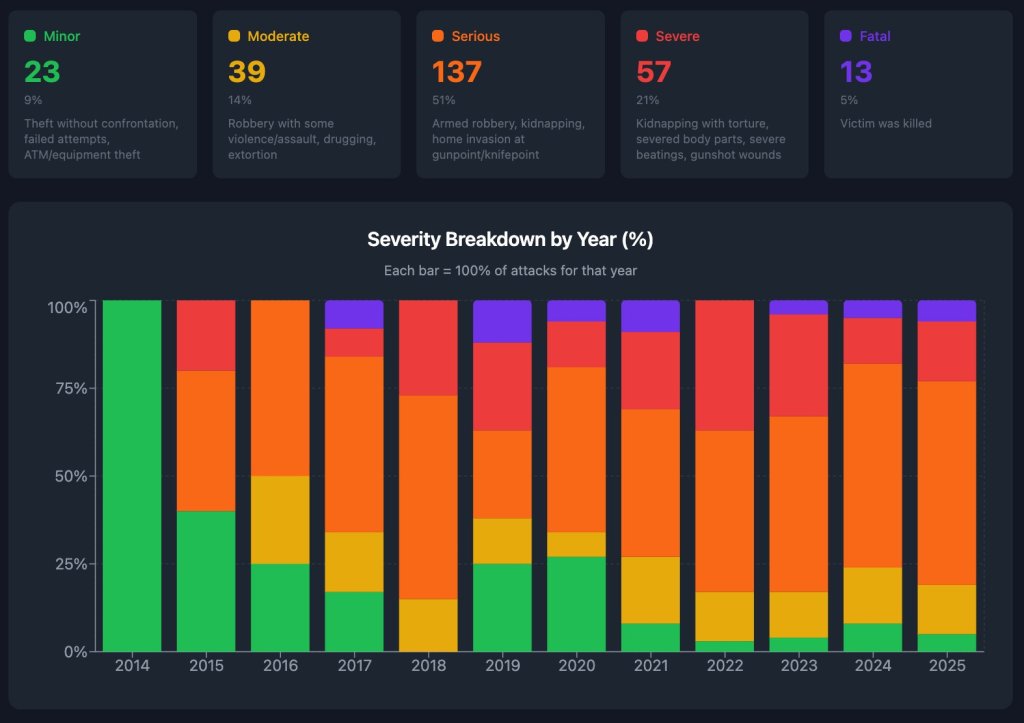
Severity breakdown by year | Source: X @hosseeb

Qureshi’s analysis also puts a number on the most intuitive driver: price. Charting incidents against total crypto market capitalization, he reported a simple regression with an R2 of 0.45 — implying roughly 45% of the variation in reported violence is explained by market cap alone. In plain terms, higher prices coincide with more attacks.

But the more consequential question for everyday holders is not raw counts; it’s risk per person. Because comprehensive “number of crypto users” data is hard to pin down, Qureshi used Coinbase monthly active users as a proxy, and separately normalized incidents by market cap to approximate attacks per dollar of wealth.

The resulting “normalized attack rates” chart tells a less linear story: per-user attack rates spiked in earlier market eras (notably around 2015 and again in 2018), then fell sharply after 2019, before ticking higher in the most recent observations. “So is that it?” Qureshi asked. “Proof crypto is becoming more physically dangerous?”
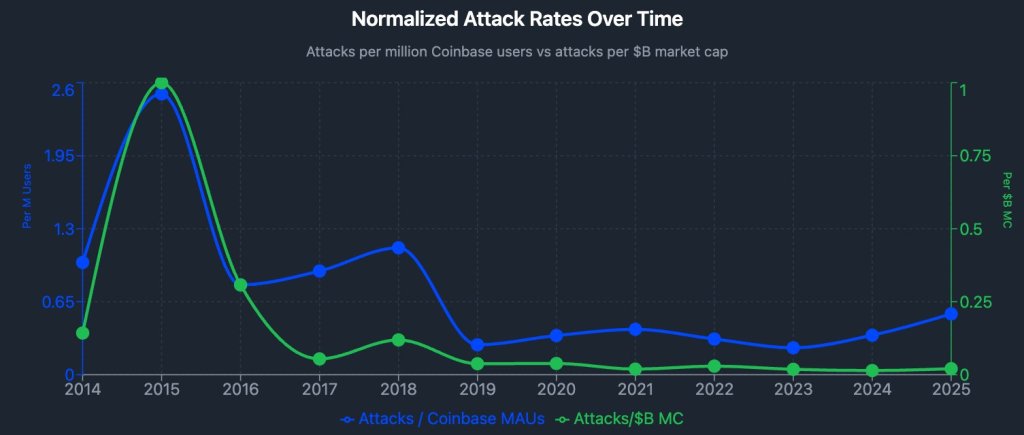
Normalized attack rate over time | Source: X @hosseeb

On his telling, not quite. Coinbase MAUs, he noted, expanded dramatically over the decade, while normalized attack rates did not rise proportionally, suggesting a meaningful “population effect” behind the higher headline totals. Still, the per-user line has moved up from its post-2019 lows, roughly back toward the levels seen during the 2021 cycle, even as the “attacks per $ of market cap” line remains comparatively flat in recent years.

Geography adds another uncomfortable layer. A regional table in the dashboard shows Western Europe (73 attacks) and North America (64) as the two largest buckets by incident count, with Asia-Pacific also substantial (53). But the most lethal outcomes cluster elsewhere: Latin America shows a 21% fatality rate and Africa 17%, versus 0% in North America. Qureshi underscored that point directly: “Notably, there have been 0 fatalities in North America ever,” he wrote, adding that the “lion’s share” of fatalities are in Latin America and Africa.
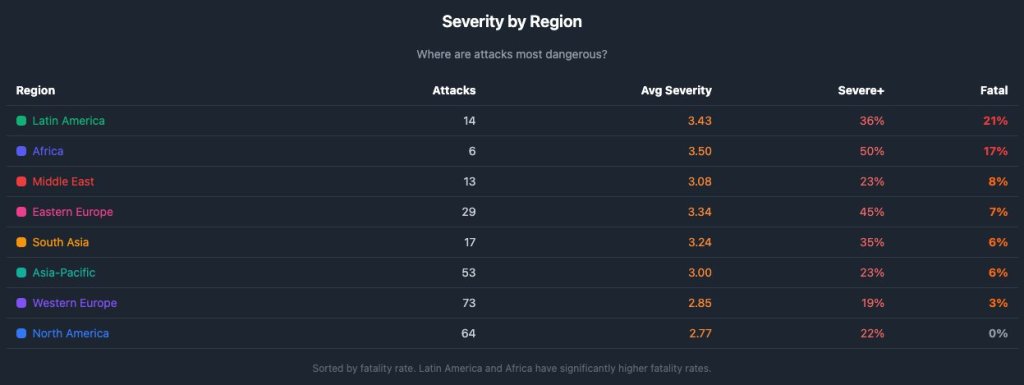
Severity by region | Source: X @hosseeb

Lopp, who has maintained the underlying “Bitcoin Wrench Attack” archive for years, has warned the workload and frequency are becoming harder to treat as isolated incidents. “When an event goes from being rare to happening every few days, it’s no longer newsworthy — it’s just a fact of life,” he wrote in a Dec. 21 post cited in the thread, while inviting others to help maintain the database.

At press time, the total crypto market cap stood at $3.12 trillion.
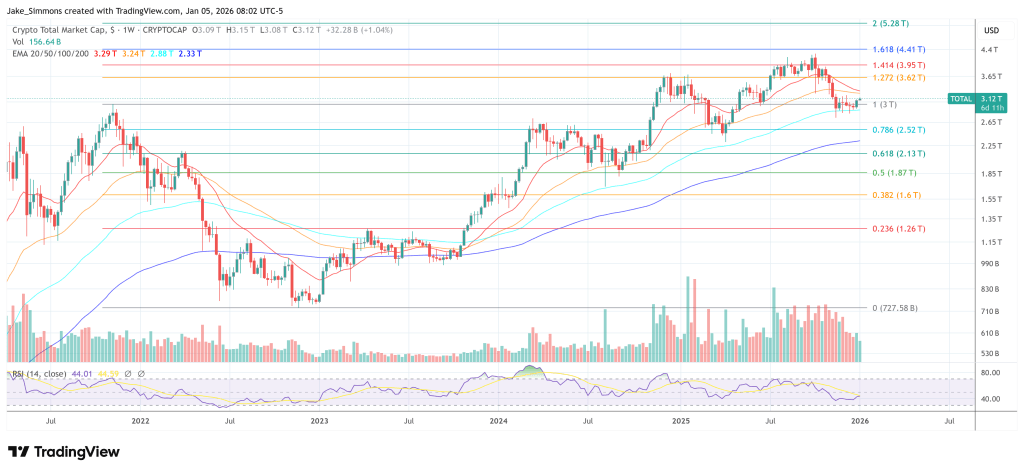
Total crypto market cap recovers above the 2021 high, 1-week chart | Source: TOTAL on TradingView.com

Related Questions

QAccording to the analysis, what is the relationship between crypto market capitalization and violent attacks?

AThe analysis shows a correlation between higher crypto prices and increased attacks, with a regression R2 of 0.45 indicating that approximately 45% of the variation in reported violence is explained by market cap alone.

QWhich regions have the highest fatality rates in crypto-related attacks, according to the data?

ALatin America has a 21% fatality rate and Africa has a 17% fatality rate in crypto-related attacks, while North America has recorded 0% fatalities.

QWhat does the normalized attack rate analysis reveal about per-user risk over time?

AThe normalized attack rate shows that risk per user spiked in earlier market eras (2015 and 2018), fell sharply after 2019, but has recently ticked higher toward 2021 levels, though it didn't rise proportionally to the dramatic expansion of crypto users.

QHow are the severity of attacks distributed across the 269 incidents analyzed?

AThe severity distribution is heavily skewed toward serious outcomes: 51% were 'Serious', 21% 'Severe', 5% 'Fatal', 14% 'Moderate', and 9% 'Minor'.

QWhat trend does Jameson Lopp observe regarding the frequency of these attacks?

AJameson Lopp notes that attacks have moved from being rare events to happening every few days, making them 'no longer newsworthy' but rather 'a fact of life' in the crypto space.

Related Reads

Breaking: GPT-5.6 Prices Slashed Effective Today

OpenAI has announced significant price cuts for its GPT-5.6 model API, effective immediately. The entry-level **GPT-5.6 Luna** sees the most drastic reduction, with input prices dropping 80% to $0.20 per million tokens and output prices falling to $1.20 per million tokens. The mid-tier **GPT-5.6 Terra** is reduced by 20%, now costing $2.00 (input) and $12.00 (output) per million tokens. The flagship **GPT-5.6 Sol** maintains its original price but introduces a new **Fast mode**, offering speeds up to 2.5 times faster for double the cost. The company attributes these price reductions to efficiency gains achieved through **GPT-5.6 Sol's own involvement in optimizing its production systems**. The model assisted in rewriting GPU kernels and improving speculative decoding, leading to a 20% reduction in end-to-end service costs and over 15% improvement in token generation efficiency. OpenAI emphasizes this process remained human-led. A key focus of the降价 is to lower the barrier for running **AI agent workflows**. By making the capable, tool-calling Luna model significantly cheaper, OpenAI aims to enable more frequent use in cost-sensitive, high-volume tasks like code review and monitoring. This creates a potential feedback loop: model-assisted efficiency gains lead to lower costs, which enables broader agent deployment, which in turn drives further optimization. The new pricing and features will also apply to Codex and ChatGPT Work subscriptions. The changes intensify competition in the large language model market, with OpenAI directly challenging rivals like Anthropic to respond.

marsbit5m ago

Breaking: GPT-5.6 Prices Slashed Effective Today

marsbit5m ago

South Koreans' 'Gambling Nature' is Actually Forced by Life

This article explores how systemic pressures in South Korea, rather than inherent "gambling" tendencies, drive widespread speculative financial behavior. It begins by noting the high frequency of flights from South Korea to Macau, symbolizing the search for outlets beyond domestic restrictions. The core argument is that ordinary life goals—stable employment, home ownership, and financial security—have become increasingly tied to asset markets due to structural economic factors. South Korea's development model, historically reliant on corporate leverage (chaebols), has evolved into a society where household debt and personal leverage are normalized as pathways to social mobility. Key mechanisms discussed include: * **Housing Policy:** Government measures to improve affordability, like extending mortgage terms to 50 years and the unique *jeonse* (key money) rental system, embed high leverage into the housing market. * **Financial Products:** The recent approval and explosive popularity of single-stock 2x leveraged ETFs (e.g., on Samsung and SK Hynix), easily accessed via mobile apps, lowered barriers to high-risk trading. * **Social Pressure:** Media narratives around soaring corporate profits (e.g., SK Hynix) and employee bonuses create a fear of missing out, pushing individuals to use leverage to "catch up." The article concludes that this "leveraged life" is a product of institutional history and policy choices. When traditional paths to success feel constrained, and policy facilitates debt-based solutions for housing and investment, speculative behavior becomes a rational, if risky, strategy for many. The rapid cycle of regulatory approval for leveraged ETFs followed by a market crash and official apology in mid-2026 exemplifies the system's inherent contradictions. Ultimately, the "bet" is not just on assets, but on using future earnings to secure a place in the present society.

marsbit5m ago

South Koreans' 'Gambling Nature' is Actually Forced by Life

marsbit5m ago

Trading

Spot
活动图片