"Uninvestable" U.S. Treasuries Might Be the Highest-Returning Asset of 2026

marsbitPublished on 2026-01-20Last updated on 2026-01-20

Abstract

Amidst a shifting macroeconomic landscape in 2026, long-term U.S. Treasuries, particularly ETFs like TLT and TMF, are positioned to outperform equities. Key arguments include: gold's 200% rise signaling deflationary risks rather than sustained inflation; unsustainable U.S. interest expenses nearing $1.2 trillion annually; heavy short-term Treasury issuance increasing refinancing risks; and extreme short interest in long bonds creating potential for a squeeze. Additionally, cooling inflation, weak consumer sentiment, and rising trade tensions suggest a deflationary shock. Policy interventions, such as yield curve control or QE, are likely if long yields threaten growth or fiscal stability. With long-duration assets offering convexity and a 4.4–4.7% yield, a 100–200 bps decline in long-term rates could drive 15–45%+ returns, making long bonds a high-upside, asymmetric bet for 2026.

Author: Common Sense Investor (CSI)

Compiled by: Deep Tide TechFlow

Deep Tide Guide: With the dramatic changes in the macro environment in 2026, market logic is undergoing a profound shift. Veteran macro trader Common Sense Investor (CSI) presents a contrarian view: 2026 will be the year bonds outperform stocks.

Based on the U.S. government's heavy interest payment pressure, the deflationary signals released by gold, extremely crowded bond short positions, and imminent trade conflicts, the author believes that long-duration U.S. Treasuries (such as TLT) are at an inflection point with an "asymmetric game" advantage.

At a time when the market generally considers bonds "uninvestable," this article, through rigorous macro-mathematical deduction, reveals why long bonds could become the highest-returning asset of 2026.

Full article below:

Why I'm Overweight TLT and TMF — And Why Stocks Will Underperform in 2026

I do not write these words lightly: 2026 is destined to be the year bonds outperform stocks. This is not because bonds are "safe," but because macro mathematics, positioning, and policy constraints are converging in an unprecedented way—and this situation rarely ends with "Higher for Longer."

I have put my money where my mouth is.

TLT (20+ Year Treasury ETF) and TMF (3x Leveraged 20+ Year Treasury ETF) currently make up about 60% of my investment portfolio. This article compiles data from my recent posts, adds new macro context, and outlines a bullish upside scenario for long-duration bonds, particularly TLT.

Core Arguments at a Glance:

  • Gold's Movement: Gold's historical performance does not预示持续通胀—it预示通缩/deflation risk.
  • Fiscal Deficit: U.S. fiscal math is breaking down: ~$1.2 trillion in annual interest支出, and rising.
  • Issuance Structure: Treasury issuance is skewed short-term, quietly increasing systemic refinancing risk.
  • Short Squeeze: Long bonds are one of the most crowded short positions in the market.
  • Economic Indicators: Inflation data is cooling, sentiment is weak, labor market pressures are rising.
  • Geopolitics: Geopolitical and trade headlines are turning "Risk-off," not "Reflationary."
  • Policy Intervention: Policy always turns towards lowering long-end rates when something cracks.

This combination has historically been rocket fuel for TLT.

Gold Is Not Always an Inflation Alarm

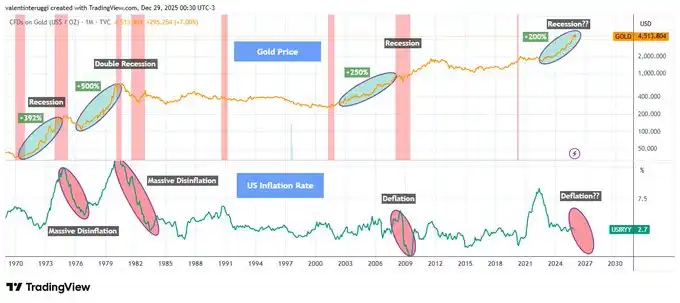
Whenever gold rallies over 200% in a short period, it signals not runaway inflation, but economic stress, recession, and falling real rates (see Chart 1 below).

Historical experience shows:

  • The 1970s gold surge was followed by recession + disinflation.
  • The early 1980s surge was followed by a double-dip recession; inflation was broken.
  • The early 2000s gold rise预示了 the 2001 recession.
  • The 2008 breakout was followed by a deflationary shock.

Since 2020, gold has again risen about 200%. This pattern has never ended in lasting inflation.

When growth flips, gold acts more like a safe-haven asset.
U.S. Interest支出 Is Compounding Explosively

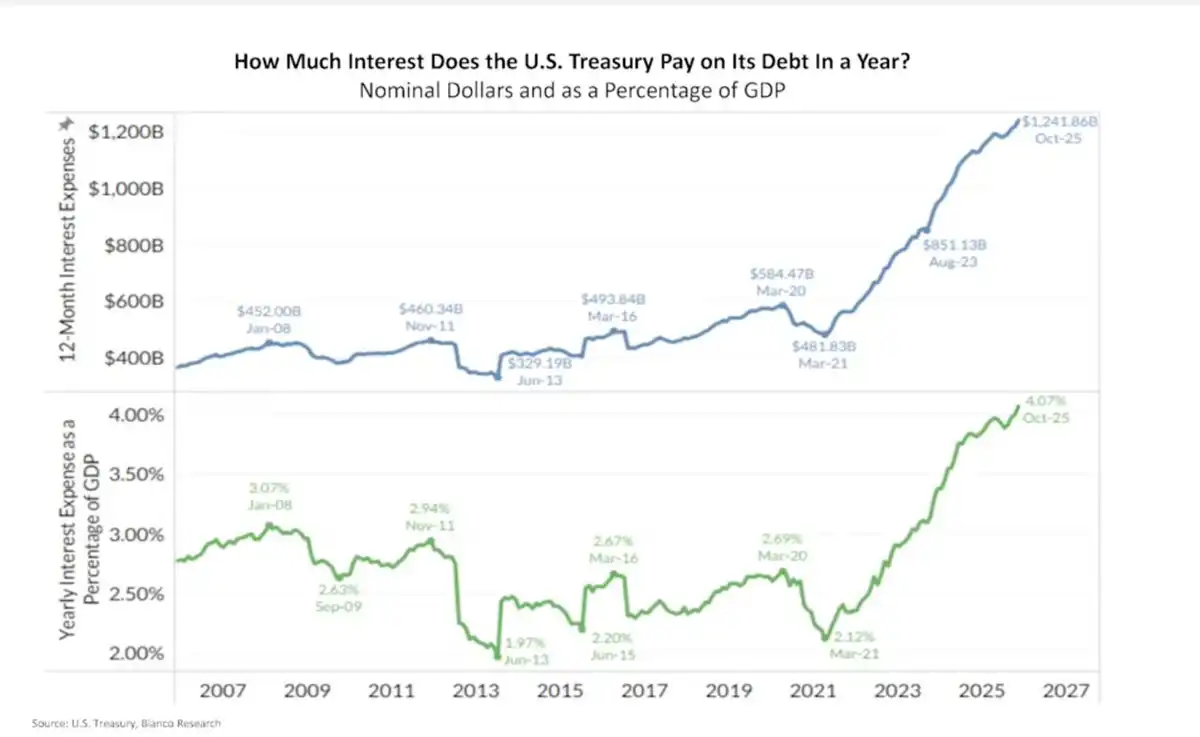
The U.S. currently has annual interest支出 of about $1.2 trillion, roughly 4% of GDP (see Chart 2 below).

This is no longer a theoretical issue. This is real money flowing out—interest compounds rapidly when long-term yields stay high.
This is so-called 「Fiscal Dominance」:

  • High rates mean higher deficits
  • Higher deficits mean more debt issuance
  • More issuance leads to higher Term Premium
  • Higher Term Premium leads to higher interest支出!

This doom loop won't resolve itself with "Higher for Longer." It must be resolved through policy intervention!

Treasury's Short-Term Trap

To alleviate immediate pain, the Treasury has drastically cut long-bond issuance:

  • 20/30-year bonds now make up only ~1.7% of total issuance (see Chart 3 below).
  • The rest has been pushed into short-term Bills.
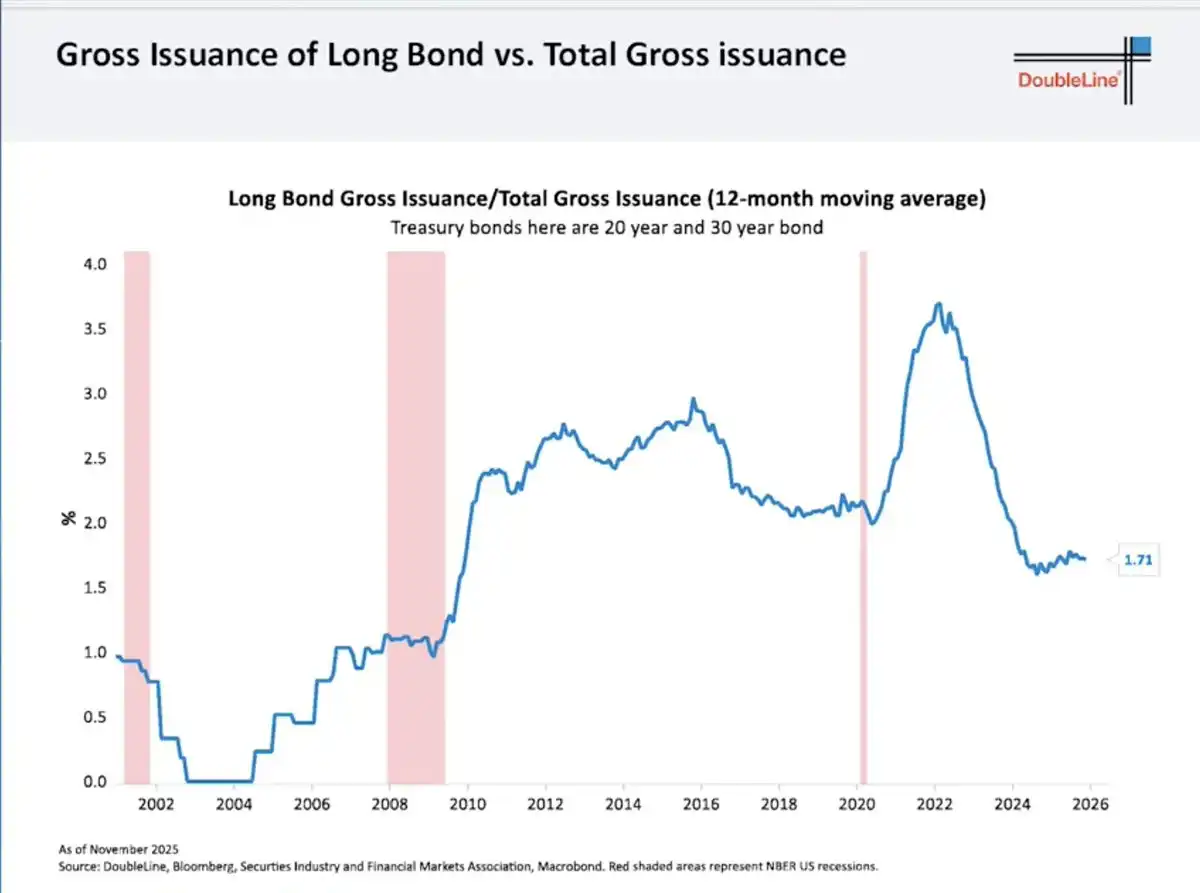
This doesn't solve the problem—it just kicks it down the road:

  • Short-term debt constantly rolls over.
  • Refinancing will happen at future rates.
  • The market sees the risk and demands a higher Term Premium.

Ironically, this is why long-end yields stay high... and why they will collapse violently if growth cracks.

The Fed's Trump Card: Yield Curve Control

The Fed controls the short end, not the long end. When long-end yields:

  1. Threaten economic growth
  2. Trigger explosive fiscal costs
  3. Disrupt asset markets

...the Fed has historically only done two things:

  1. Buy long bonds (QE)
  2. Cap yields (Yield Curve Control)

They won't act preemptively. They only act after stress appears.

Historical references:

  • 2008–2014: 30-year yield fell from ~4.5% to ~2.2% → TLT surged +70%
  • 2020: 30-year yield fell from ~2.4% to ~1.2% → TLT surged +40% in under 12 months

This isn't just theory—this has happened!

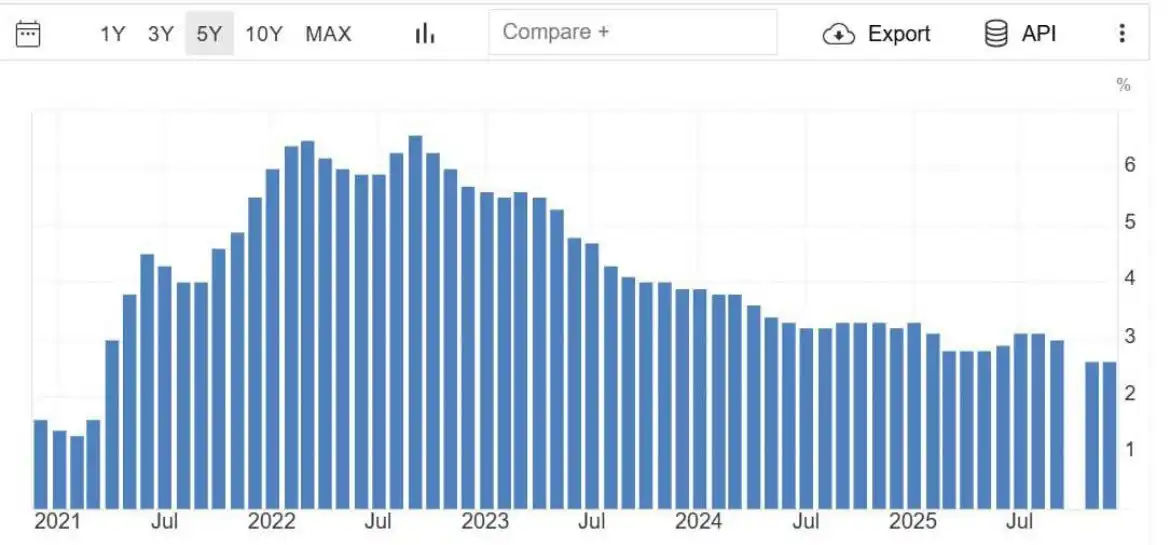
Inflation Is Cooling, Economic Cracks Appearing

Recent data shows core inflation falling back to 2021 levels (see Chart 4).

  • CPI momentum is fading.
  • Consumer confidence is at a decade low.
  • Credit pressures are building.
  • The labor market is starting to crack.
Markets are forward-looking. The bond market is already starting to smell this.

Extremely Crowded Short Position

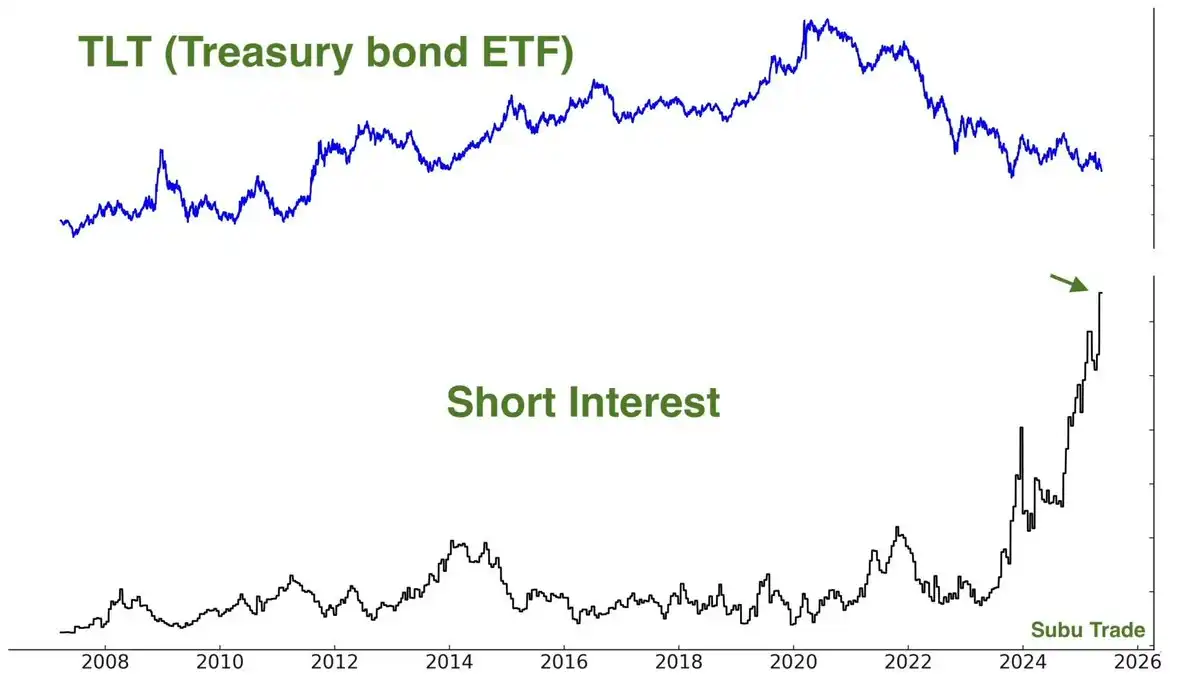
TLT short interest is extremely high:

  • ~144 million shares sold short.
  • Days to cover exceeds 4 days.

Crowded trades don't unwind slowly. They reverse violently—especially when the market narrative shifts.

And importantly:

"Shorts pile in AFTER the move, not before."

This is classic late-cycle behavior!

Smart Money Is Moving In

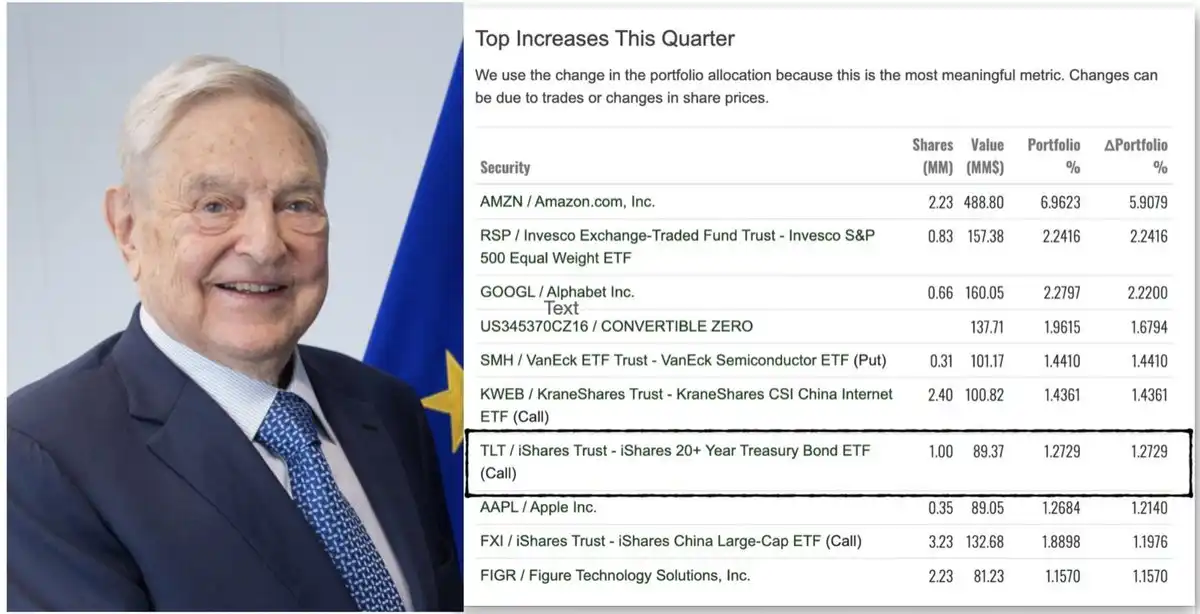
Recent widely circulated 13F institutional holding reports showed a large fund's quarterly increase list featured significant TLT call options.

Whoever it's attributed to, the message is simple: Sophisticated capital is starting to reposition for duration. Even George Soros's fund held TLT call options in its latest 13F disclosure.
Deflationary Shock from Tariff Friction

Recent news is reinforcing the "risk-off" logic. President Trump announced new tariff threats regarding the Denmark/Greenland dispute, and European officials are now openly discussing freezing or suspending participation in the EU-US tariff agreement in response.

Trade friction will:

  • Hit growth
  • Squeeze margins
  • Reduce demand
  • Push capital into bonds over stocks

This is not an inflationary impulse; it's a deflationary shock.

Valuation Mismatch: Stocks vs. Bonds

Today's stock pricing reflects:

  • Strong growth
  • Stable margins
  • Benign financing conditions

While bond pricing reflects:

  • Fiscal stress
  • Sticky inflation worries
  • Permanently high yields

If either of these narratives is wrong, returns will diverge violently.

Long-duration bonds have "convexity"; stocks do not.

$TLT Upside Case Analysis

TLT has:

  • ~15.5 years effective duration
  • You earn ~4.4–4.7% yield while you wait

Scenario Analysis:

  • If long-end yields fall 100 basis points (bps), TLT price return is +15–18%.
  • Fall 150 bps, TLT return is +25–30%.
  • Fall 200 bps (not extreme historically),意味着 it will surge +35–45% or more!

This doesn't include interest income, convexity bonuses, or the accelerating effect of short covering. This is why I see "asymmetric upside."

Conclusion

Honestly: After the惨状 of 2022, I swore I'd never touch long bonds again. Watching duration assets get crushed was a frustrating experience.

But the market doesn't care about your psychological trauma—it only cares about probabilities and price.

When everyone agrees bonds are "uninvestable," when sentiment bottoms, when shorts pile up, when yields are high and growth risks are rising...

That's when I start buying!

  • TLT + TMF are currently ~60% of my portfolio. I made 75% returns in the 2025 stock market and redeployed most of it into bond ETFs in November 2025.
  • I'm "getting paid to wait" (earning over 4% yield).
  • My position is based on policy and growth shifts, not虚无的 narrative.

2026 will finally be the "Year of the Bond."

Related Questions

QAccording to the article, why does the author believe long-duration U.S. Treasuries (like TLT) could be the highest-returning asset in 2026?

AThe author believes a combination of factors creates an 'asymmetric bet' for long bonds: unsustainable U.S. interest expenses, gold price signaling deflationary risks, extremely crowded short positions in bonds, cooling inflation, emerging economic weaknesses, and the high probability of policy intervention (like QE or Yield Curve Control) to lower long-term rates, which would cause their prices to surge.

QWhat historical pattern does the author cite regarding gold's performance and what it has typically preceded?

AThe author states that historically, whenever gold has risen over 200% in a short period, it has not signaled persistent inflation but instead preceded economic stress, recession, and falling real interest rates (disinflation/deflation). Examples given are the 1970s, early 1980s, 2000s, and 2008.

QWhat is 'Fiscal Dominance' as described in the article, and why is it a problem for the U.S.?

A'Fiscal Dominance' is described as a vicious cycle where high interest rates lead to higher budget deficits, which require more government debt issuance. This increased issuance leads to a higher term premium (the extra yield investors demand for holding long-term bonds), which in turn leads to even higher interest expenses, creating a self-reinforcing loop that is unsustainable.

QHow does the current structure of U.S. Treasury debt issuance create a 'short-term trap'?

AThe Treasury has drastically reduced the issuance of long-term bonds (20/30-year) to about 1.7% of total issuance, pushing most of the borrowing into short-term bills. This doesn't solve the debt problem; it merely kicks it down the road. These short-term bills must be constantly refinanced at future (potentially higher) rates, increasing systemic refinancing risk and keeping long-term yields high due to the market's perceived risk.

QWhat specific market positioning factor does the author highlight as a potential catalyst for a rapid price increase in long-term bond ETFs like TLT?

AThe author highlights the extremely crowded short interest in TLT, with approximately 144 million shares sold short and a high 'days to cover' ratio. This creates the conditions for a violent short squeeze, where a shift in market narrative would force short sellers to buy back shares rapidly, accelerating any upward price move.

Related Reads

Cyclical Stock or Growth Stock? Coinbase's Q2 Earnings Report Reveals 'Valuation Disagreement'

Coinbase's Q2 2026 financial results revealed a mixed performance, reigniting debate over whether the company should be valued as a cyclical stock tied to crypto markets or a growth stock with future potential. Total revenue missed expectations at $1.22 billion, down 19% year-over-year. Transaction revenue fell to $599 million, with retail crypto spot trading revenue dropping 30% to $452 million, back to 2023 levels. The company reported a net loss of $359 million, marking its third consecutive quarterly loss. Despite CEO Brian Armstrong's positive commentary on metrics like a 10.3% overall crypto trading market share and 106% growth in prediction markets, the market reacted negatively, with shares dropping over 5% after-hours. A key issue is the decline in core retail trading. While Coinbase touted record market share, this figure includes derivatives and new products. Its traditional crypto spot trading share is likely shrinking. New ventures like prediction markets, while growing, contributed less than $30 million, insufficient to offset the core revenue decline. The valuation debate hinges on perspective. As a cyclical stock, Coinbase remains deeply tied to the crypto bear market, with user attrition and competitive pressures justifying a lower valuation. The company's strategy appears focused on surviving until the next bull cycle. Viewed as a growth stock, however, Coinbase shows promising diversification. Subscription and service revenue reached $555 million, nearly matching transaction revenue. Stablecoin revenue, its second-largest source at $292 million, remains strong through its partnership with Circle. Critically, Coinbase is positioning itself as a leader in the emerging on-chain "agent economy." Over 90% of agent-based stablecoin transactions occur on its Base network, which it believes could handle trillions in future agent transactions. The recent acquisition of Deribit also aims to boost its international derivatives offering. In summary, Coinbase's present struggles are clear, but its future hinges on whether its investments in revenue diversification, stablecoins, and the agent economy can ultimately transform its business model and justify a growth premium.

Odaily星球日报8m ago

Cyclical Stock or Growth Stock? Coinbase's Q2 Earnings Report Reveals 'Valuation Disagreement'

Odaily星球日报8m ago

Global Market Share Survey: Japanese Firms Lead in Semiconductor Materials

Global Market Share Survey: Japanese Firms Lead in Semiconductor Materials According to the 2025 "Major Goods and Services Market Share Survey" by Nikkei, Japanese companies maintain strong positions in semiconductor-related materials. In silicon wafers, Shin-Etsu Chemical ranks first with a 26.3% share, followed by SUMCO at 17.8%. Together, they hold 44.1% of the market, widening their lead over competitors from Taiwan, Germany, and South Korea. In photoresists, Tokyo Ohka Kogyo, JSR, and Shin-Etsu Chemical occupy the top three spots, with a combined share of 60.5%. Despite their strength in materials, Japanese firms have a weaker presence in core semiconductor segments like DRAM and NAND flash memory, where South Korean and U.S. companies dominate. For instance, SK Hynix and Samsung lead in DRAM, while China’s CXMT doubled its share to 6% in 2025. The semiconductor market is projected to grow rapidly, with WSTS forecasting a 90% increase to $1.5112 trillion by 2026. Major players like Samsung, SK Hynix, and Micron are making massive investments to expand capacity. To maintain their edge in materials, Japanese companies must similarly commit to large-scale, risk-taking investments. In contrast, Japan’s automotive sector shows stagnation. Toyota remains the global leader but with only a slight share increase to 12.3%, while Japanese brands are absent from the top five in the EV market. In shipbuilding, Imabari Shipbuilding rose to third place globally with a 7.2% share, benefiting from large container ship deliveries. However, Chinese and South Korean firms dominate the sector, holding the top two positions. Japan aims to revitalize its shipbuilding industry through government and corporate efforts, targeting a near doubling of output by 2035. Addressing labor shortages and adopting advanced technologies like physical AI will be critical for competitiveness.

marsbit33m ago

Global Market Share Survey: Japanese Firms Lead in Semiconductor Materials

marsbit33m ago

Trading

Spot
活动图片