Tether Q4 2025 Report: USDT Market Cap Nears $190 Billion, Multiple Indicators Hit Record Highs

marsbitPublished on 2026-02-05Last updated on 2026-02-05

Abstract

Tether's Q4 2025 report highlights record-breaking performance for USDT, with its market capitalization reaching $187.3 billion. Despite a market-wide slowdown following a crypto liquidation event on October 10, USDT grew by 3.5% in market cap during the subsequent period, while other major stablecoins declined. Key achievements include an eighth consecutive quarter of over 30 million new users, bringing the total user base to 534.5 million. On-chain wallet holders saw the largest quarterly increase, reaching 139.1 million. Monthly active on-chain users hit a record 24.8 million, and both on-chain transfer volume and value reached all-time highs, with quarterly transfers totaling $4.4 trillion. USDT’s reserve assets grew to $192.9 billion, including increased holdings in U.S. Treasuries, Bitcoin, and gold. Its role extends beyond crypto trading, with strong adoption for savings and transactions. USDT dominates stablecoin usage, accounting for 65.9% of single-asset transfer value and 75% of savings-oriented wallets among all stablecoins.

USDT achieved multiple new highs in the fourth quarter of 2025, as follows:

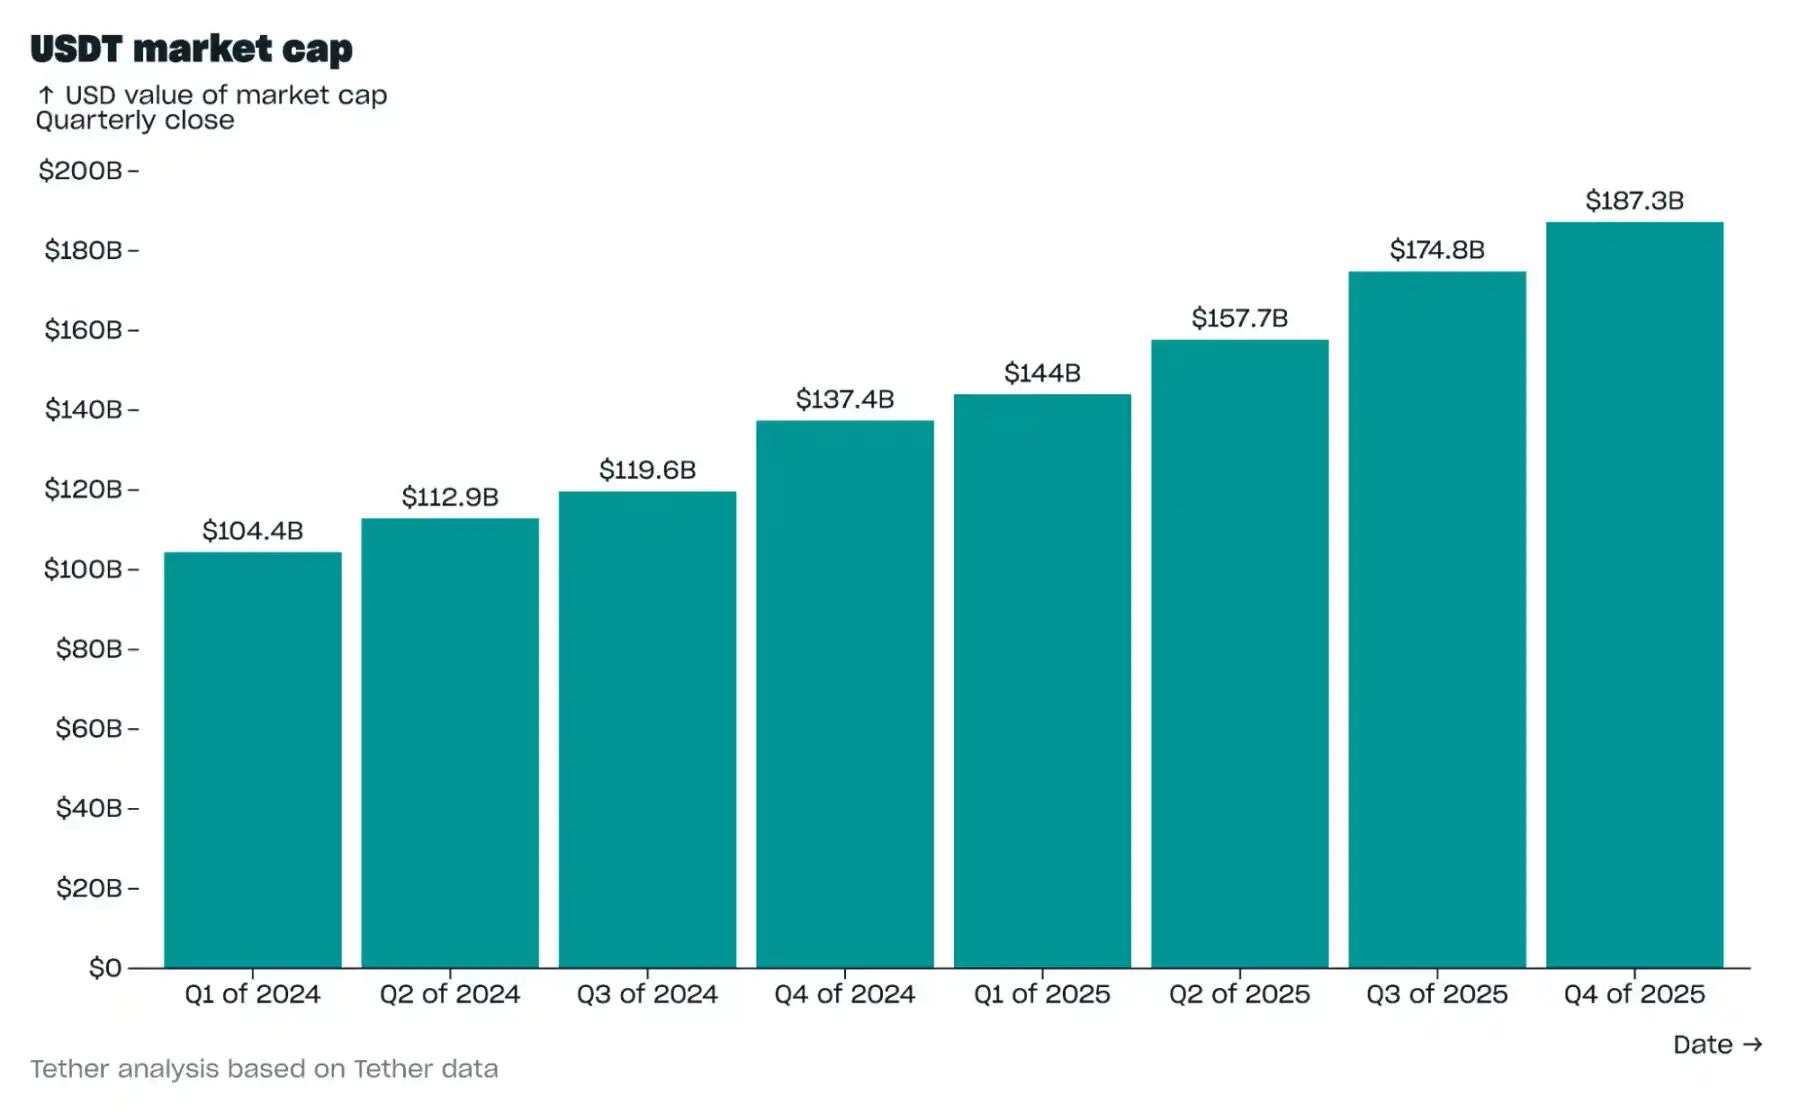
· Market capitalization reached $187.3 billion;

· Achieved over 30 million new users for the eighth consecutive quarter;

· Recorded the largest quarterly increase in the number of on-chain wallets holding USDT;

· Monthly active on-chain users reached an all-time high;

· Both the number and value of on-chain transfers hit record levels.

Meanwhile, a chain reaction of cryptocurrency liquidations that occurred on October 10, 2025, has led to a slowdown in the growth rate of the stablecoin ecosystem. Between October 10, 2025, and February 1, 2026, the total cryptocurrency market capitalization fell by over one-third. During this period, the market cap of USDT grew by 3.5%; in contrast, the market caps of the second and third largest stablecoins fell by 2.6% and 57%, respectively.

The sustained growth of USDT relies not only on the cryptocurrency market but also on various use cases beyond it. Data clearly shows that users prefer USDT as a stablecoin for both storing wealth and conducting transactions.

These conclusions are primarily based on Tether's analysis of blockchain data (also known as on-chain data). On-chain data for 75 stablecoins across 15 blockchains were sourced from Chainalysis and Artemis.

Market Capitalization

In Q4 2025, the USDT market cap grew by $12.4 billion, reaching $187.3 billion. The month-over-month growth rate in October was 4.9%, but its growth pace slowed after the cryptocurrency liquidation wave on October 10.

Reserves

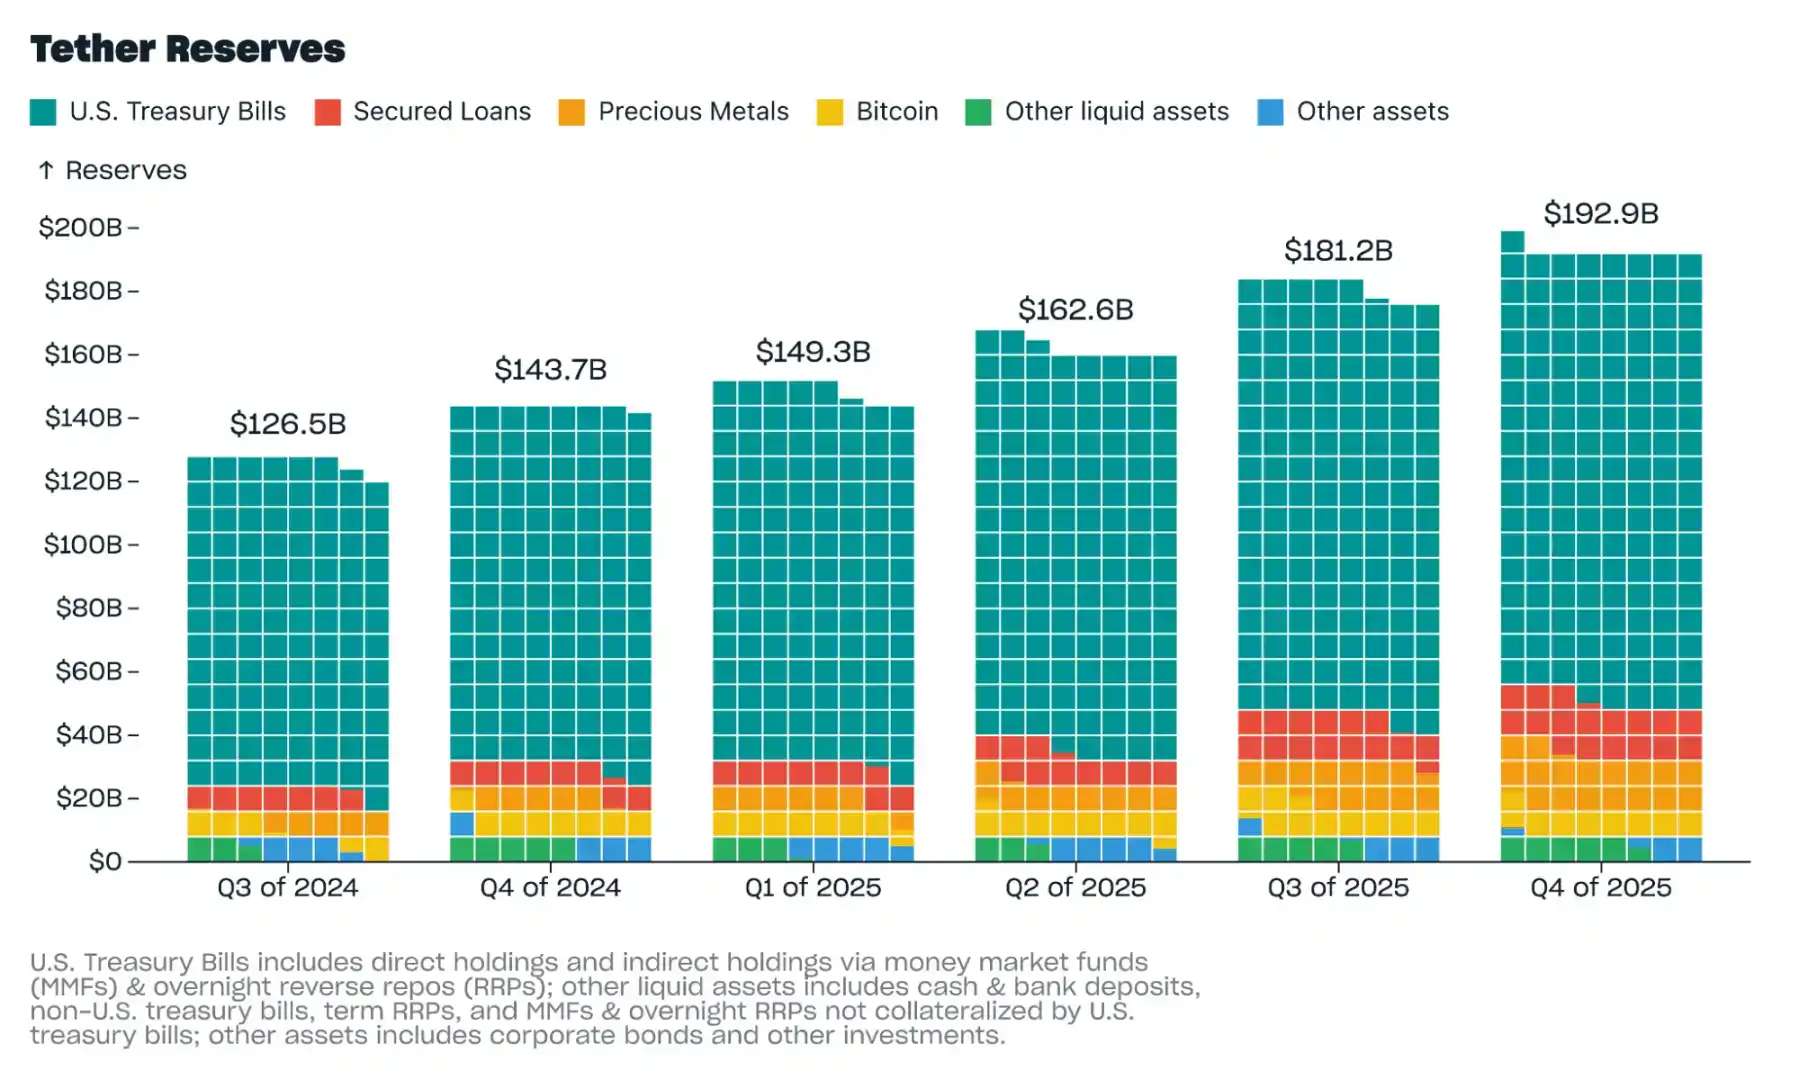
In Q4 2025, Tether's total reserves increased by $11.7 billion, reaching $192.9 billion, with net equity (assets exceeding liabilities) of $6.3 billion. The total reserves include 96,184 Bitcoin (9,850 added in Q4) and 127.5 metric tons of gold (21.9 metric tons added in Q4).

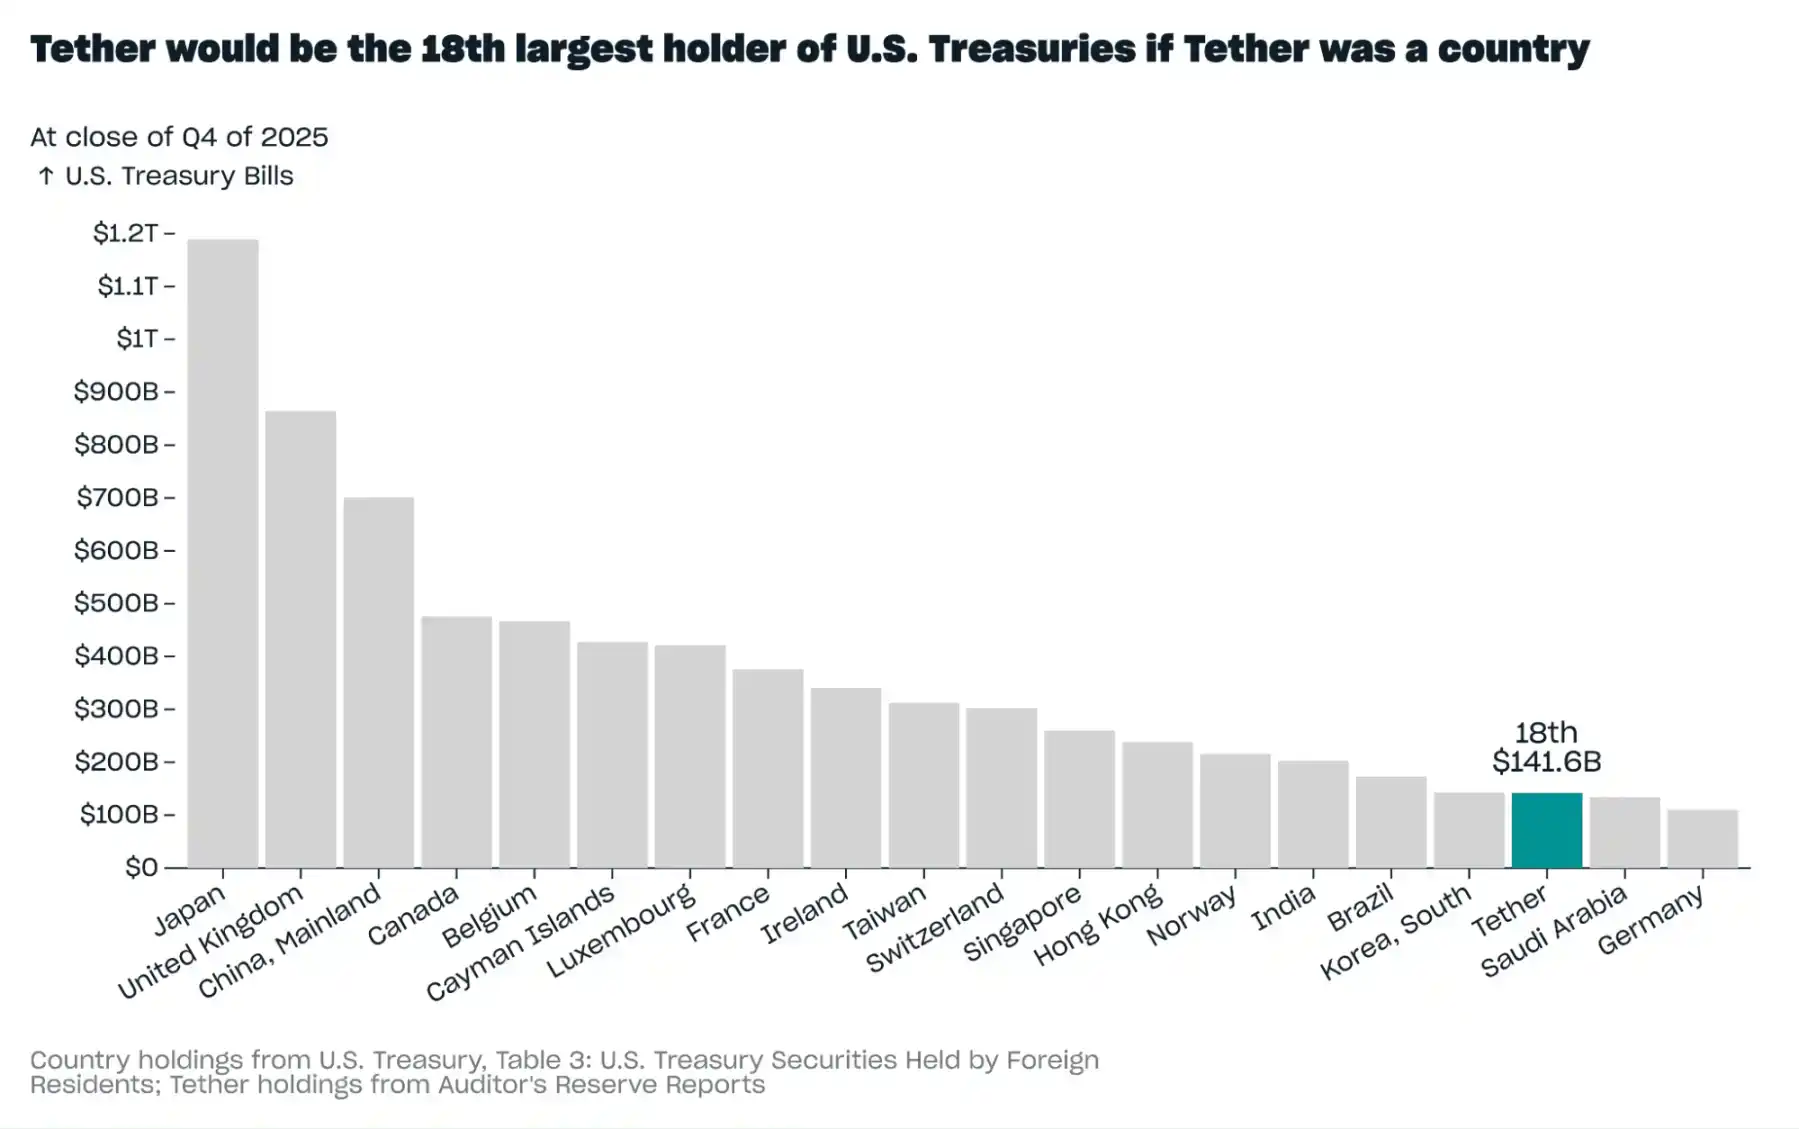
In Q4, Tether's total holdings of U.S. Treasury Bills increased by $6.5 billion, reaching $141.6 billion. If Tether were considered a "country," its holdings of U.S. Treasury Bills would rank 18th globally, surpassing Saudi Arabia and Germany.

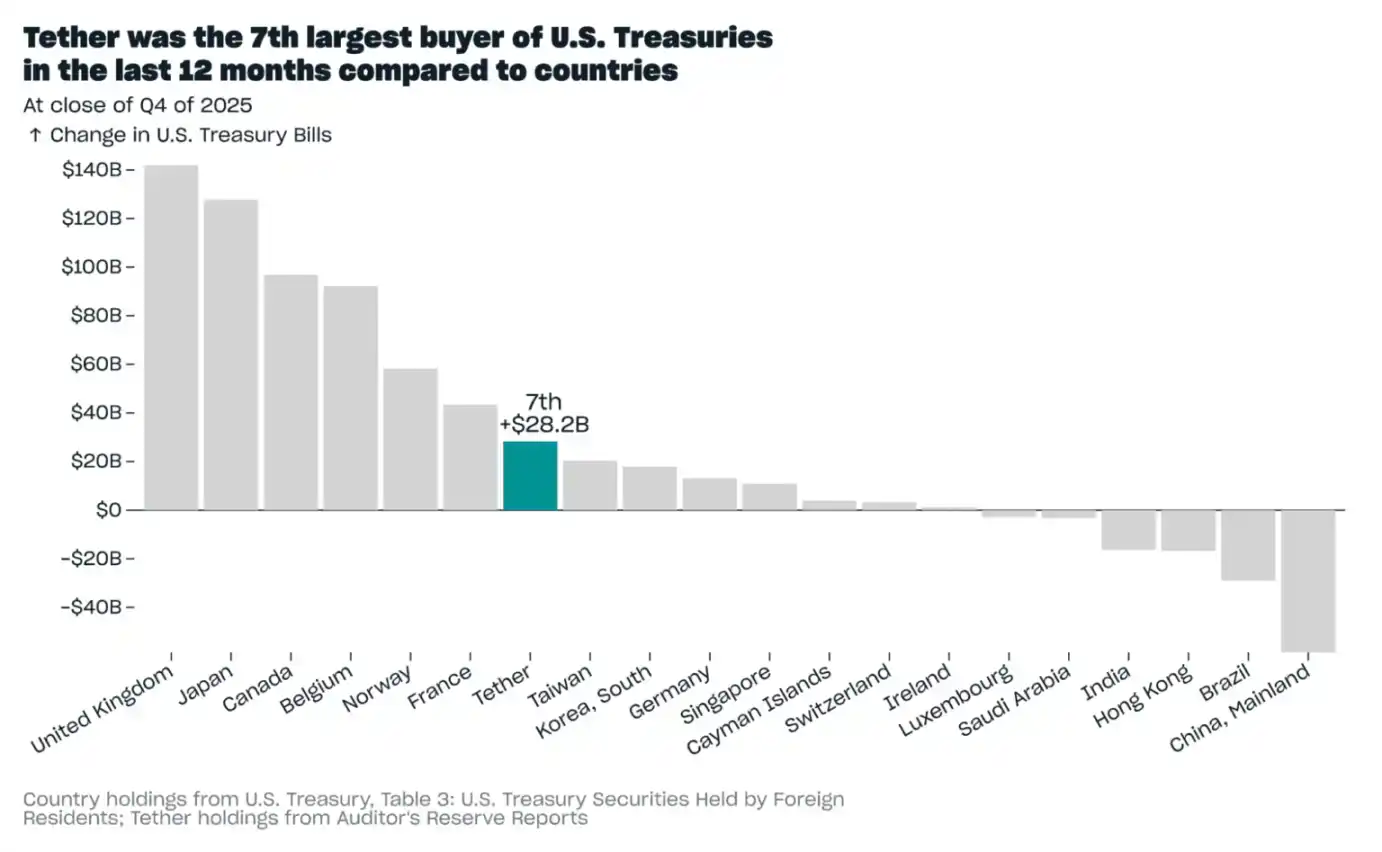
Throughout 2025, Tether accumulated an additional $28.2 billion in U.S. Treasury Bills. Over the past 12 months, compared to the accumulation by countries, Tether became the seventh largest buyer of U.S. Treasury Bills, purchasing more than Taiwan and South Korea.
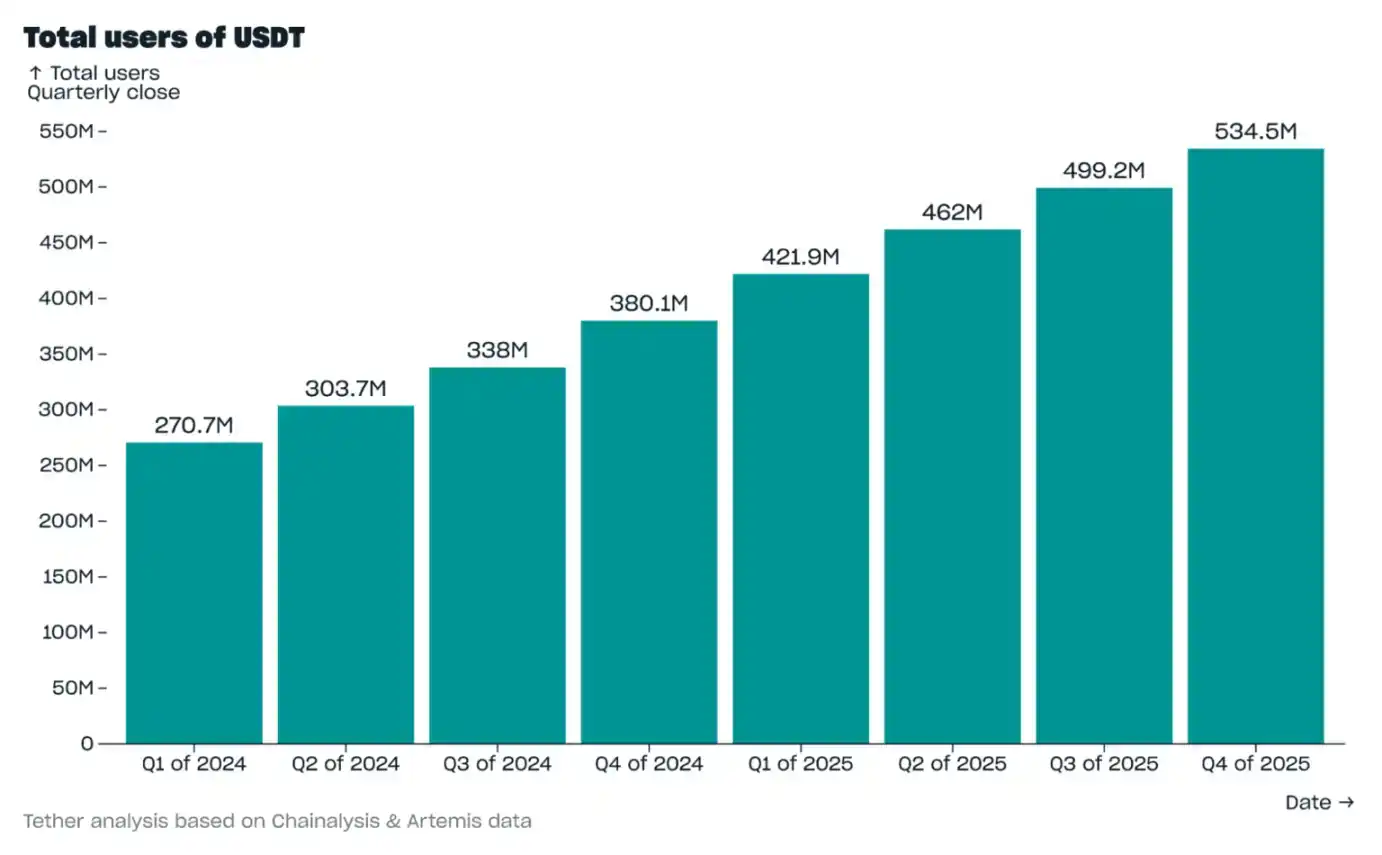
Total Users

In Q4 2025, the estimated total number of USDT users increased by 35.2 million, reaching 534.5 million. This marks the eighth consecutive quarter of growth exceeding 30 million users for this stablecoin. The user count here includes two parts: on-chain wallet users (those who have received USDT and held it for at least 24 hours) and the estimated number of users receiving USDT on centralized service platforms (such as cryptocurrency exchanges).

On-Chain Holders

In Q4 2025, the number of on-chain wallet users holding USDT increased by 14.7 million, reaching a total of 139.1 million, setting a new quarterly growth record. Wallets holding USDT account for 70.7% of all wallets holding any stablecoin. In addition to on-chain wallet users, it is estimated that over 100 million users hold USDT on centralized service platforms like exchanges.

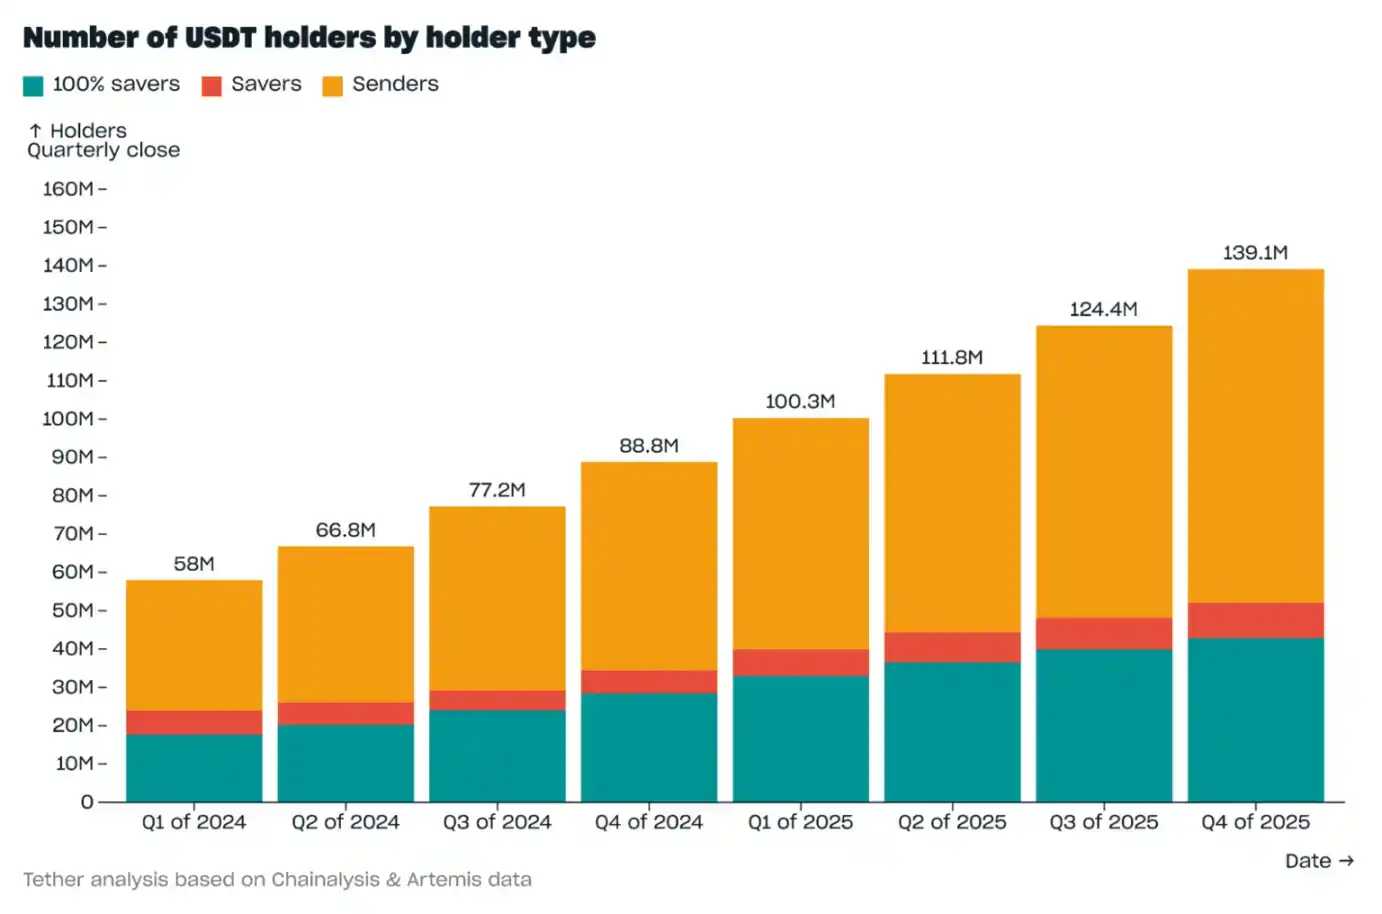
The structure of USDT on-chain holders remained relatively stable, distributed as follows:

· "Pure Savers" (wallet users who retain 100% of received USDT): 30.8%;

· "Savers" (wallet users who retain on average less than 100% but more than 2/3 of received USDT): 6.7%;

· "Transactors" (wallet users who retain on average less than 2/3 of received USDT): 62.6%.

Compared to all other stablecoins, USDT has a higher proportion of "Savers" and "Pure Savers" (37.5% for USDT vs. 30% for other stablecoins collectively). Among all stablecoin savings wallets, 75.1% choose to hold USDT, indicating that USDT remains the preferred stablecoin for wealth storage.

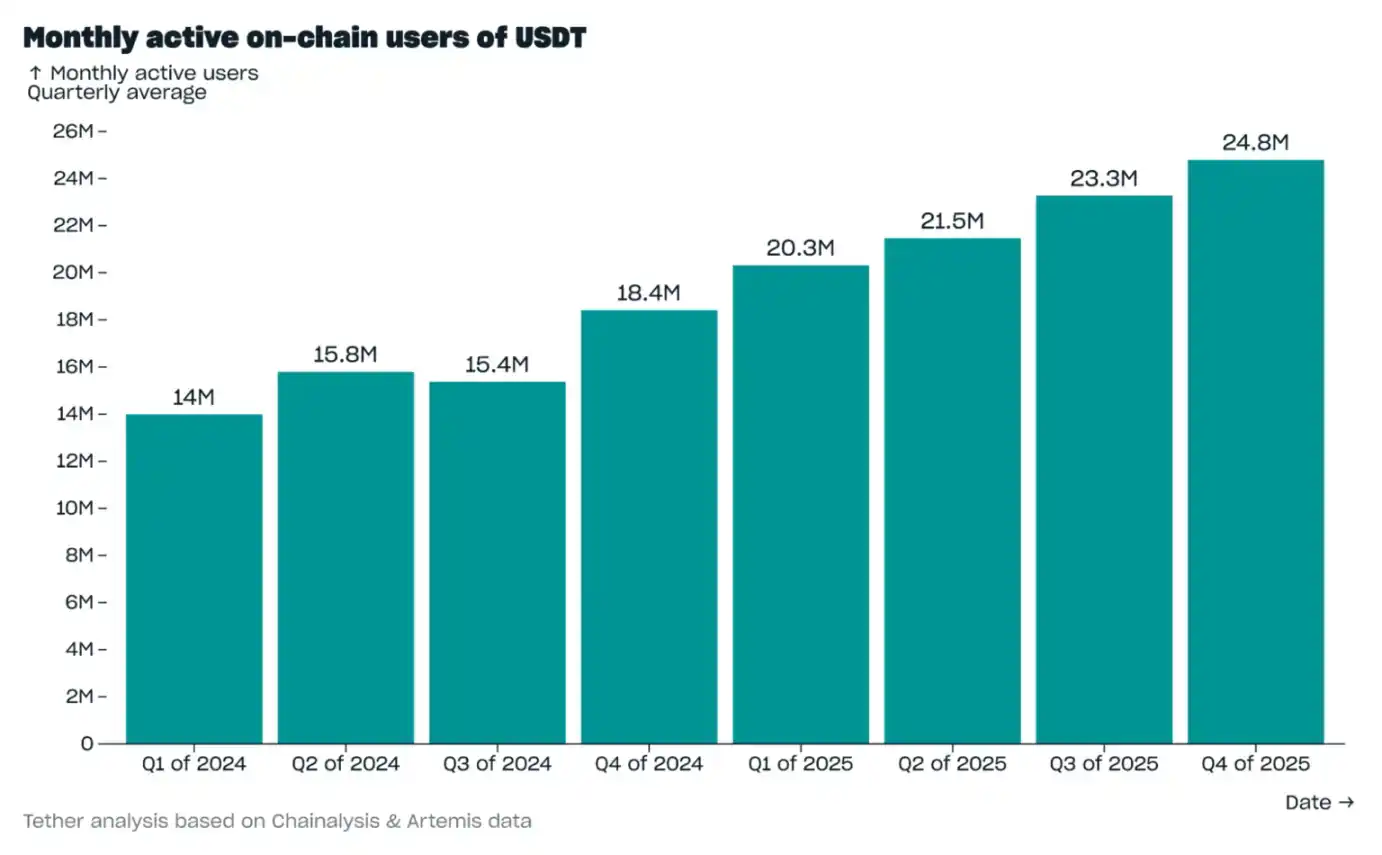
On-Chain Active Users

In Q4 2025, the average number of monthly active on-chain users for USDT (wallet users who received USDT at least once in a 30-day rolling period) reached 24.8 million, an all-time high, indicating continuously improving user activity. This number represents 68.4% of the total monthly active users for all stablecoins.

Holdings Distribution by User Type

As of the end of Q4 2025, 36% of USDT holdings were concentrated on centralized exchanges (CEXs), an increase of 2.8 percentage points from the end of Q3. This change was partly due to a decrease in USDT holdings on decentralized exchanges (DEXs) and decentralized finance (DeFi) platforms following the October 10 cryptocurrency liquidation wave: in Q4, USDT on DEXs and DeFi platforms decreased by $3 billion (a 2 percentage point drop in share) to $7.1 billion, accounting for 3.8% of total USDT holdings.

The second largest share of holdings belongs to Savers, accounting for 33%, with "Pure Savers" holding 17.4% and other "Savers" holding 15.6%. In Q4, Savers' USDT holdings increased by $2.9 billion, reaching a total of $62.1 billion by the end of the quarter. As mentioned earlier, USDT not only attracts the most Savers but also stores the highest USD value: it accounts for 59.9% of the savings value across all stablecoins; if wallets holding over $10 million (which are mostly exchange cold wallets) are excluded, USDT's share rises to 77.3%.

"Transactors" ranked third in holdings share, at 26.5% as of the end of Q4. This share remained relatively stable from Q3 to Q4, and the holdings of "Transactors" increased by $2.2 billion, reflecting USDT's continued growth in liquidity for transactional use cases.

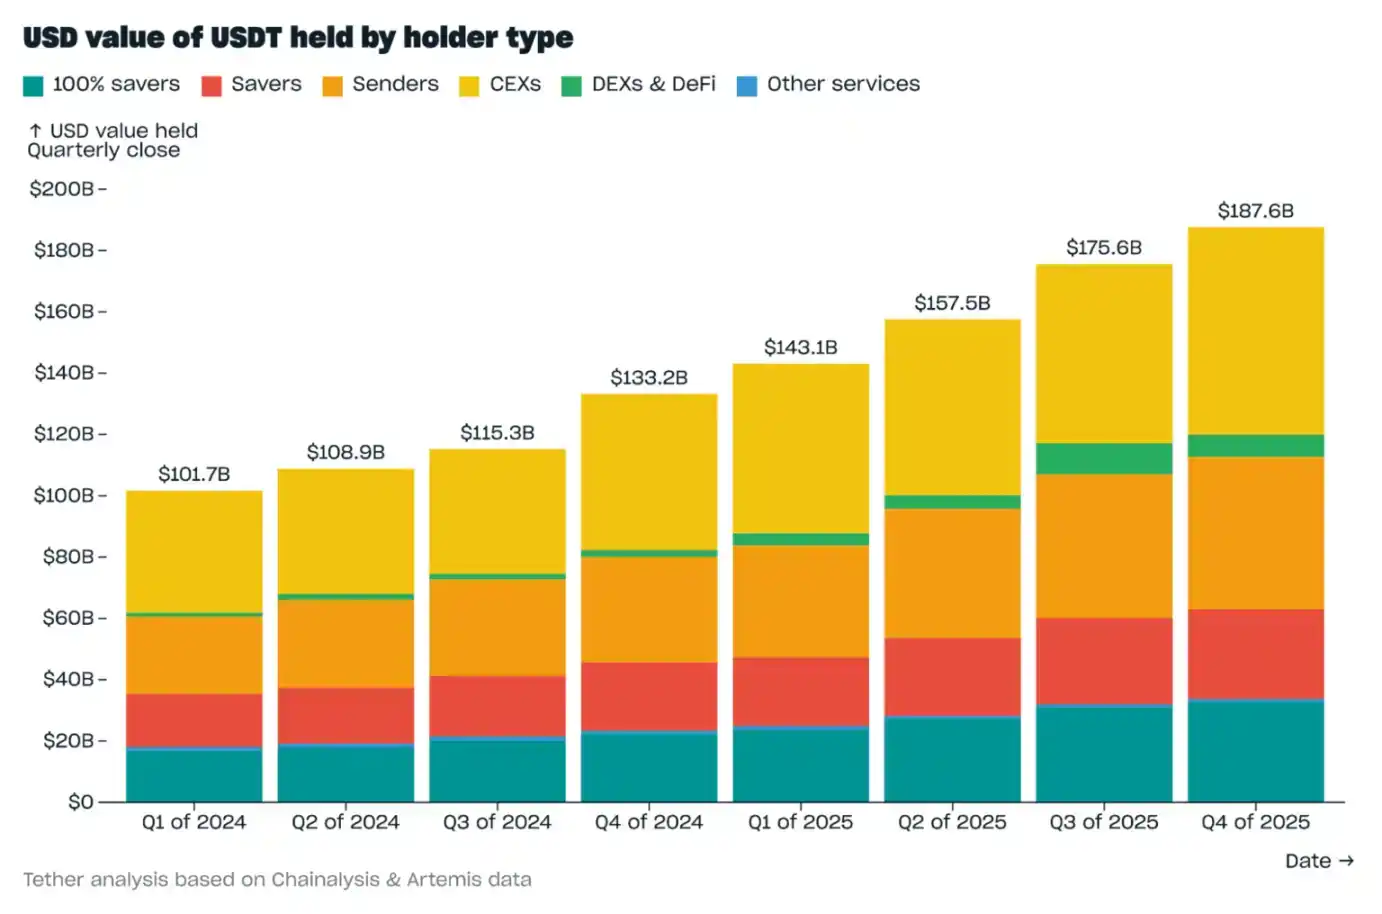
Note that the total holdings figure here is slightly higher than the USDT market cap because total holdings include USDT in Tether's treasury that has not yet been issued, while the market cap only calculates USDT in net circulation.

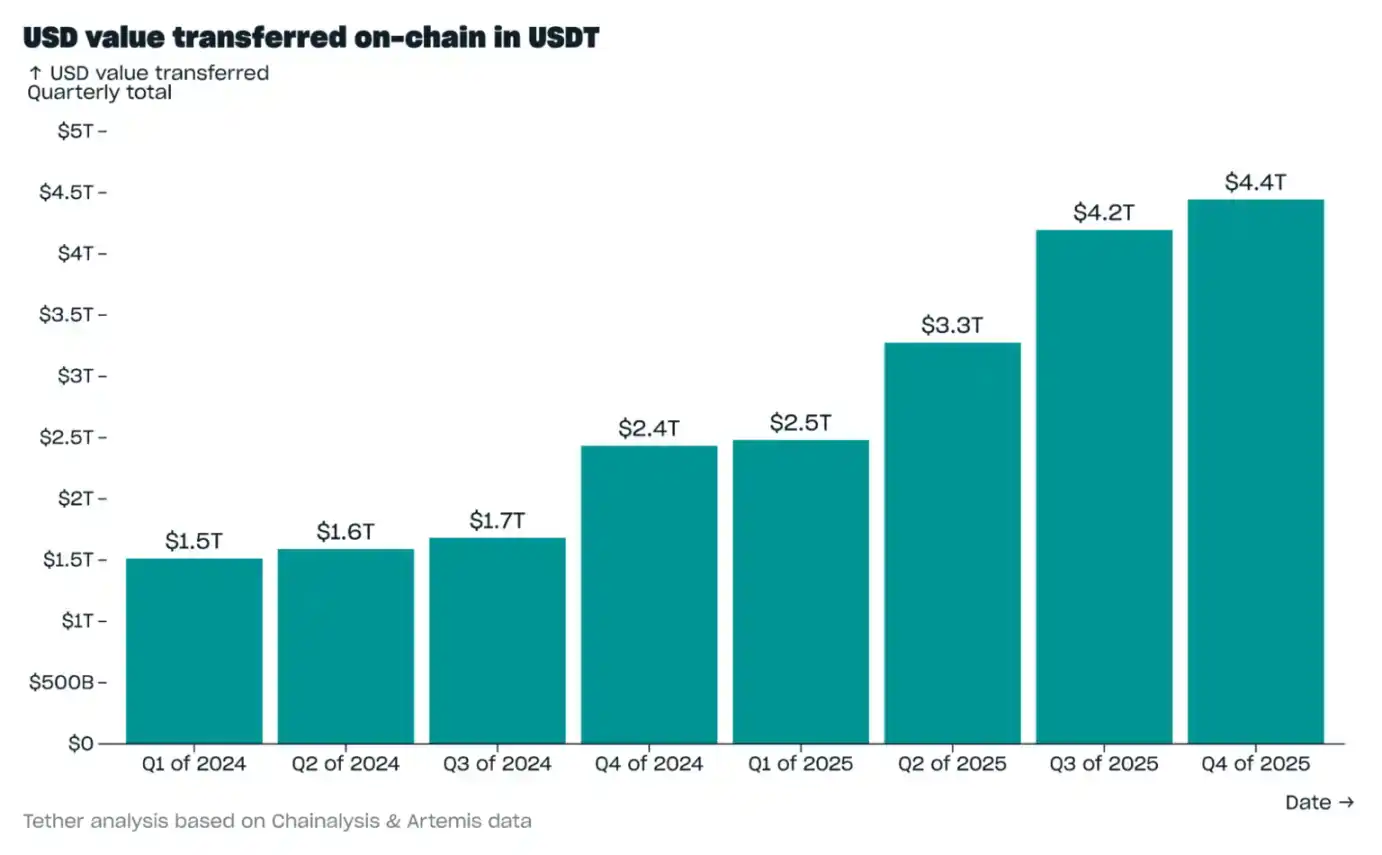
On-Chain Transfer Value

In Q4 2025, the quarterly on-chain transfer value of USDT increased by $248.6 billion, reaching $4.4 trillion, an all-time high. Of this $4.4 trillion quarterly total transfer value, $2.8 trillion (63.6%) were transfers involving only USDT, and $1.6 trillion (36.4%) were transfers involving multiple assets (these often occur in DeFi swap scenarios).

USDT's share of value in single-asset stablecoin transfers was 65.9%; its share in multi-asset stablecoin transfers was 34.6%. This data indicates that USDT remains the preferred stablecoin for value transfer, while other stablecoins are more often used for value exchange, often with USDT as the counterparty.

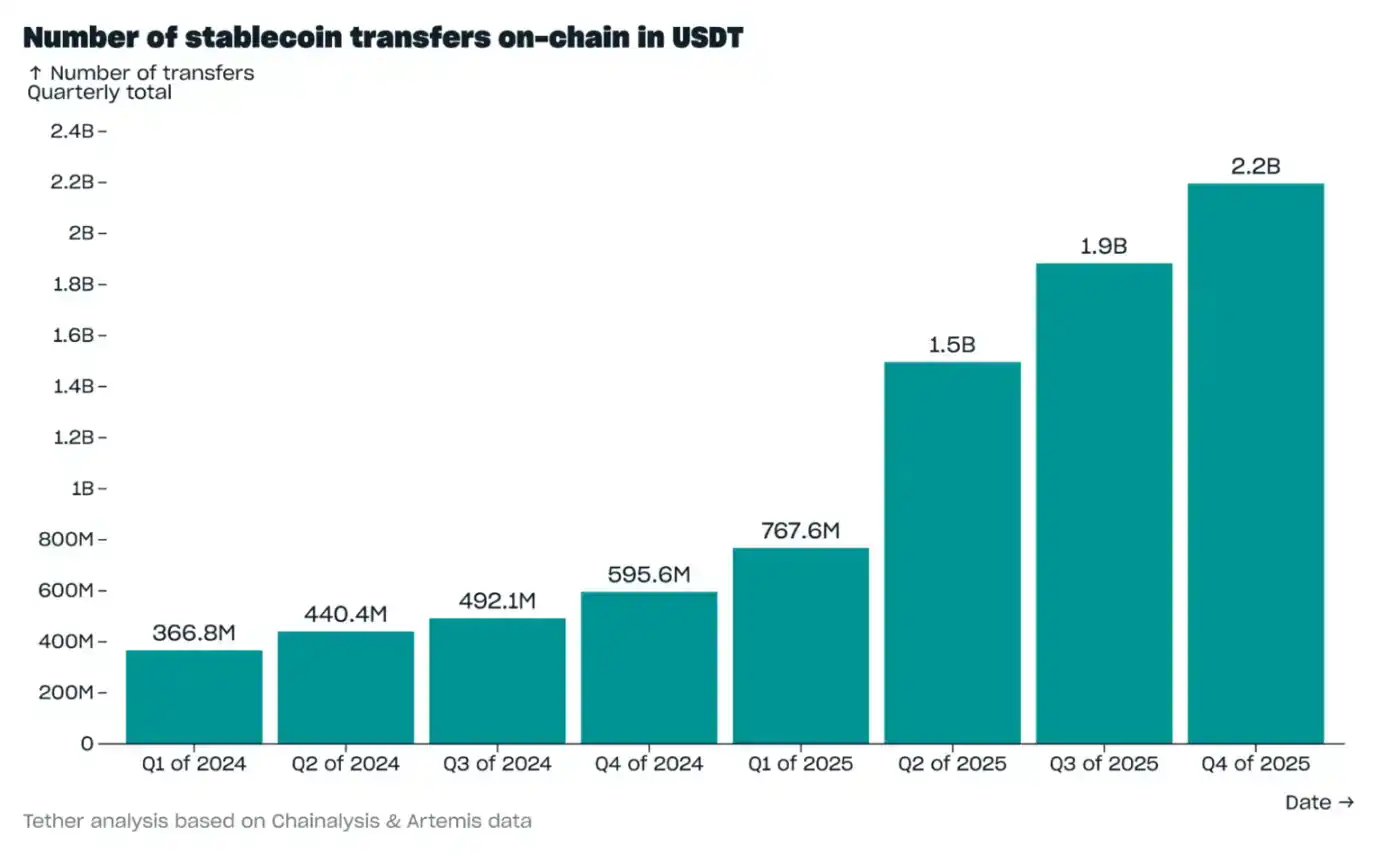
On-Chain Transfer Count

In Q4 2025, the quarterly count of on-chain USDT transfers increased by 313.1 million, reaching 2.2 billion, an all-time high. Of these 2.2 billion total quarterly transfers:

· 1.94 billion transfers (88.2%) were for amounts below $1,000;

· 256 million transfers (11.6%) were for amounts between $1,000 and $100,000;

· 4.6 million transfers (0.2%) were for amounts over $100,000.
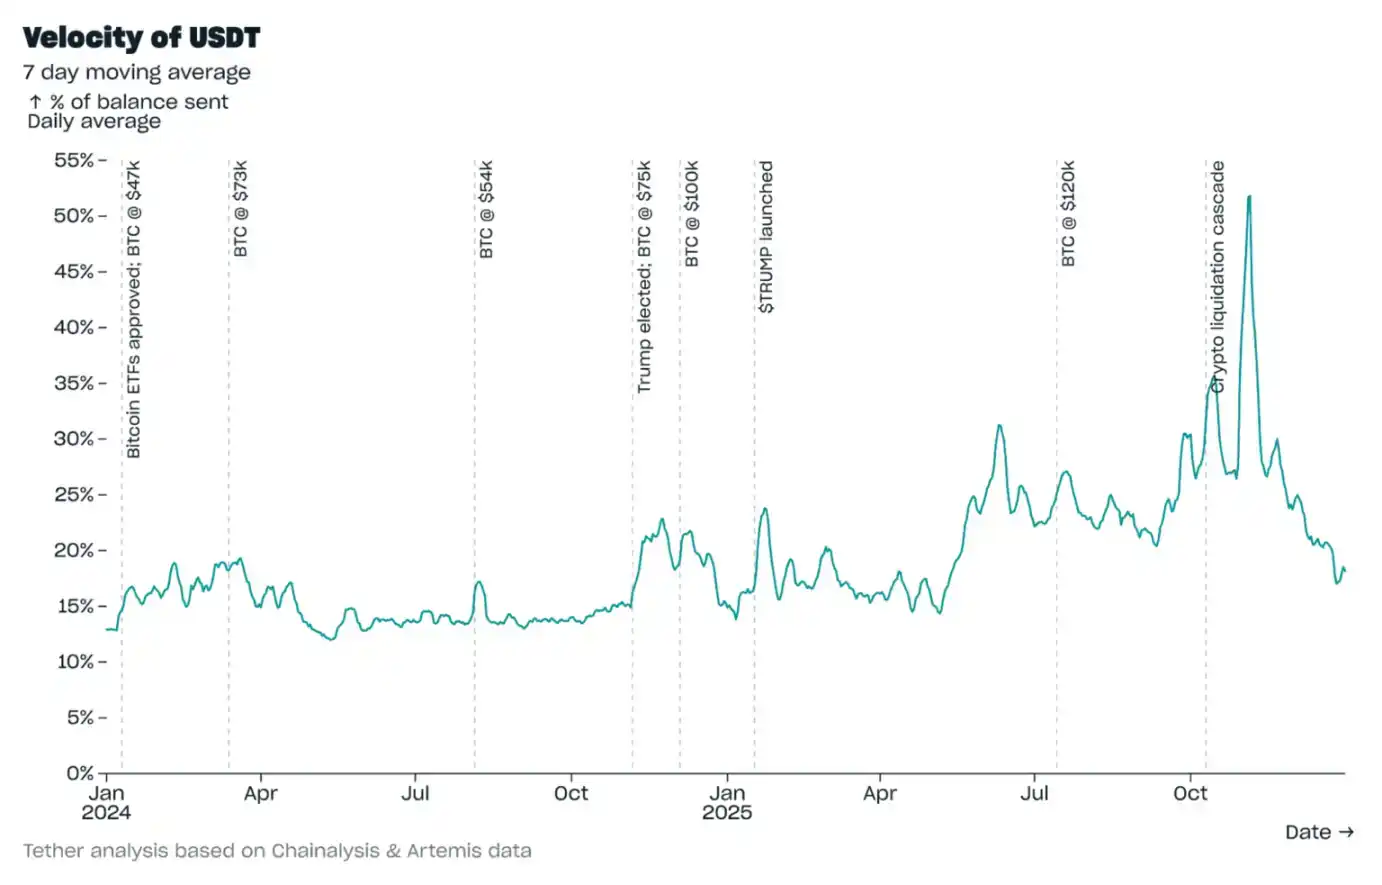
Velocity

As of the end of Q4 2025, calculated on a 7-day moving average, USDT's velocity (daily transfer value as a percentage of total holdings) was 18.2%. This is lower than the peak of 51.8% on November 5 (driven by a surge in DeFi activity) and is similar to levels seen prior to Q2 2025 (when Bitcoin prices were similar to this quarter).

The average velocity for USDT in Q4 was 28%, significantly lower than the 151% velocity of the second-largest stablecoin by market cap. USDT's relatively lower velocity indicates a user base with stronger stickiness, higher stability, and, as discussed later, more diverse use cases.

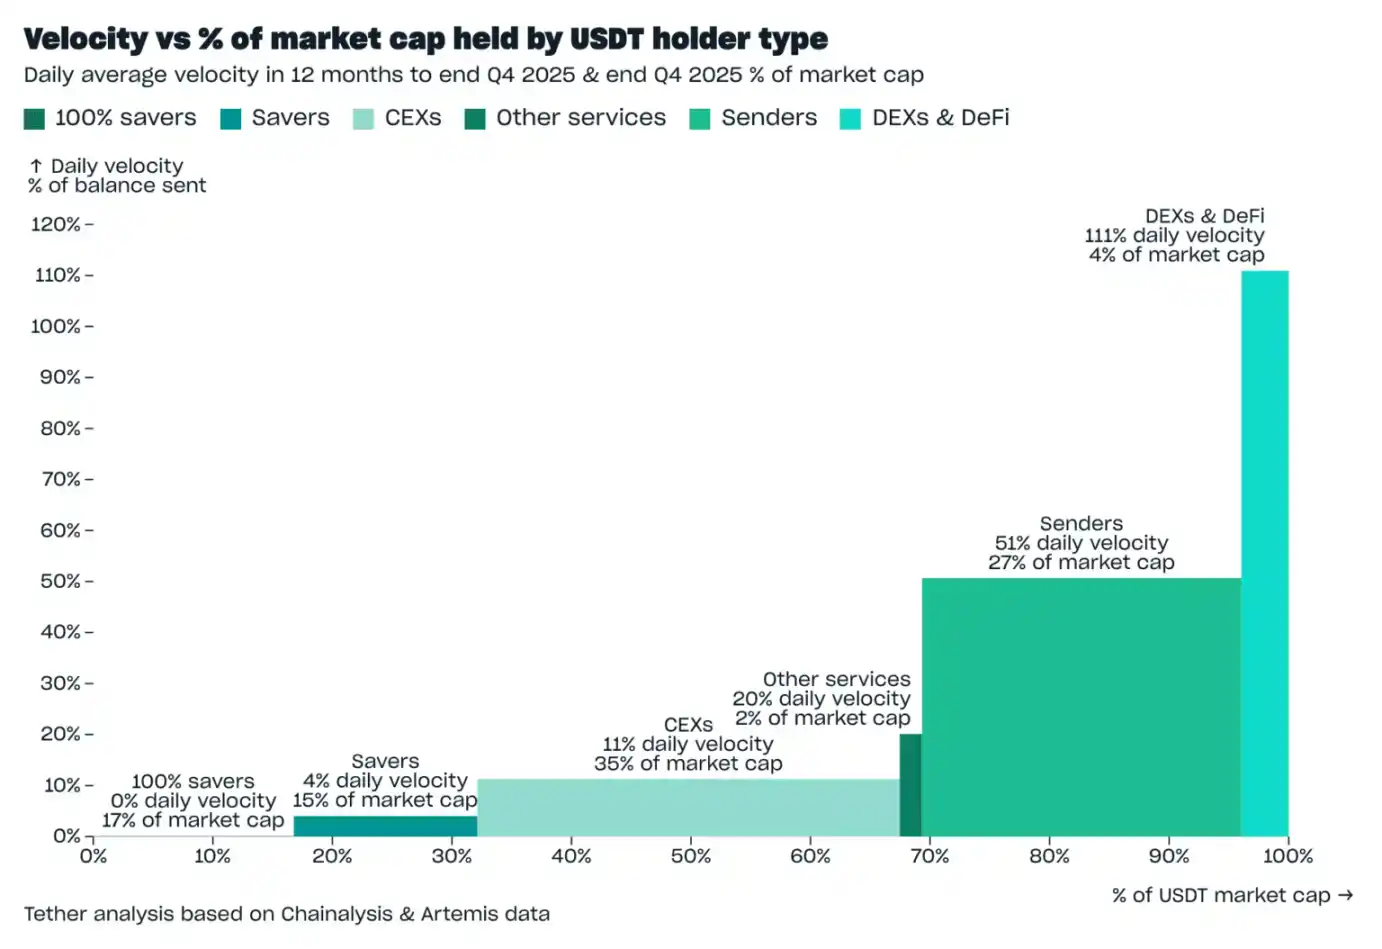
USDT's velocity naturally varies by use case: users holding USDT for savings purposes have lower velocity (as they typically hold rather than transfer). The velocity for "Pure Savers" is naturally 0, while the average daily velocity for "Savers" in 2025 was 4%.

On-chain velocity for centralized exchanges is also low, with an average daily velocity of 11% in 2025. This is because users hold USDT on exchanges for both potential savings and trading—but as the next section will mention, trading volume on exchanges is recorded on centralized order books, not on the blockchain, so the amount of USDT transferred on-chain out of centralized exchanges is low relative to the USDT holdings on those exchanges.

Use cases with higher USDT velocity include:

· "Transactor" wallets: Average daily velocity in 2025 was 51%. These wallets transfer USDT for various purposes, including payments, remittances, moving funds between exchanges, etc.;

· DEX and DeFi platforms: Average daily velocity in 2025 was 111%. Velocity in these scenarios is typically very high because DEX trades are recorded on the blockchain, and users may execute multiple trades in a single day, ultimately resulting in velocity exceeding 100%.

67% of USDT's market cap is distributed in low-velocity scenarios, and 33% in high-velocity scenarios. This distribution ensures stability through low-velocity scenarios and liquidity through high-velocity scenarios.
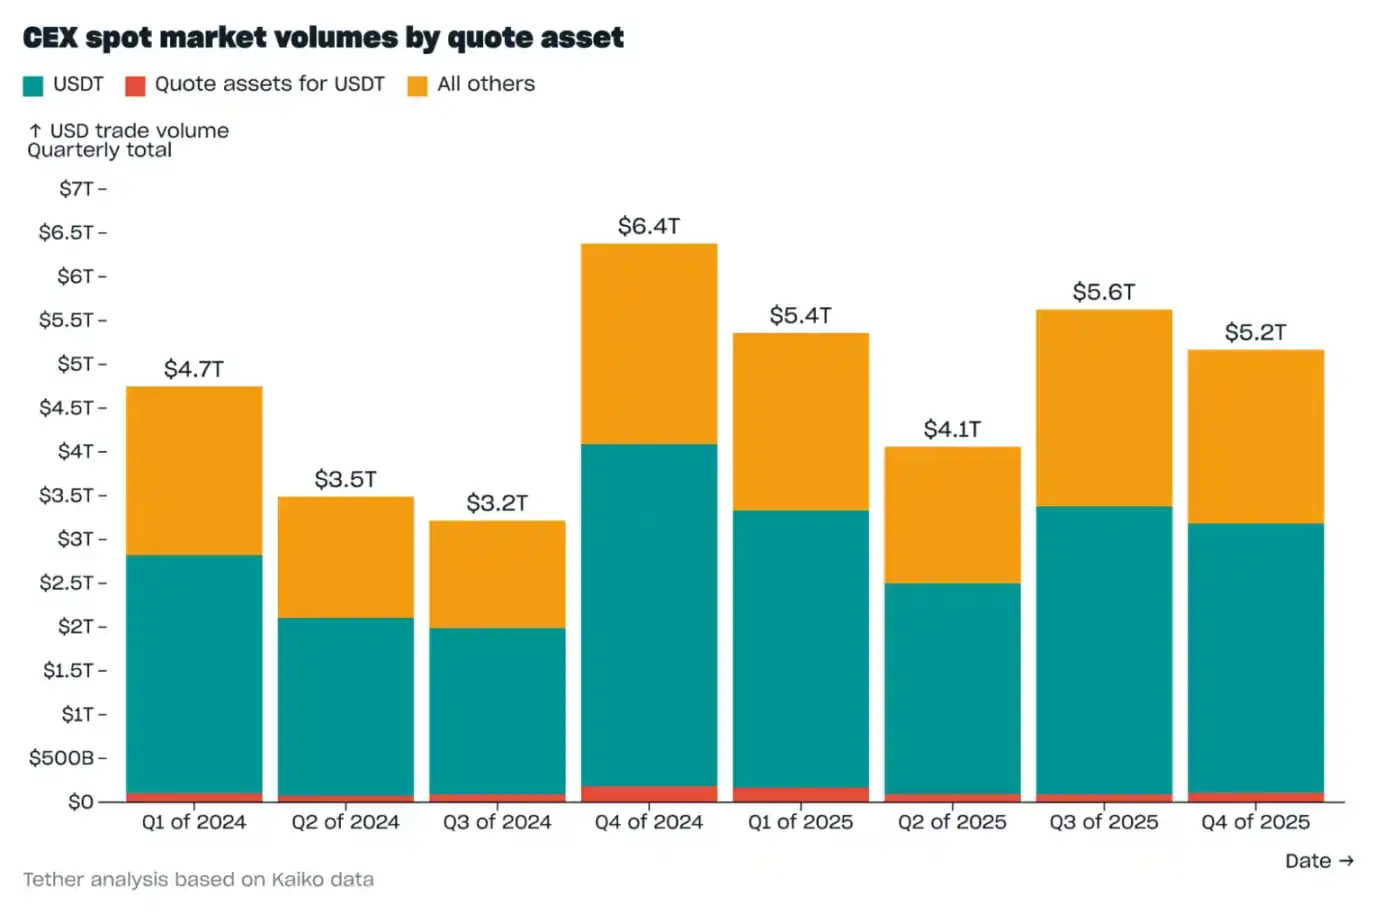
Spot Market

In Q4 2025, the spot trading volume for USDT on centralized exchanges was $3.2 trillion, of which 96.5% had USDT as the quote asset, and the remainder had other assets quoted against USDT. Affected by the October 10 cryptocurrency liquidation wave, volume decreased by 5.9% compared to Q3. However, since the trading volume of all other assets decreased by 11.5% compared to Q3, USDT's share of the total spot market trading volume反而 increased by 1.5 percentage points, reaching 61.5%.

In Q4, the number of USDT spot trades was 14.1 billion, accounting for 80% of all spot trades in the quarter.

Conclusion

In Q4 2025, USDT achieved numerous all-time highs, although growth slowed after the October 10 cryptocurrency liquidation wave. However, the data indicates that the cryptocurrency market is not the sole driver of USDT's growth.

Compared to other stablecoins, user preference for saving in USDT is significantly higher (USDT accounts for 75% of all stablecoin savings wallets; and 77% of the savings value in wallets holding less than $10 million), providing USDT with a stable, low-velocity source of demand.

In high-velocity use cases as a medium of exchange, USDT also leads: it accounts for 65.9% of the value in single-asset stablecoin transfers and 34.6% in multi-asset stablecoin transfers. This phenomenon indicates that USDT remains the preferred stablecoin for value transfer, while other stablecoins are more often used for value exchange (often with USDT as the counterparty). These high-velocity use cases provide ample liquidity for USDT, ensuring its wide availability and acceptance.

Related Questions

QWhat was the market capitalization of USDT in Q4 2025, and how much did it grow by during that quarter?

AThe market capitalization of USDT reached $187.3 billion in Q4 2025, growing by $12.4 billion during that quarter.

QHow did the market performance of the second and third largest stablecoins compare to USDT during the period from October 10, 2025, to February 1, 2026?

ADuring that period, while the total cryptocurrency market cap fell by over a third, USDT's market cap grew by 3.5%. In contrast, the market caps of the second and third largest stablecoins fell by 2.6% and 57%, respectively.

QWhat are the three main categories of on-chain USDT holders and their respective proportions of the total supply?

AThe three categories are: 'Pure Savings' holders (30.8%), 'Savings' holders (6.7%), and 'Transactional' holders (62.6%).

QWhat percentage of all stablecoin savings value is held in USDT, and how does this change when excluding wallets holding over $10 million?

AUSDT accounts for 59.9% of all stablecoin savings value. When excluding wallets holding over $10 million (which are often exchange wallets), this figure rises to 77.3%.

QWhat was the total on-chain transfer value for USDT in Q4 2025, and how is it broken down between single-asset and multi-asset transfers?

AThe total on-chain transfer value for USDT in Q4 2025 was $4.4 trillion. This was broken down into $2.8 trillion (63.6%) from single-asset transfers and $1.6 trillion (36.4%) from multi-asset transfers.

Related Reads

The Gold Buy-on-the-Dip Guide: Watch Interest Rates, Not Just War

"Gold Buying Guide: Focus on Interest Rates, Not Just War" Four months ago, gold buyers likely didn't anticipate buying at a peak that even a war couldn't sustain. After hitting a record high of $5,596 on January 29, gold entered a bear market just 91 days later, its fastest decline since 2008. A key trigger was the Fed's hawkish shift, highlighting that monetary policy, not geopolitics, is the primary driver. The article argues that the traditional "buy gold in turmoil" script has changed. While the US-Iran conflict initially boosted prices, the sustained rally in oil prices heightened inflation fears, forcing central banks to maintain or consider tighter policy. Since gold yields no interest, higher rates increase its opportunity cost, eroding its appeal. This dynamic was evident when gold fell sharply on May 18 despite positive peace talks, as lower oil prices eased inflation and thus rate hike pressures. The recent sell-off is also part of a broader market deleveraging. Correlations between gold, Nasdaq, and Bitcoin spiked as leveraged investors sold liquid assets to cover losses, creating a synchronized downturn. Historically, gold bottoms align with policy shifts, not conflict resolutions. The 2008 and 2022 bear markets ended with shifts to extreme easing and peak inflation expectations, respectively. For potential buyers, the author suggests monitoring three signals: 1) Peak interest rate hike expectations, 2) Reopening of the Strait of Hormuz (to ease oil/inflation pressure), and 3) A return to net inflows for Gold ETFs, indicating the end of forced selling. While predicting the exact bottom is impossible, the author's personal strategy involves scaling into a position across price levels like $4000, $3700, and $3500, committing no more than 30% of the intended total allocation initially, and adding the remainder only if key signals emerge. The core conclusion: In turbulent times, watching interest rates is more crucial than watching wars.

marsbit6m ago

The Gold Buy-on-the-Dip Guide: Watch Interest Rates, Not Just War

marsbit6m ago

Recent On-Chain Review: No Clear Narrative Under U.S. Stock Market Pressure, Just Hype

This article analyzes the current state of the Solana meme coin and community token ecosystem, highlighting a market caught between two dominant forces: attention-based PvP and a gradual return to community-centric projects. The first part explores the "Attention PvP" dynamic, where success is driven by celebrity endorsements, viral events, and speed. Examples include $JOTCHUA, which surged after its meme creator's social media activity, and $WORLDCUP, which outperformed a similar Base chain project ($PITCH) largely due to influencer support. The recent "pump.fun GO" feature, allowing bounty tasks for token promotion, is critiqued for fostering sensationalist and often negative stunts—like people getting token tickers tattooed on their bodies for rewards—reminiscent of old internet shock content. In contrast, the article points to a resurgence of organic, community-driven tokens that survive market volatility through strong holder bases and shared ideology, not just hype. Influencer Ansem is cited, arguing that durable meme coins rely on communities willing to endure losses and promote their core message daily. Examples given are older tokens like $neet (anti-work ethos), $troll, $buttcoin, and $triplet, which have maintained relative price stability. A prime example of this community-build model is the new project $KINS, the token for the browser-based MMORPG Kintara. Its success stems not from advanced graphics but from consistently delivering updates, fostering player trust, and creating genuine engagement (e.g., in-game economies, events, property auctions). It has attracted a growing player base and even notable KOLs as participants, demonstrating that sustainable growth can come from building trust rather than orchestrating pumps. The article concludes by questioning whether the market is ultimately a game of mutual trust or mutual deception, expressing hope that such reflection might lead to a healthier ecosystem.

marsbit6m ago

Recent On-Chain Review: No Clear Narrative Under U.S. Stock Market Pressure, Just Hype

marsbit6m ago

On-Chain Scene on Opening Day: $20 Billion Already Staked, How Do On-Chain Contracts Know Who Wins?

On the opening day of the 2026 World Cup, over $2 billion had already been wagered on just the "tournament winner" contracts on platforms like Polymarket and Kalshi. This article explores how these blockchain-based prediction markets actually function once the games begin. It breaks down the massive volume and explains how single-game and tournament-long contracts are priced, with values moving between 1-99 cents to reflect implied probabilities. A key mechanism highlighted is "elimination zeroing," where a team's "champion yes" contract immediately settles to zero once they are mathematically eliminated. The core technical question answered is: how does a smart contract "know" who won a real-world match? The answer lies in oracles. The article details two primary paradigms: UMA's "optimistic oracle" (used by most of Polymarket), which allows a challenge period after a proposed result, and Chainlink's multi-source data aggregation (used by FIFA partners like ADI Predictstreet), which automates settlement with minimal dispute windows. Finally, the article injects a note of caution, citing research estimating that a significant portion of historical trading volume on these platforms might be "wash trading" to inflate numbers. It concludes by contrasting the legal status of these "event contracts" under CFTC rules in the U.S. versus traditional, state-regulated sports betting. As the tournament progresses, the real-time operation of this multi-billion dollar machine—its settlements, eliminations, and underlying mechanisms—becomes a story as compelling as the football itself.

marsbit21m ago

On-Chain Scene on Opening Day: $20 Billion Already Staked, How Do On-Chain Contracts Know Who Wins?

marsbit21m ago

Sequoia Dialogue with Jensen Huang: Computing Model Undergoes a 60-Year Transformation; You Won't Be Replaced by AI, But You Will Be Dimensionality-Reduced by 'Those Who Master AI'

NVIDIA founder and CEO Jensen Huang, in a conversation with Sequoia Capital's Konstantine Buhler, argues that we are witnessing the most significant computing shift in 60 years—from retrieval-based to generative computing. Instead of just storing and retrieving data, future systems will generate highly personalized content (text, images, video) on demand, powered by massive "AI factories." Huang envisions a global "intelligence network" that will envelop the planet, following the historical patterns of energy and communication grids. He outlines a five-layer investment framework: 1) Energy, 2) Chips/Computers, 3) Infrastructure (data centers), 4) AI Models, and 5) Applications. He predicts this ecosystem will reach a scale of $20 trillion annually. Crucially, Huang pushes back against fears of AI-driven job loss. He distinguishes between specific "tasks" (e.g., typing, analyzing images) and overall "jobs" (e.g., CEO, radiologist). While AI automates tasks, it increases efficiency and demand for the higher-value problem-solving aspects of professions, thus creating more jobs and "up-leveling" careers. The real risk, he asserts, is not being replaced by AI, but being outperformed by someone who effectively leverages it. He urges everyone to embrace AI as a tool for augmented capability and innovation.

marsbit1h ago

Sequoia Dialogue with Jensen Huang: Computing Model Undergoes a 60-Year Transformation; You Won't Be Replaced by AI, But You Will Be Dimensionality-Reduced by 'Those Who Master AI'

marsbit1h ago

Trading

Spot
Futures
活动图片