TACO Is Outdated, Wall Street Is Betting Heavily on NACHO

marsbitPublished on 2026-05-10Last updated on 2026-05-10

Abstract

The article discusses a shift on Wall Street from the "TACO" (Trump Always Chickens Out) trading theme to a new one called "NACHO" (Not A Chance Hormuz Opens). This change reflects the market's adaptation to a prolonged closure of the Strait of Hormuz following U.S.-Israel airstrikes on Iran in late February. Unlike TACO, which bet on former President Trump de-escalating crises, NACHO bets on a protracted stalemate keeping the vital oil chokepoint shut. Key evidence for the NACHO regime includes a fundamental decoupling of oil prices and the S&P 500 since late March. While Brent crude has remained elevated (around $109 in May), the stock index has rallied to new highs. The market is pricing in a long but finite period of high oil prices, as seen in the steep futures curve. This theme is backed by real money in three derivatives markets: soaring war risk insurance for ships, an inverted oil futures structure, and evaporating expectations for Federal Reserve rate cuts in 2026. Within the equity market, the NACHO dynamic has caused a sharp divergence, with the energy sector (XLE) vastly outperforming the transportation sector (IYT), which is highly sensitive to fuel costs. The article notes a concrete deadline for this trade: early June. Analysts warn that global commercial oil inventories could approach critical "operational pressure" levels by then, potentially triggering more severe market disruptions if the Strait remains closed. Prediction markets currently assign a very...

Author: The Block

On Wall Street, the "TACO trade" is outdated. Now everyone is talking about a new trading pattern—"NACHO".

Since the US-Israel airstrikes on Iran on February 28, the Strait of Hormuz has remained closed. Currently, oil prices are up over 50% compared to pre-war levels, and the market's expectation for Fed rate cuts in 2026 has been compressed from 2 pre-war to the current 0. Yet during the same period, the S&P 500 hit a record high, rising for 6 consecutive weeks, marking its longest winning streak since 2024.

Wall Street has named this seemingly contradictory market state NACHO, which stands for "Not A Chance Hormuz Opens." It is the antonym of TACO ("Trump Always Chickens Out"). TACO bets on "people chickening out"—that Trump will back down at critical moments. NACHO bets on "things getting stuck"—that this time, the Strait of Hormuz cannot be reopened with just one Truth Social post.

eToro market analyst Zavier Wong describes this shift: "For most of the crisis, every ceasefire headline caused oil prices to plummet sharply. Traders kept betting on a solution that never arrived. NACHO means the market acknowledges that high oil prices are not a one-time shock but the current market environment itself."

Two Lines in Early April

March 23 was the tipping point for the TACO model's failure. That morning, Trump announced on Truth Social that he had a "very good constructive dialogue" with Iran and ordered the Pentagon to suspend strikes on Iranian energy facilities for 5 days. S&P 500 futures rebounded nearly 4% from the lows in minutes, instantly adding $1.7 trillion in market value. Brent crude fell from $109 intraday to $92.

Then, Iranian officials denied the existence of any dialogue. According to Iranian state media, a "senior security official" called it a market manipulation tactic, stating no dialogue ever took place. Gains were halved within two hours. The S&P closed up only +1.15%, and Brent bounced back to $99.94.

That was the first time in 14 months that Trump's "backing down" no longer worked for the market. The reason is not complicated. Backing down under the TACO model is one-sided, achievable with just one post. The backing down on March 23 required Iran's cooperation. When the opponent doesn't cooperate, backing down becomes a lie.

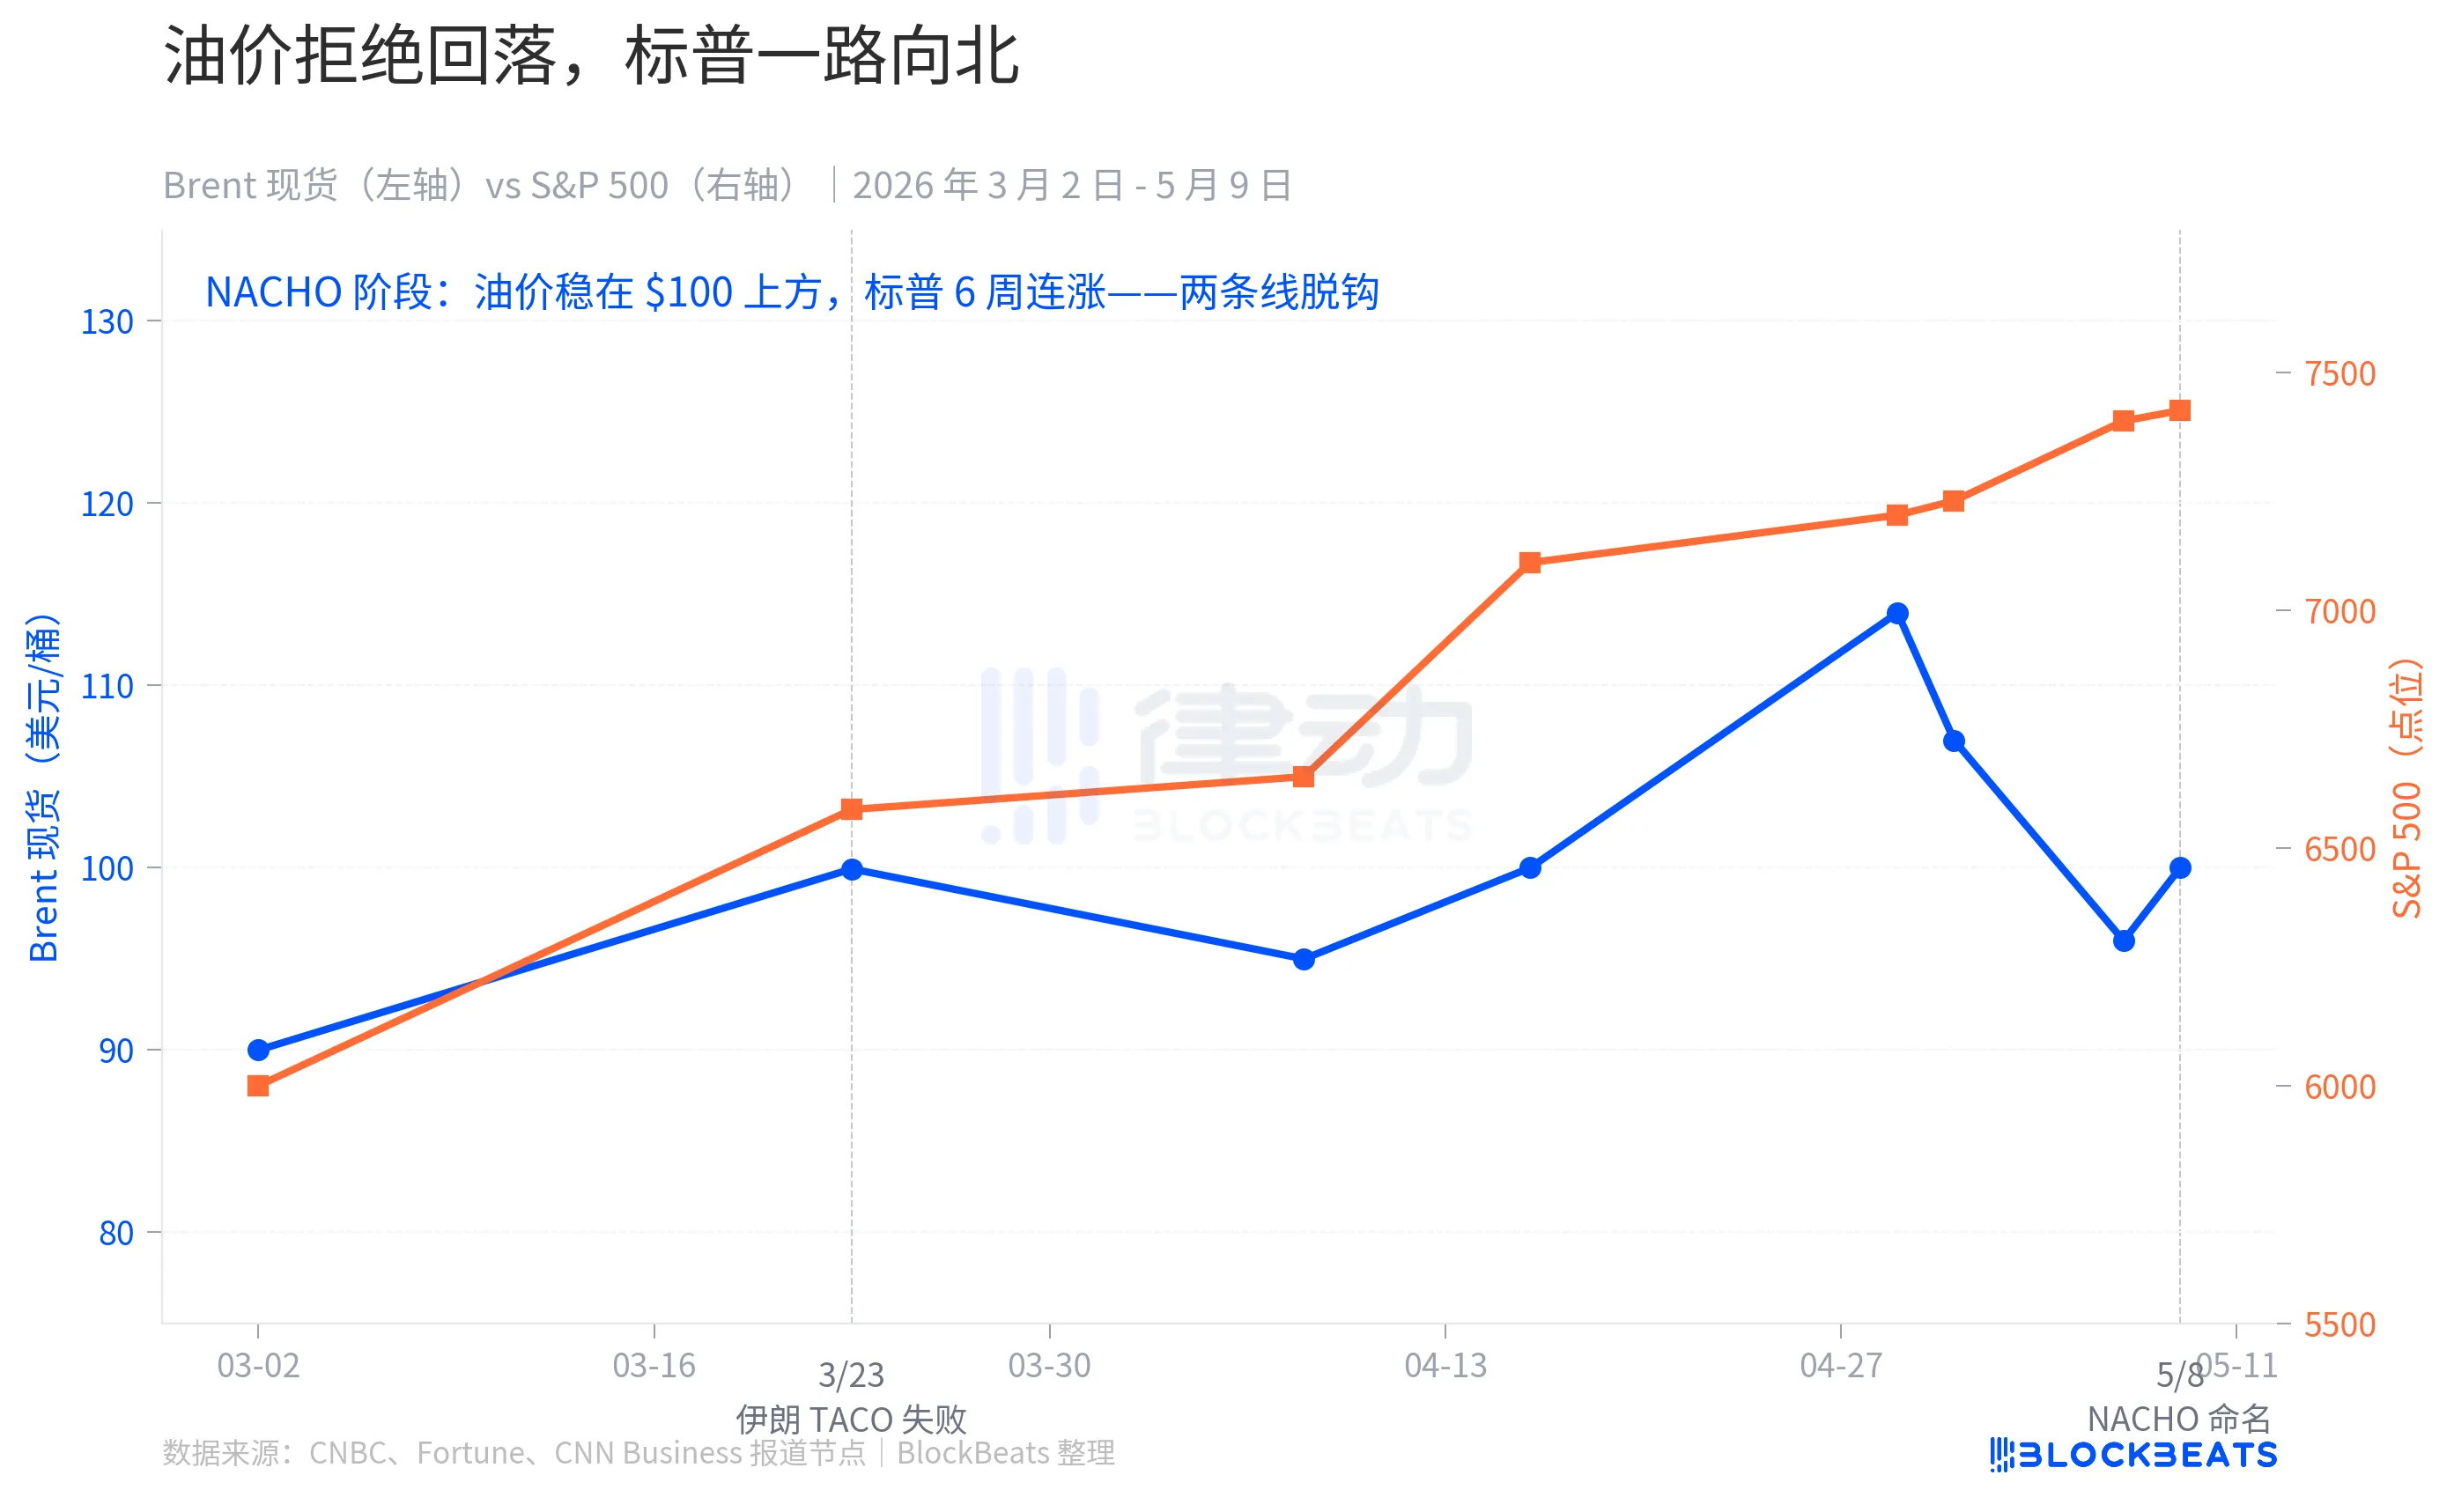
Starting that day, market behavior fundamentally changed. Brent crude never fell back to the pre-war level of $67 in the following 6 weeks, maintaining an average price of $109.57 in May. In between, there were the US-Iran ceasefire agreements on April 7-8, a period on April 17 when oil prices briefly returned to "initial war levels," and news on May 7 that the US and Iran were close to a deal. Each "ceasefire headline" failed to bring oil prices back to the baseline.

But the S&P marched northward. It rose 10% in April alone, its strongest month since November 2020, hitting 7 intraday record highs during the period. On May 1, it broke 7,230 points intraday; on May 7, it closed at 7,398 points.

The two lines completely decoupled in early April. In the TACO era, they moved in sync: threats caused oil and S&P to fall, backing down caused oil and S&P to rebound. In the NACHO era, they speak two different languages: oil says "Hormuz is shut for good," while the S&P says "not my problem."

Three Markets, Three Reactions

NACHO is not just talk; it's the same bet placed with real money across three independent derivatives markets.

The first layer is insurance. According to Strauss Center historical data, the war risk insurance rate for the Strait of Hormuz once soared to 3.5% of hull value during the 2003 US invasion of Iraq and reached 7.5% at the peak of the 1984 "Tanker War" during the Iran-Iraq War after the attack on the Yanbu Pride tanker. The baseline before this crisis was 0.125% to 0.25%. By early May, the rate had entered the 1% range, with some policies spiking to 3% to 8%.

Converted to the insurance cost per single voyage for a Very Large Crude Carrier (VLCC), the fee has jumped from about $250,000 pre-war to the current $800,000 to $8 million. The job of insurance companies is to price risk. The practical implication of this layer is: if insurers simply won't provide coverage, shipowners won't bear the risk of uninsured passage. "Physical opening" and "de facto navigation" of the Strait are two different things.

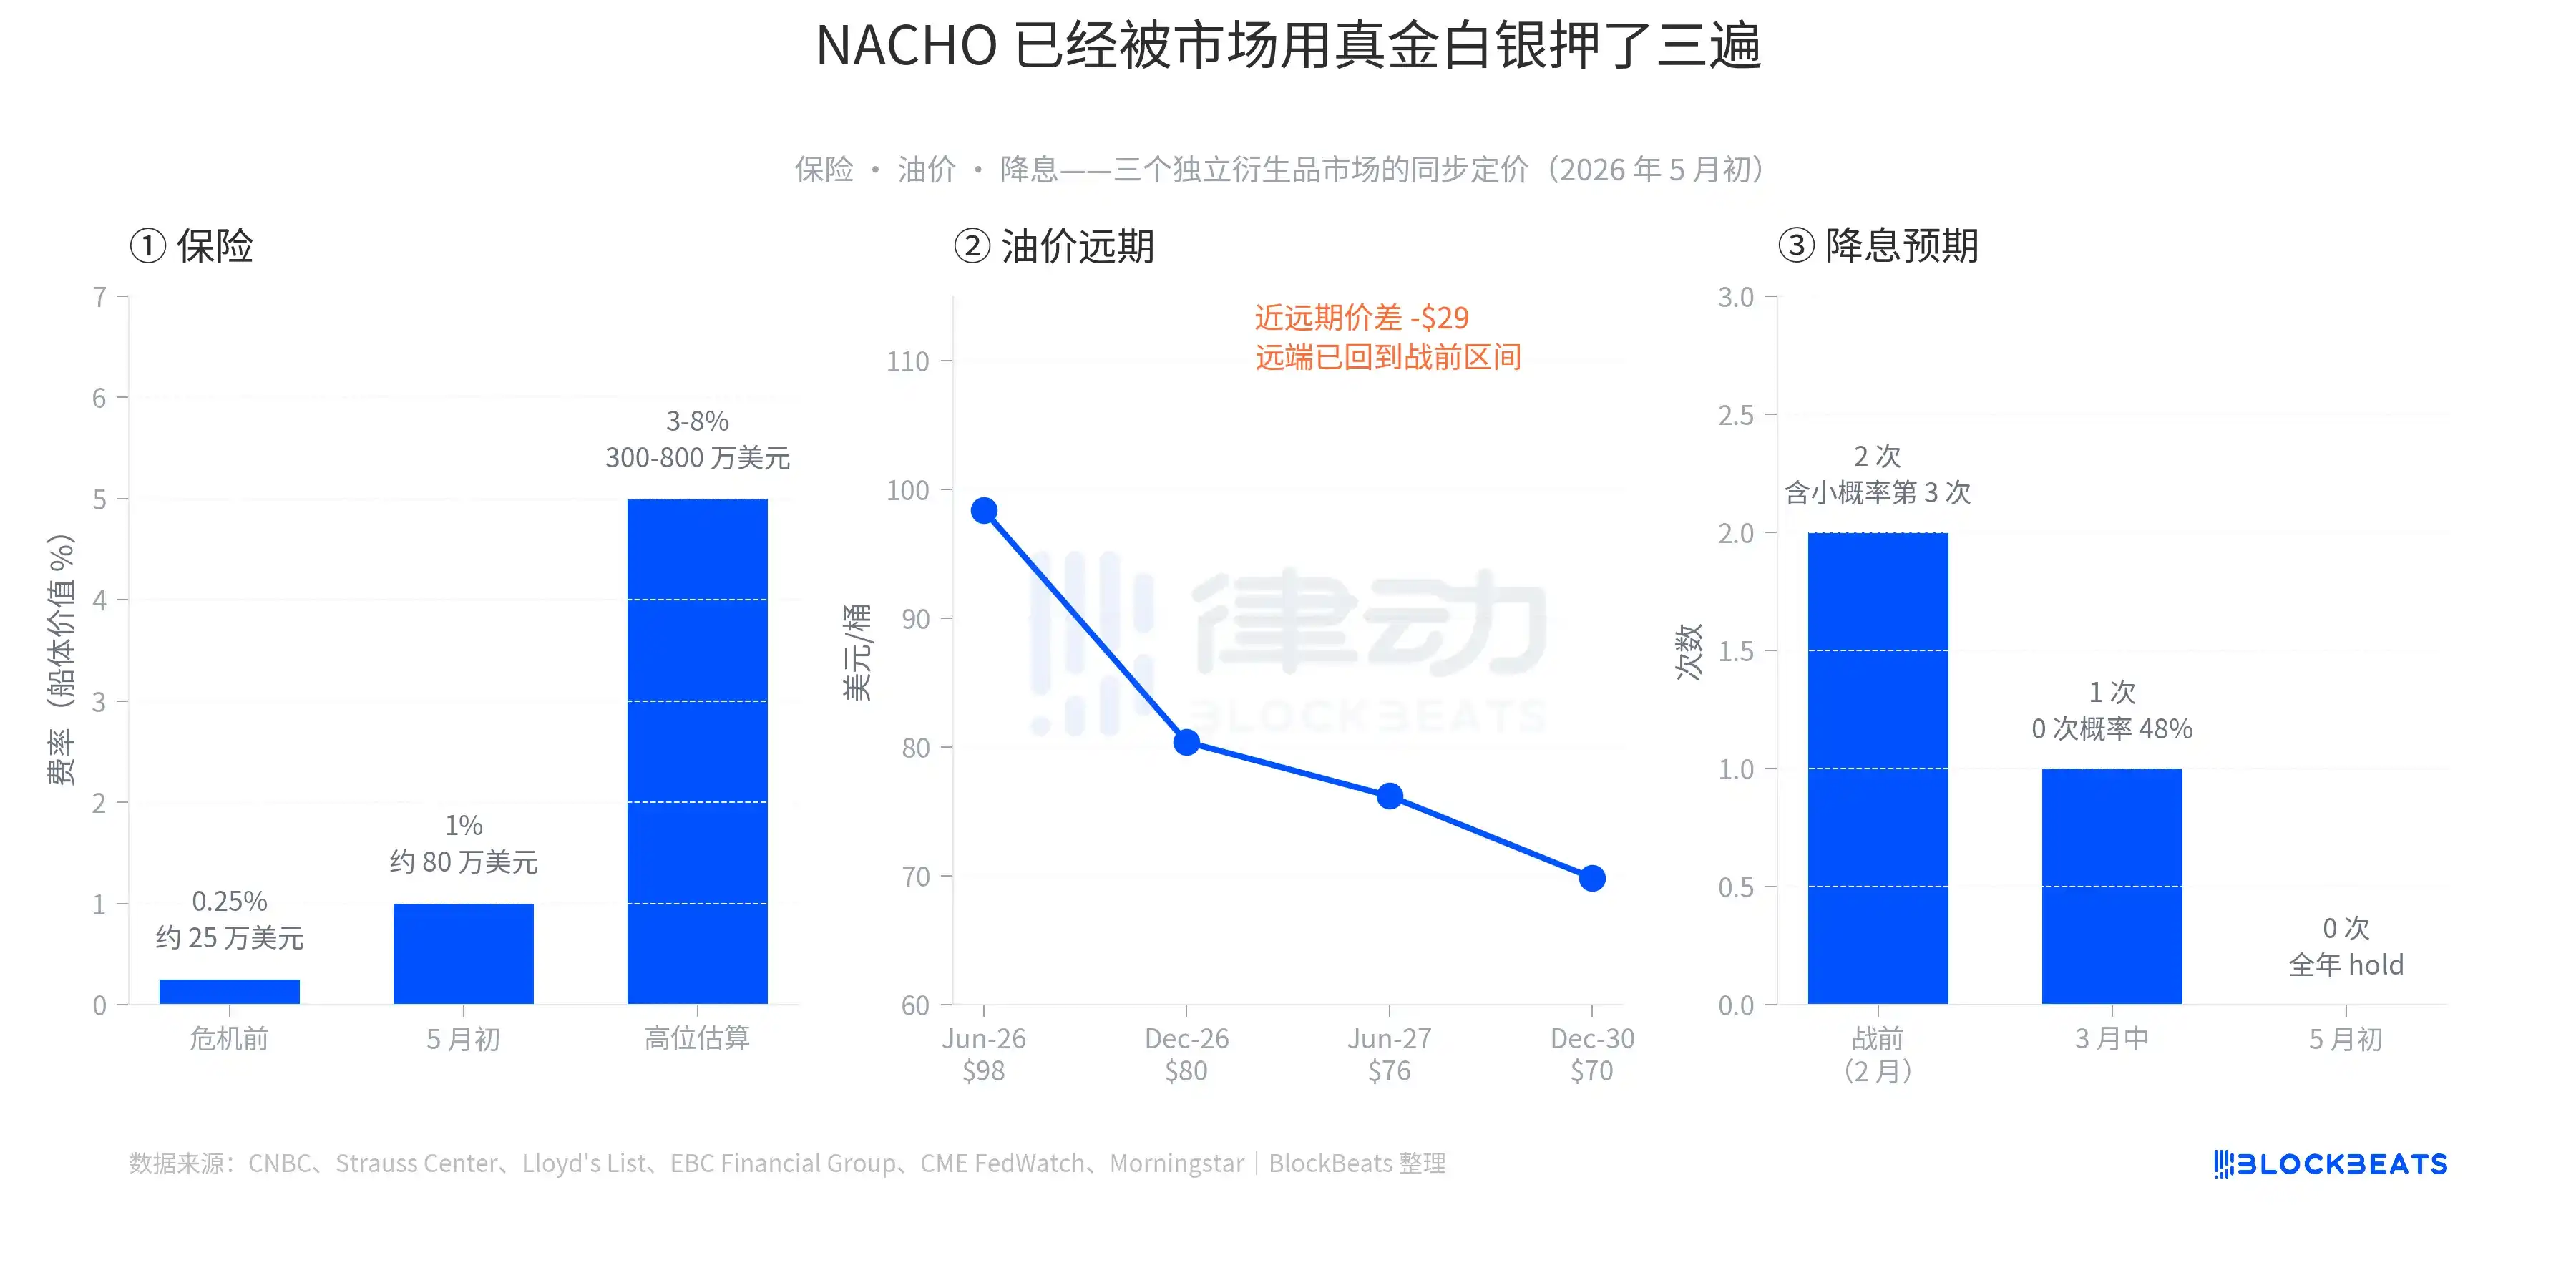
The second layer is oil prices. Early May data shows: Brent Jun-26 contract at $98.41, Dec-26 at $80.39, Jun-27 at $76.20, Dec-30 at $69.85. The spread between the front-month and Dec-30 is about $28.5, one of the steepest backwardation (near high, far low) structures in the past 5 years. This curve tells a very specific story: the market believes spot supply is tight but will eventually ease, with long-term prices returning to the pre-war range of $60-$70. In other words, high oil prices are not the final outcome but a bounded window. However, this window is long enough that traders don't bet on it ending suddenly.

The third layer is interest rate cuts. In early February 2026, the market expected the Fed to cut twice for the year, with a small chance of a third cut. By mid-March, after oil prices surged, it was compressed to one cut, with a 48% probability of 0 cuts. On April 29, the Fed held rates at 3.50% to 3.75%. On May 6, CME FedWatch showed a 70% probability of a continued hold at the June meeting. For all of 2026, the market is now pricing in 0 rate cuts. Hedge fund legend Paul Tudor Jones even said in a May 7 CNBC interview, "Not even Wash (likely meaning current Fed Chair) has a chance to make the Fed cut."

All three layers have left their mark in the derivatives markets—not just narrative, but real money.

The Differentiated Broad Market

The second subtle detail of NACHO is that it has already priced differentiation within the broad market.

As of the close on May 7, the Energy sector ETF (XLE, State Street's Energy Select Sector Fund) is up 31.63% year-to-date, the only major sector positive for all of 2026. Over the same period, the S&P 500 is up about 24%. The Transportation sector ETF (IYT, iShares U.S. Transportation ETF) is up only 8.79% year-to-date, underperforming the broader market by over 15 percentage points.

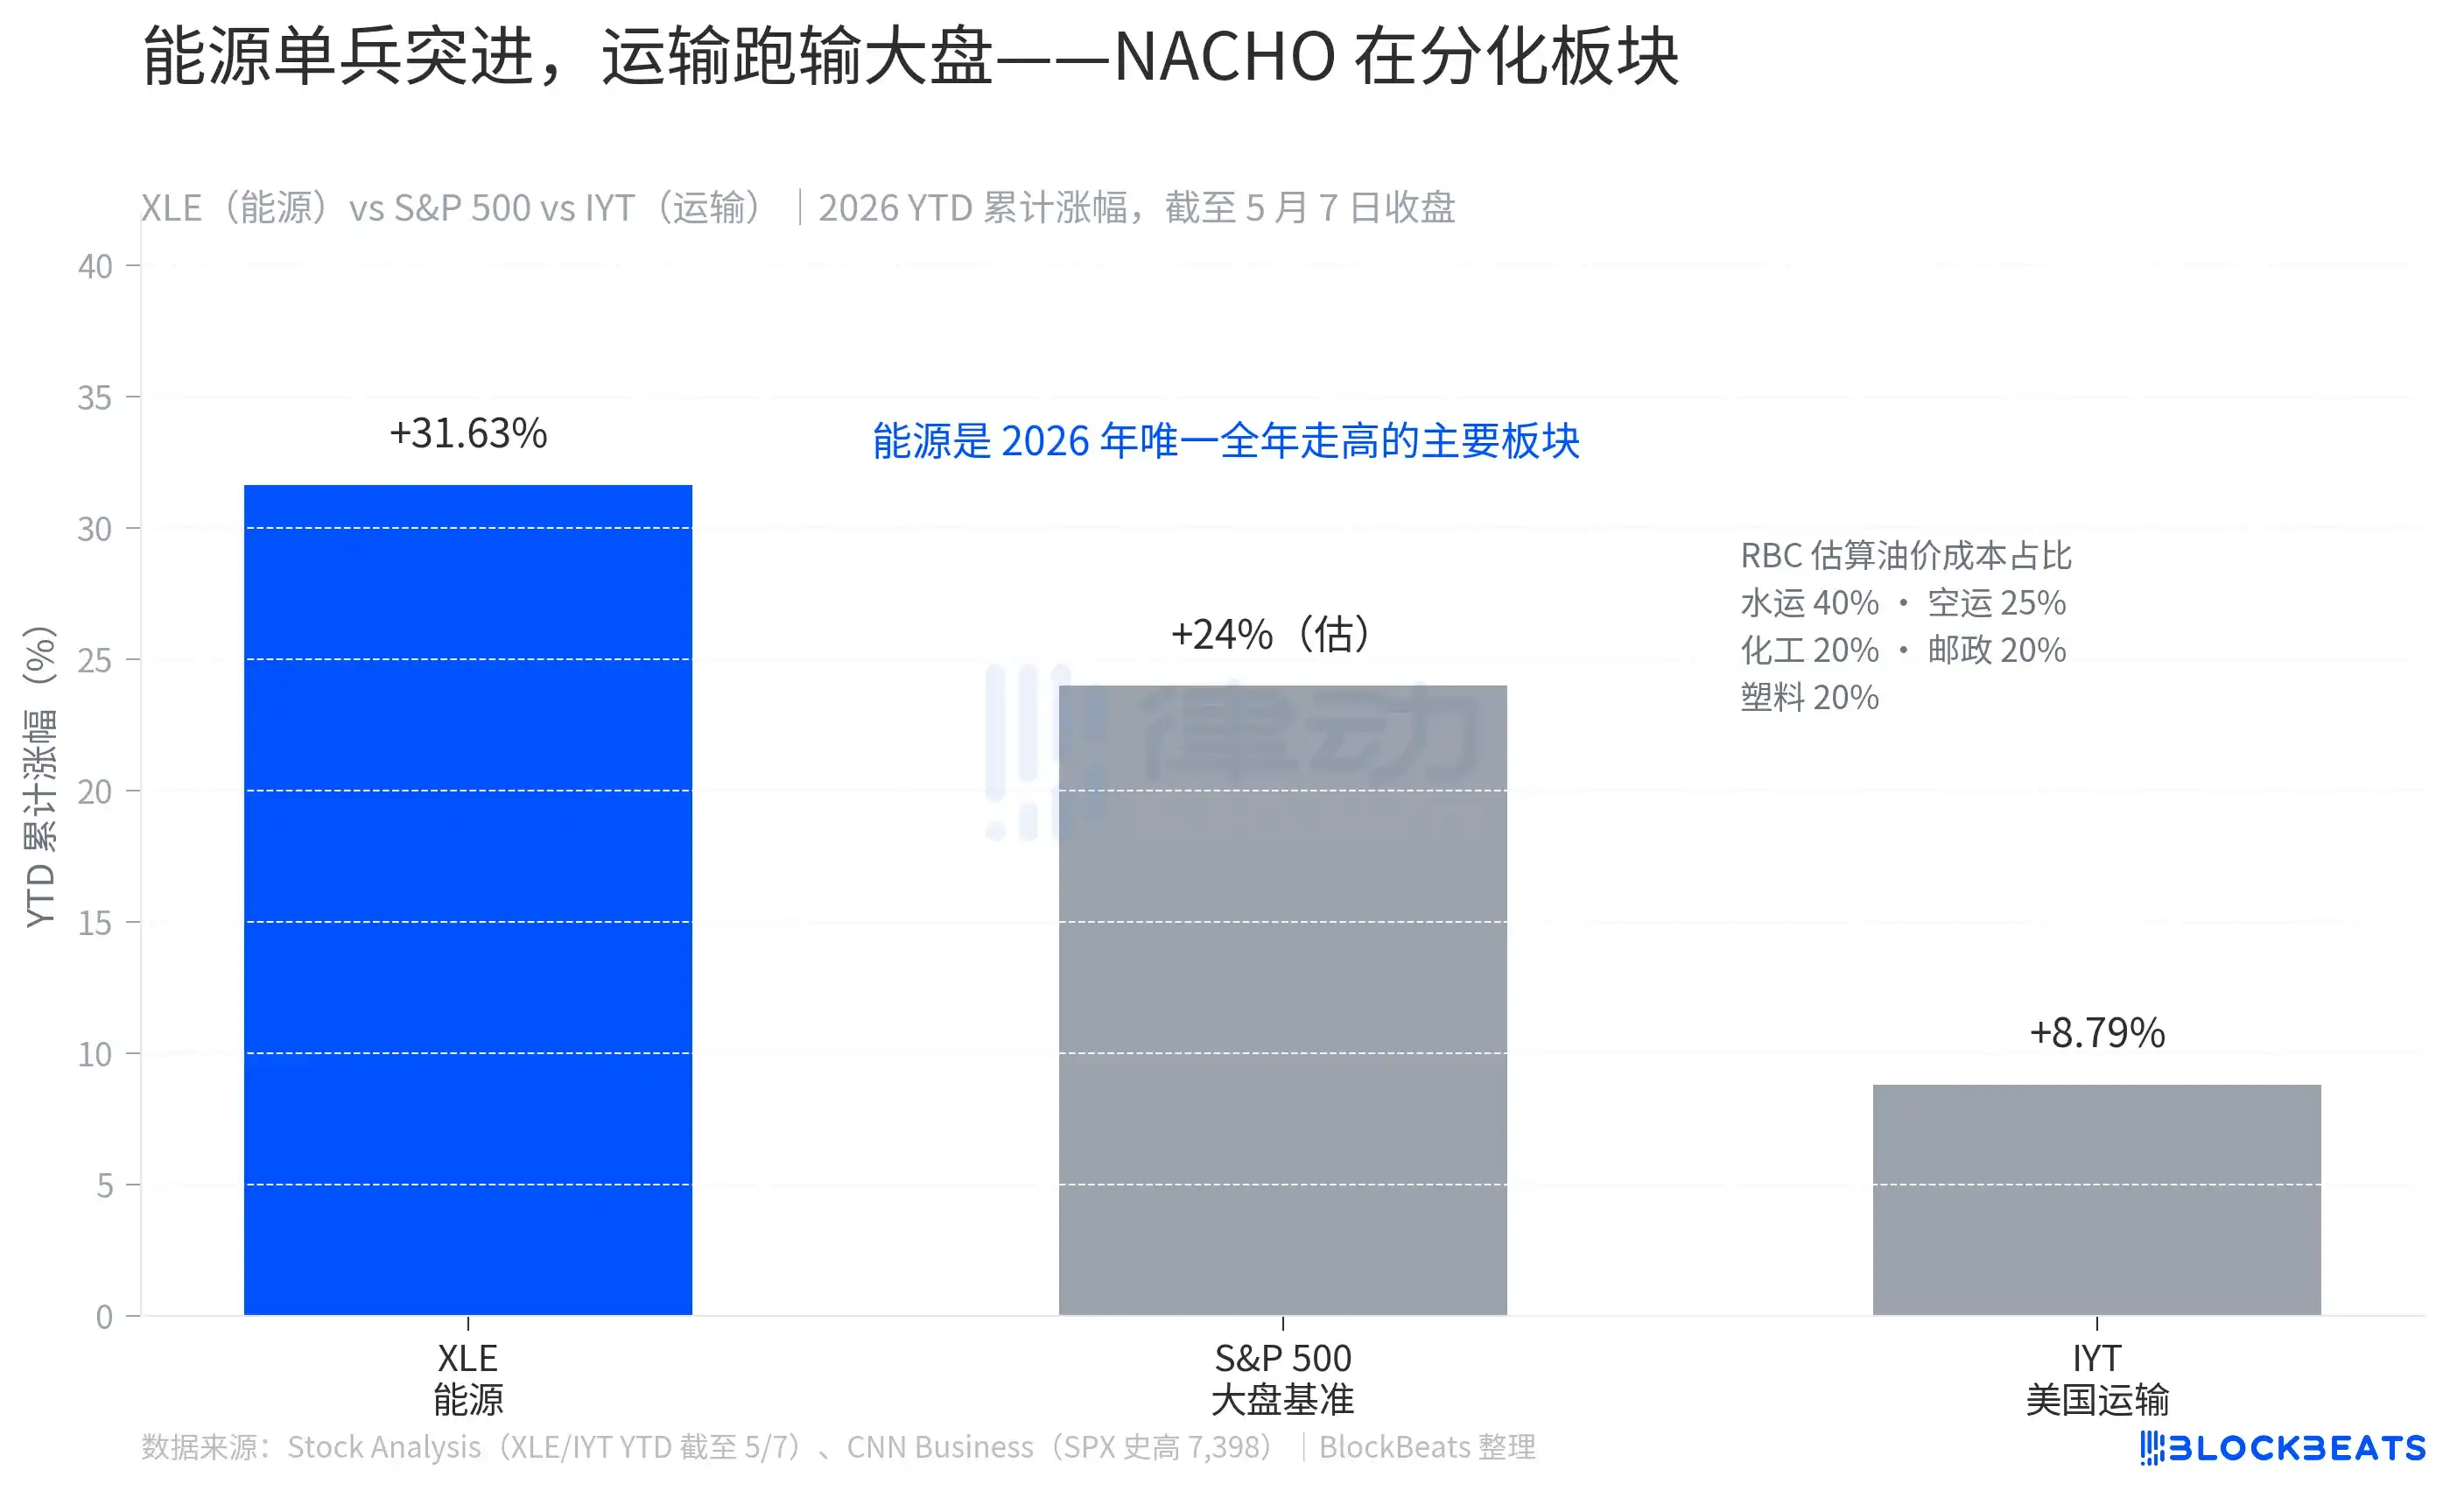
This gap is not random. According to RBC Capital Markets estimates, fuel costs account for 40% of operating costs in the water transport industry, 25% in air transport, and 20% each in chemicals, postal/courier services, and rubber/plastics. If fuel is a major item on your business's cost sheet, NACHO is a direct hit to your face.

XLE's 31.63% gain is not a short-term rebound; it's the result of 8 consecutive weeks of outperformance. IYT's 8.79% is not weakness; it's rising with the broad market while having its gains eroded by oil prices. The market has clearly shown readers how to calculate NACHO's odds—just look at the magnitude by which the Transportation ETF underperforms the market.

But NACHO is not a bet for an indefinite period; it has a very specific deadline: June 1.

According to JPMorgan's commodity research team estimates, global commercial crude oil inventories were about 8.4 billion barrels at the start of 2026, but only around 800 million barrels of that was "practically usable." The rest consists of pipeline fill, tank bottoms, minimum terminal stocks—maintaining the daily operation of the system. Since this crisis began, 280 million barrels have been drawn down, leaving about 520 million barrels of usable inventory remaining. JPMorgan's exact words: "Commercial inventories are expected to approach operational stress levels in early June."

"Operational stress level" is a specific physical concept. JPMorgan explains: "The system won't collapse because oil disappears; it will collapse because the distribution network no longer has sufficient working inventory." Once this line is breached, the only choices for businesses and governments are: either squeeze the minimum inventory necessary to maintain operations (which damages the infrastructure itself), or wait for new supply. If Hormuz remains closed until September, OECD commercial inventories could fall to the so-called "operational floor." According to a Fortune report, European aviation fuel inventories are expected to fall below the 23-day supply threshold in June, a key industry red line.

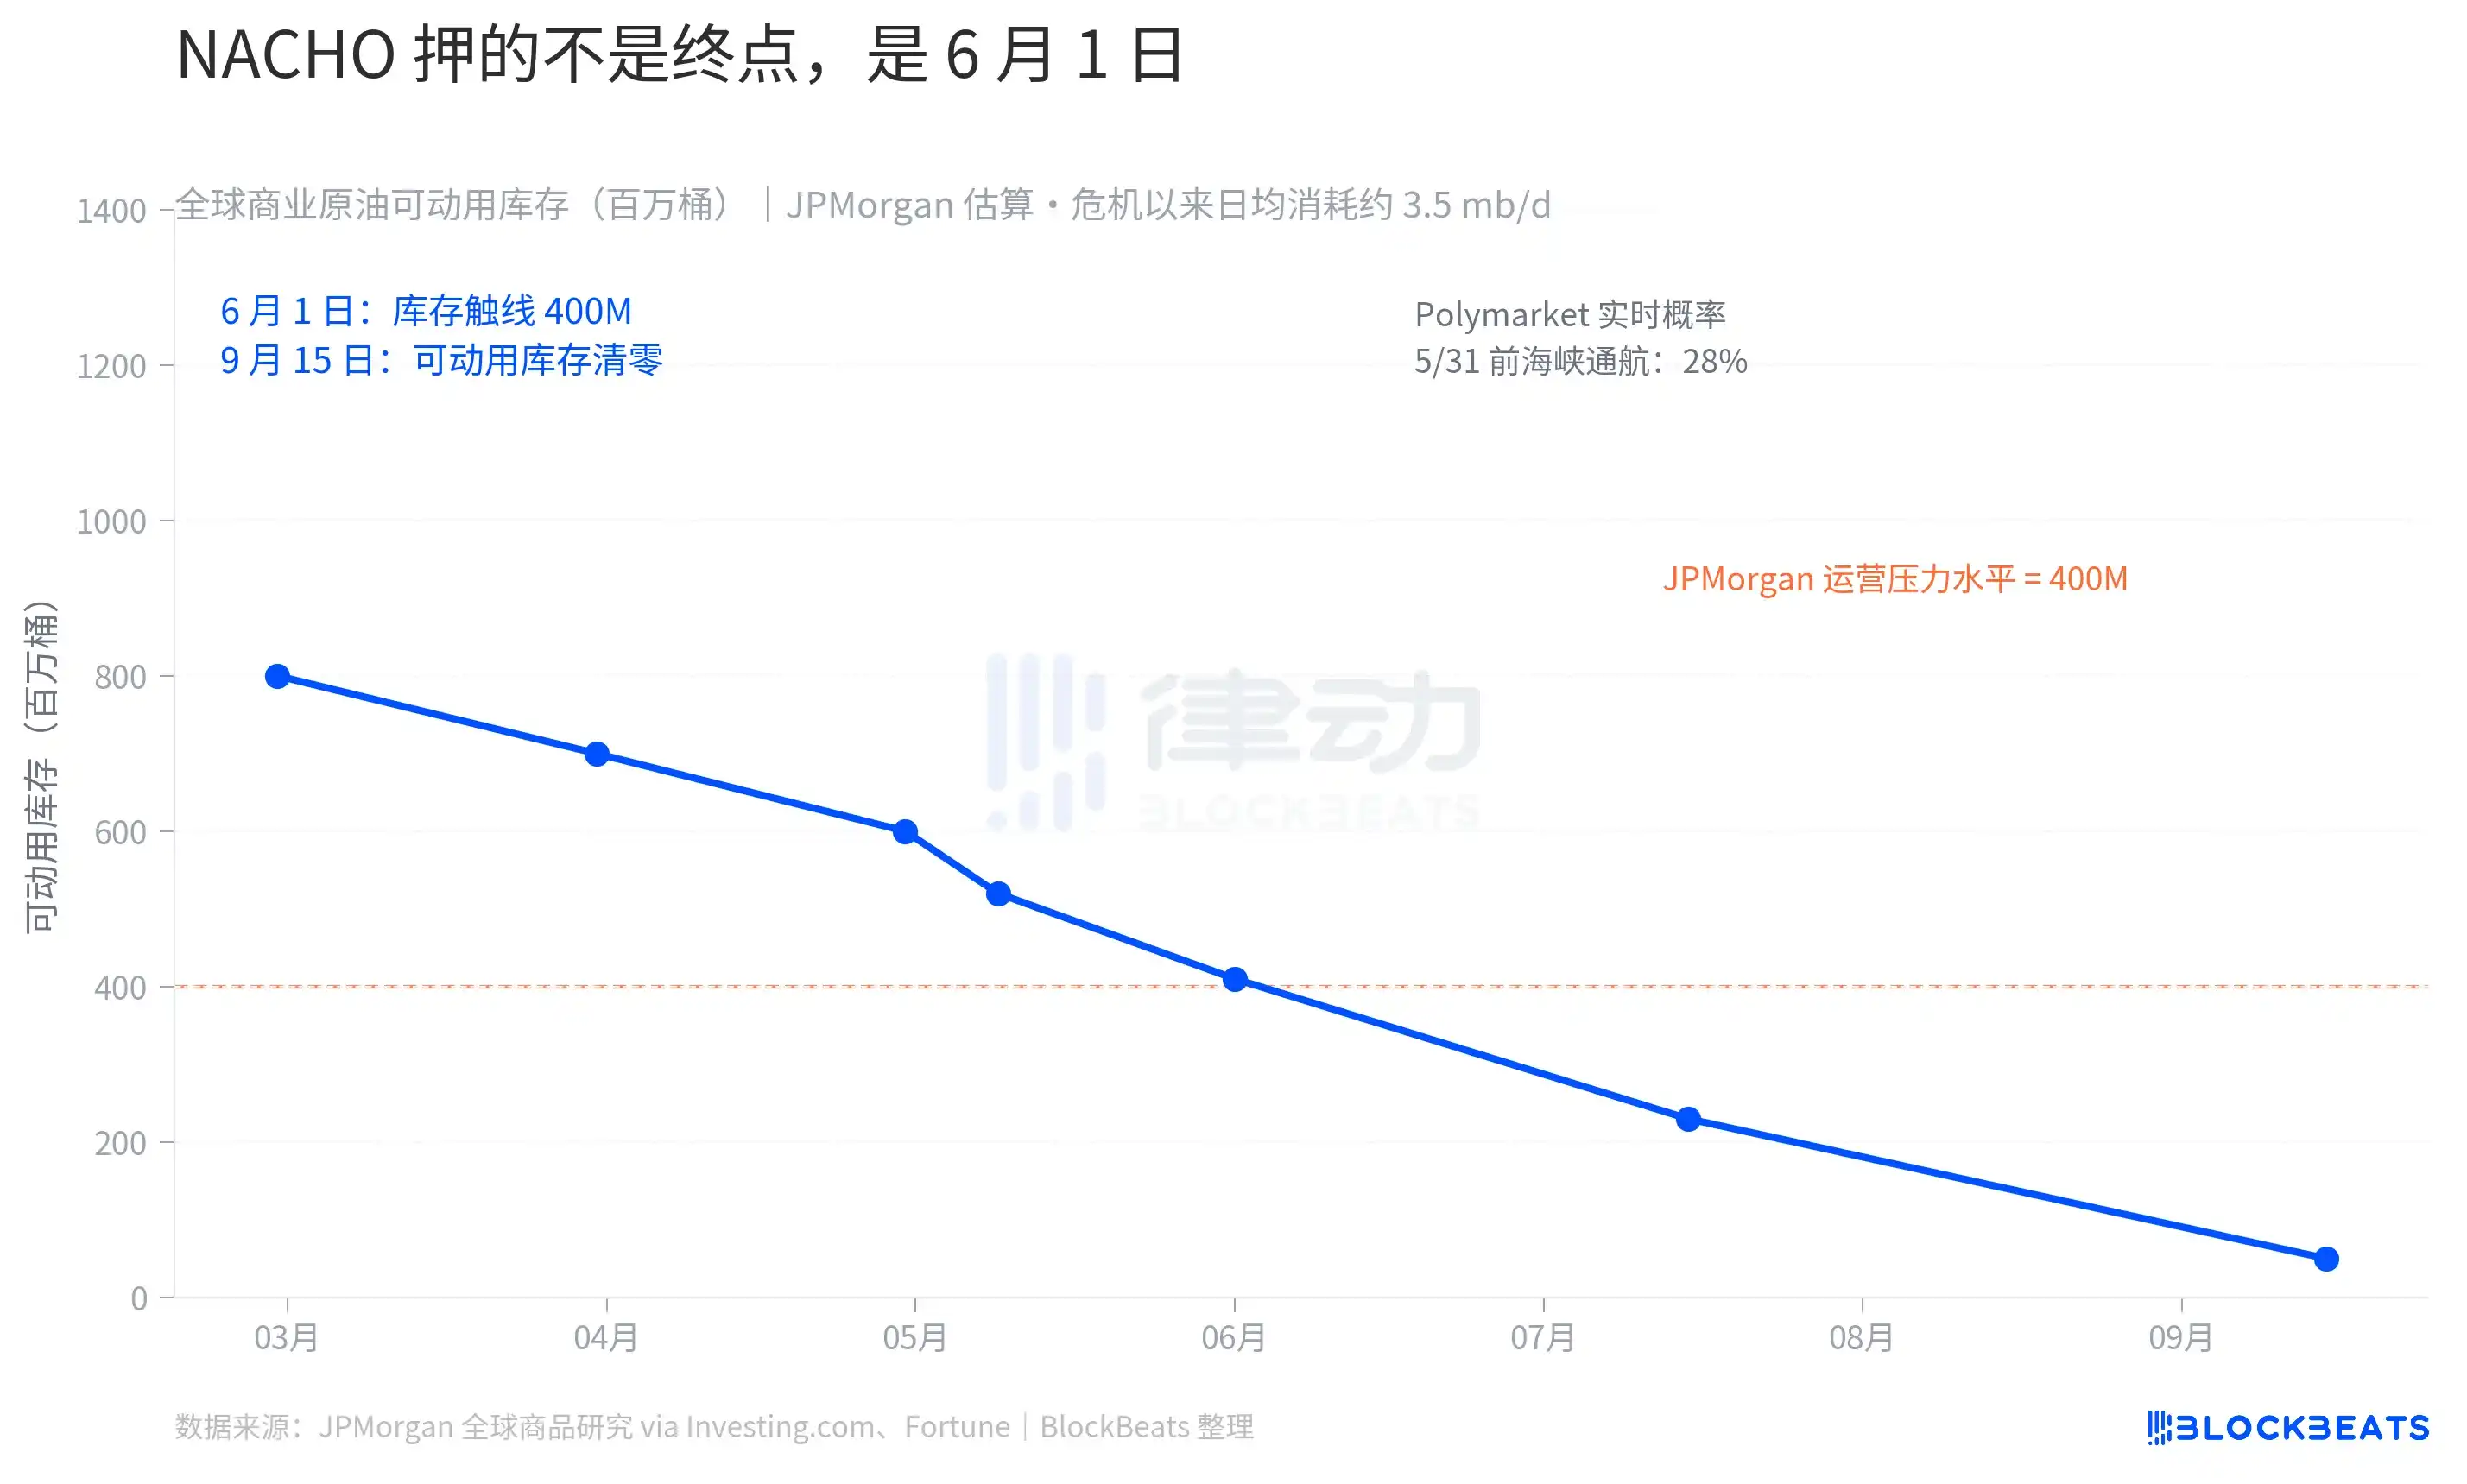
The market's prediction of odds is synchronized with the physical clock. According to Polymarket data on May 9, the probability of "Strait of Hormuz open for normal traffic by May 31" is 28%, and the probability before May 15 is only 2%. $9.92 million in active positions on that market are betting that NACHO will not fail, at least through May.

The market is no longer trading Trump's next Truth Social post; it's trading the early June inventory data for the Strait of Hormuz.

Related Questions

QWhat does the acronym NACHO stand for, and what market trend does it represent?

ANACHO stands for 'Not A Chance Hormuz Opens'. It represents a market trend where traders assume the Strait of Hormuz will remain closed for an extended period, leading to sustained high oil prices and a decoupling of oil and equity market movements.

QWhy did the TACO trading pattern fail around March 23rd according to the article?

AThe TACO ('Trump Always Chickens Out') pattern failed because Trump's claim of constructive dialogue with Iran on March 23rd, which initially calmed markets, was denied by Iran. This showed that a one-sided 'chicken out' was no longer effective when the opposing party did not cooperate, turning the retreat into a perceived market manipulation.

QHow are the oil futures market and the Federal Reserve interest rate market pricing in the NACHO scenario?

AThe oil futures market shows a steeply inverted curve with near-term prices (e.g., Jun-26 at ~$98) much higher than long-term futures (e.g., Dec-30 at ~$70), pricing in a prolonged but ultimately temporary supply disruption. Simultaneously, the interest rate market has priced out all expected Federal Reserve rate cuts for 2026, reflecting expectations that high energy prices will keep inflationary pressure persistent.

QWhich sectors are winning and losing under the NACHO market regime, and why?

AThe energy sector (ETF: XLE) is a clear winner, up over 31% year-to-date, benefiting directly from high oil prices. The transportation sector (ETF: IYT) is a significant loser, up only about 8.7%, as its operating costs are heavily tied to fuel prices, which erodes profits despite the broader market rally.

QWhat is the key physical constraint or deadline that defines the NACHO trade's timeframe?

AThe key physical constraint is global commercial oil inventory levels. According to the article, JPMorgan estimates that 'operationally available' crude stocks could approach critical 'operational pressure levels' by early June. If the Strait of Hormuz remains closed, the system risks breaching its minimum operational inventory floor, making the NACHO trade's viability closely tied to this inventory clock.

Related Reads

Will the Next Crypto Bull Run Start with On-Chain Trading of SpaceX?

This article presents a scenario-based forecast for the crypto industry from 2026 to 2029, arguing that the next major cycle will be driven not by technological narratives but by legal access to real-world assets. The author predicts that by mid-2026, pre-IPO perpetual contracts for top private companies like SpaceX, OpenAI, and Anthropic on platforms like Hyperliquid will become the primary gateway for accessing quality assets, as most crypto-native tokens fail to capture real value. The much-hyped AI x Crypto intersection largely fails except for prediction markets, which thrive on betting on AI model supremacy. By 2027, public blockchain foundations are forced to choose between catering to retail speculation or building compliant infrastructure for institutions, with many opting for the latter. Growth in stablecoins and tokenized private credit/equity hits a "triple ceiling" due to regulatory and political uncertainty rather than market demand. The pivotal shift is forecast for 2028. A major liquidation event in pre-IPO perpetuals exposes the structural flaw of synthetic markets lacking a real underlying asset anchor. In response, regulatory changes finally allow the public solicitation of private securities resales to verified accredited investors. This creates a legitimate secondary market for real company equity, which then becomes the core asset class of the new bull market, relegating synthetic perps to a niche role. By 2029, the industry becomes "boring" but foundational. Tokens without claims on real cash flows or assets cease trading. Stablecoin growth is steady but politically capped. Crypto infrastructure fades from view as it gets absorbed into traditional finance backends. The article's central thesis is that the key bottleneck for crypto's next phase is legal and regulatory channels for real asset ownership, not technology.

marsbit31m ago

Will the Next Crypto Bull Run Start with On-Chain Trading of SpaceX?

marsbit31m ago

The Value Distribution of Stablecoins

**Summary: The Value Distribution of Stablecoins** The article argues that stablecoins are evolving from mere trading tools into broader channels for dollar access. It divides the stablecoin ecosystem into four layers to analyze how value is distributed: 1. **Issuance Layer:** Mints stablecoins, holds reserve assets, and captures the spread between reserve yield and user costs (e.g., Tether, Circle). This layer currently earns the largest profit margin. 2. **Infrastructure Layer:** Connects stablecoins to the traditional financial system, handling fiat on/off-ramps, banking integration, compliance (KYC/AML), and asset management (e.g., Bridge, BVNK). This is the "unglamorous" but critical work, building the essential bridges between crypto and real-world finance. 3. **Acquiring/Distribution Layer:** Integrates stablecoins into merchant systems, manages payment flows, and provides enterprise financial software (e.g., Stripe, Coinbase). They act as the access point for businesses. 4. **Application Layer:** The end-users and businesses that ultimately use stablecoins for payments, settlements, or as a store of value. They benefit from convenience but have little pricing power. The core thesis is that while the issuance layer currently dominates profits, the often-overlooked **infrastructure layer holds significant long-term potential**. The real challenge and barrier to mass adoption is not the on-chain transfer of stablecoins (which is simple), but the complex "last mile" integration into existing business workflows, banking systems, and regulatory frameworks across different countries. Companies in this layer are currently in a "land grab" phase, investing heavily to build networks, secure bank partnerships, and establish compliance pathways. While their position is currently pressured by the profitable issuers above and distribution platforms below, the article suggests that if stablecoins become a default financial rail for businesses, the infrastructure providers who have done the hard work of integration will ultimately gain strong pricing power and become entrenched, essential players.

marsbit7h ago

The Value Distribution of Stablecoins

marsbit7h ago

The Value Distribution of Stablecoins

The Value Distribution of Stablecoins The article argues that stablecoins are evolving from a mere trading tool into a broad "dollar channel." It analyzes the industry's value chain through four layers: 1. **Issuance Layer (e.g., Tether, Circle):** The top layer that mints stablecoins, holds reserve assets, and captures the thickest interest rate spread. 2. **Infrastructure Layer (e.g., Bridge, BVNK):** Connects stablecoins to the traditional financial system, handling critical but complex "dirty work" like fiat on/off-ramps, banking integration, compliance (KYC/AML), and cross-border settlement. 3. **Acquiring/Distribution Layer (e.g., Stripe, Coinbase):** Embeds stablecoins into merchant systems, manages payment flows, and integrates with enterprise software. 4. **Application Layer:** End-users and businesses that ultimately use stablecoins for payments, settlement, or storing value. The author posits that while the issuance layer currently captures the most profit, the most overlooked and potentially critical layer is infrastructure. The core challenge for stablecoin adoption isn't the on-chain transfer (which is simple), but bridging the gap between blockchain and the real-world financial system. This involves solving practical problems for businesses: fiat conversion, reconciliation, tax handling, and user onboarding. Infrastructure companies are currently in a difficult "land-grab" phase—building networks, securing banking relationships, and achieving compliance country-by-country. They face pressure from both the profitable issuance layer above and distribution platforms below. However, the author suggests this layer is building a crucial moat. Once stablecoins become a default business rail, the infrastructure players who have done the hard work of integration may gain significant, durable value and pricing power.

链捕手7h ago

The Value Distribution of Stablecoins

链捕手7h ago

Trading

Spot
Futures
活动图片