Stocks slide while crypto steadies — is market correlation starting to break?

ambcryptoPublished on 2026-03-31Last updated on 2026-03-31

Abstract

Stocks are undergoing a controlled correction with the S&P 500 trending lower amid cooling risk appetite, while the crypto market has stabilized and entered a consolidation phase instead of continuing its decline. This divergence suggests a potential short-term loosening of the historically strong correlation between the two asset classes. Although both remain influenced by broader macroeconomic conditions, equities are currently pricing in uncertainty through a gradual pullback, whereas crypto may have already absorbed significant risk during its earlier drop. The current price action indicates a period of positioning rather than strong directional momentum in crypto markets.

A divergence is emerging between traditional equities and the crypto market, with recent price action suggesting a subtle shift in how both asset classes are responding to broader macro conditions.

The S&P 500 has entered a corrective phase, trending lower from its recent highs amid building selling pressure across major sectors.

In contrast, the broader crypto market — measured by total market capitalization excluding stablecoins — has entered a period of consolidation rather than continuing its earlier decline.

Equities show signs of a controlled correction

The S&P 500’s recent structure reflects a gradual deterioration in momentum, with a series of lower highs and lower lows forming since late February.

While the pullback has not yet turned disorderly, the trend indicates a cooling of risk appetite in traditional markets.

Momentum indicators such as the Relative Strength Index [RSI] have also declined toward neutral levels after previously signaling overbought conditions.

Source: TradingView

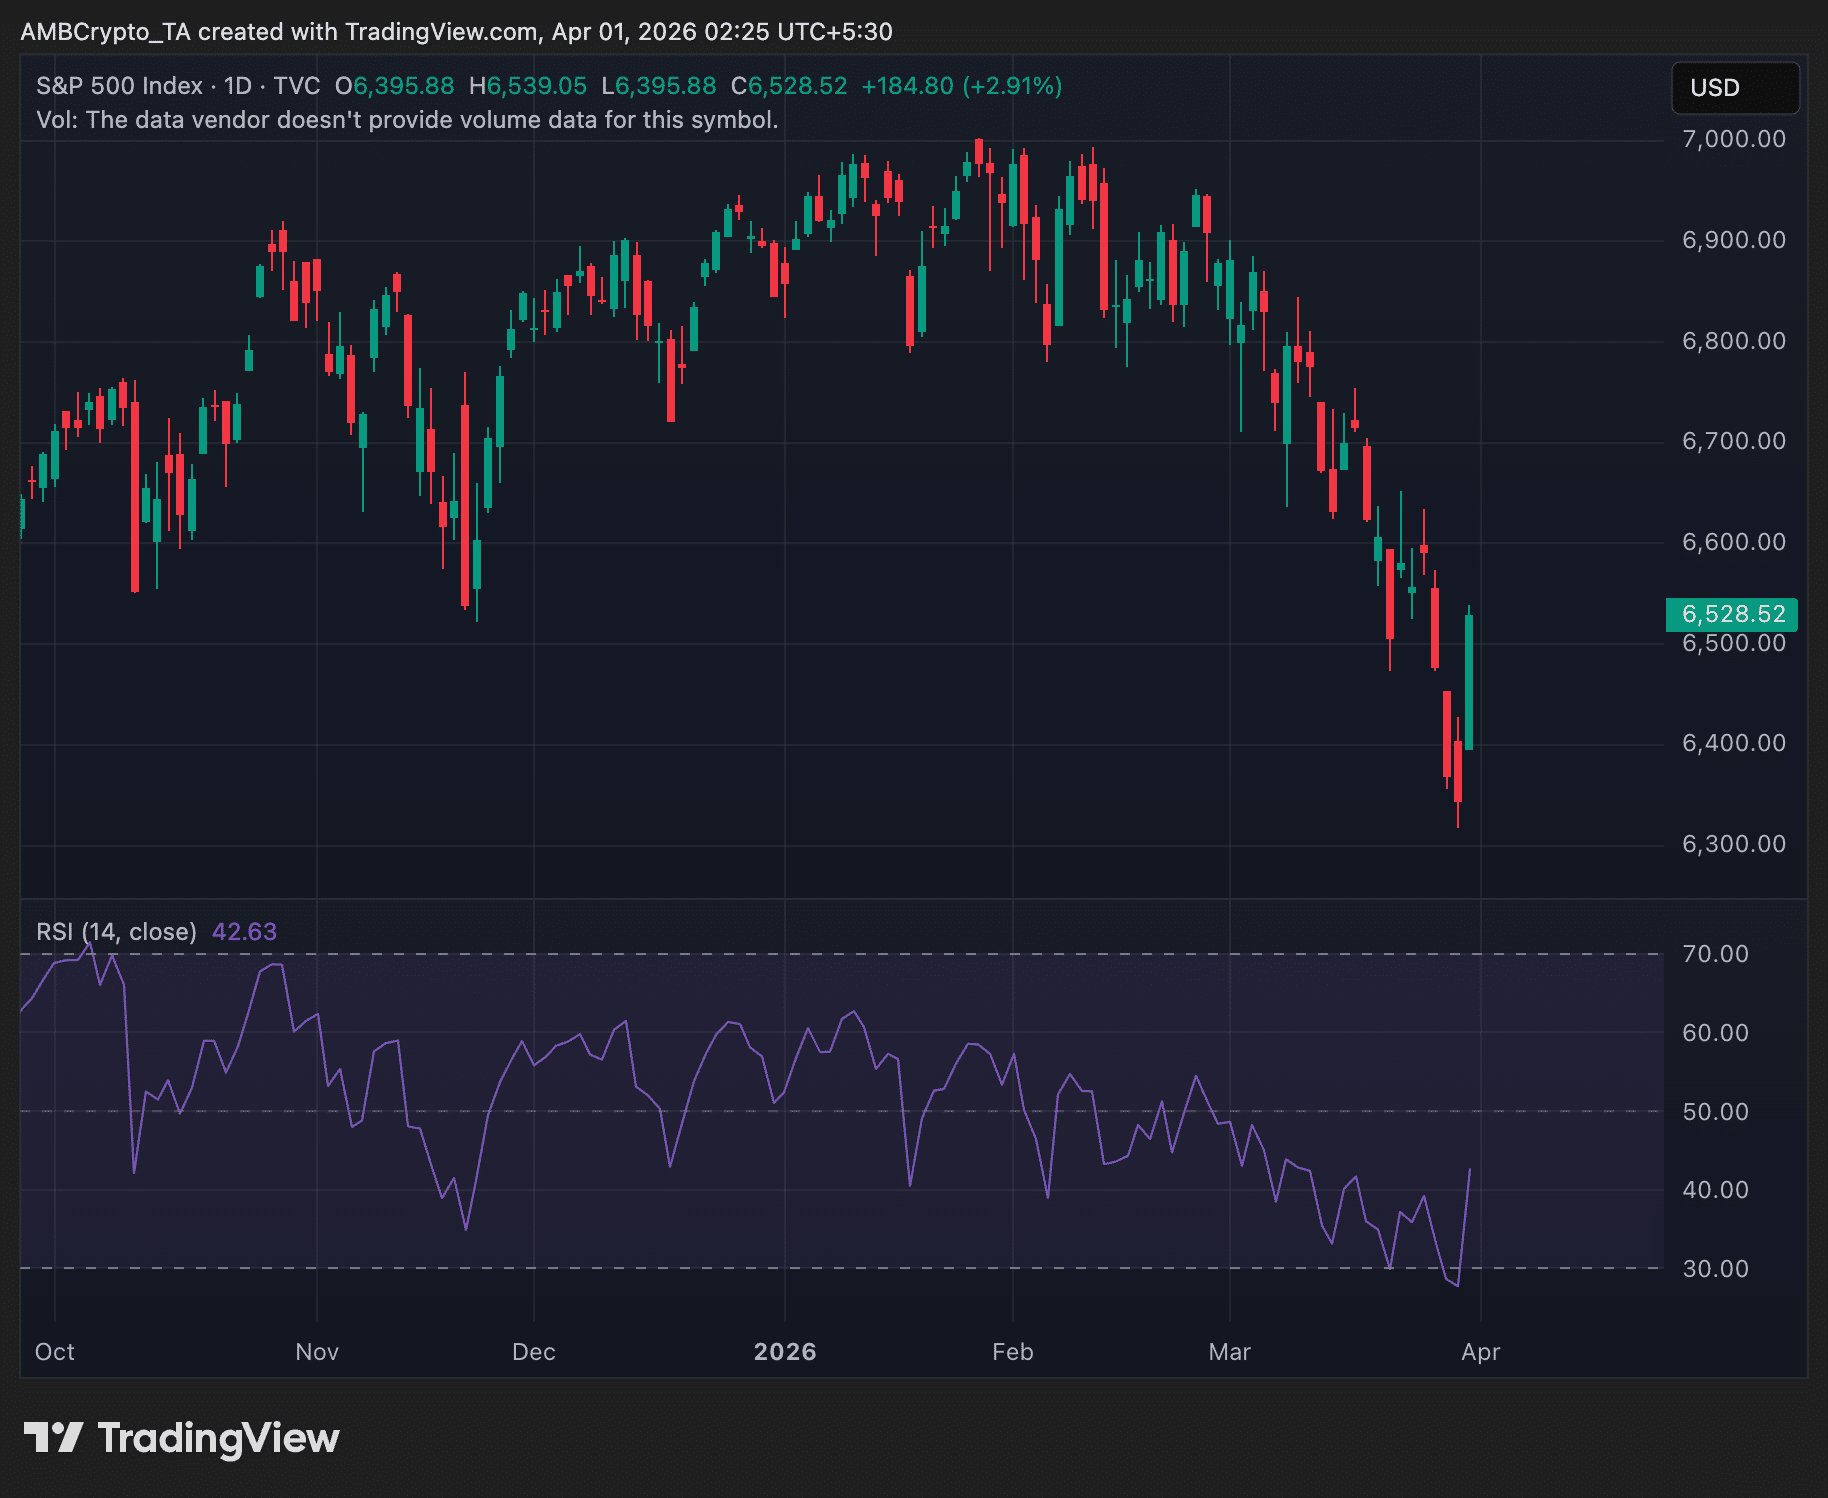
As of this writing, it was trading up almost 3% to over $6,500. However, the trend suggests that equities are undergoing a controlled reset, rather than a sharp risk-off event.

Crypto market stabilizes after sharp drop

In contrast, crypto markets appear to be entering a holding pattern. As of this writing, the market capitalization was around 2.03 trillion, up over 2% in the last 24 hours.

Source: TradingView

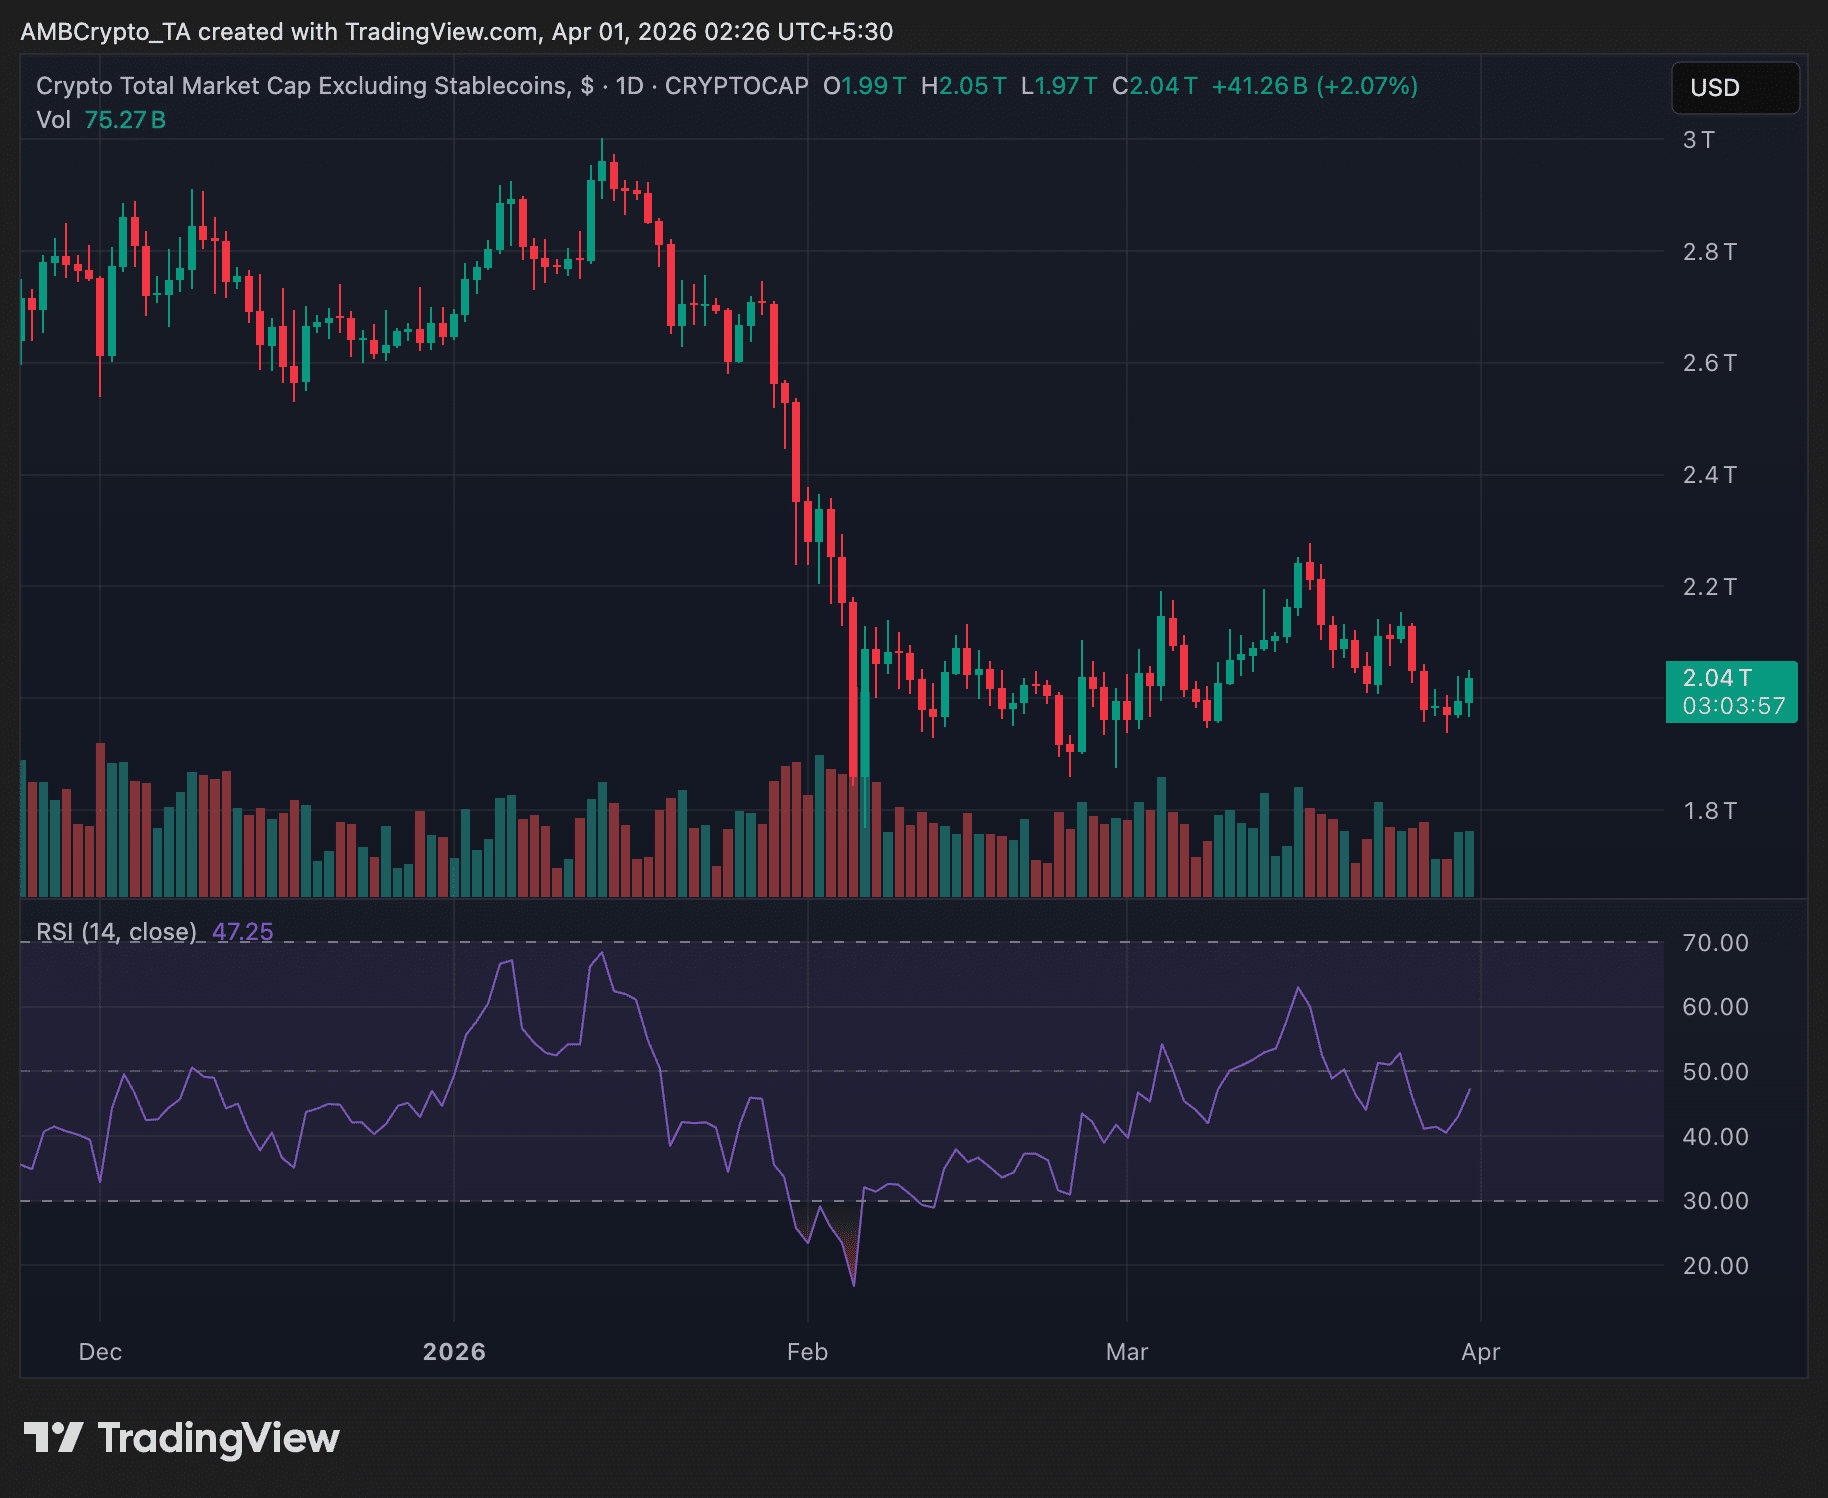
After a steep decline earlier in the quarter, total crypto market capitalization has largely stabilized within a defined range. Price action has remained contained between key support and resistance zones, while RSI readings hover near neutral levels.

This lack of follow-through selling indicates that downside momentum has weakened, with the market neither committing to a recovery nor extending its decline.

A subtle shift in correlation dynamics

Historically, crypto has behaved as a high-beta extension of equities, often amplifying moves seen in traditional markets.

However, the current setup presents a more nuanced picture. While equities continue to trend downward, crypto markets have not mirrored the move with equivalent intensity. Instead, they have transitioned into sideways consolidation.

This divergence may signal a loosening of the correlation, at least in the short term.

What this means for market structure

The divergence does not necessarily imply that crypto is immune to broader macro pressures. Instead, it suggests that markets may be in different phases of adjustment.

Equities are pricing in macro uncertainty through a steady correction, while crypto markets may have already absorbed a significant portion of that risk during earlier declines.

As a result, current price action in crypto could reflect a phase of positioning and balance rather than directional conviction.


Final Summary

  • Equities are trending lower in a controlled correction, while crypto markets are consolidating rather than extending losses.
  • The divergence suggests a potential short-term loosening of correlation, though both markets remain influenced by broader macro conditions.

Related Questions

QWhat is the main divergence observed between traditional equities and the crypto market according to the article?

AThe main divergence is that traditional equities (like the S&P 500) are trending lower in a controlled correction, while the crypto market has entered a period of consolidation and stabilization instead of continuing its decline.

QWhat does the current price action in the crypto market suggest about its downside momentum?

AThe current price action, characterized by consolidation within a defined range and RSI readings near neutral levels, suggests that the downside momentum has weakened significantly.

QHow has the historical correlation between crypto and equities potentially changed based on recent activity?

AThe recent activity suggests a potential short-term loosening of the correlation. Crypto is not mirroring the equity market's downward trend with equivalent intensity but is instead moving sideways, indicating a more nuanced relationship.

QWhat is the article's explanation for why crypto markets might be stabilizing while equities correct?

AThe article suggests that crypto markets may have already absorbed a significant portion of the macro risk during their earlier steep declines, and are now in a phase of positioning and balance rather than directional conviction.

QWhat key technical indicator is mentioned as having declined toward neutral levels for the S&P 500?

AThe Relative Strength Index (RSI) is mentioned as having declined toward neutral levels for the S&P 500 after previously signaling overbought conditions.

Related Reads

UBS: The Crowdedness of A-Share Tech Stocks Is Far From Reaching Historical Peaks

UBS: A-share tech stocks still far from peak crowding levels A-shares' technology sector has seen a strong rebound, with trading activity hitting record highs, raising concerns about market crowding. However, UBS Securities argues that a key indicator of institutional positioning suggests the current crowding level remains well below historical peaks. While the large-cap tech sector's share of total A-share trading volume and market capitalization have reached historical highs, the overweight ratio of domestic mutual funds in this sector stood at 9.9% in Q1 2026. This is down from 11.6% in Q3 2025 and significantly lower than the historical peak of 14.1% in Q4 2015. It also pales in comparison to the historical peak overweight of 18.7% for the consumer sector. UBS notes that typical cycles from a low to a peak in fund overweighting last about three years, and the current outperformance of the tech/growth style has lasted less than two years since the policy pivot in September 2024. UBS expects A-share earnings recovery to accelerate, providing fundamental support. It forecasts 2026 A-share profit growth to rise to 11% from 3.9% in 2025. Non-financial A-share profits grew 11.8% YoY in Q1 2026, with gross and net profit margins at their highest since 2023. Persistent fund inflows, the expansion of thematic ETFs, and a recovery in private fund issuance are supporting market liquidity. In tactical allocation, UBS favors growth and cyclical styles under its "slow bull" base case, with overweight ratings on six sectors: Electronics (benefiting from semiconductor inventory recovery and AI innovation), Communications (driven by AI computing demand), Machinery (aided by domestic capex recovery), Non-ferrous Metals (due to rising copper/aluminum prices), Chemicals (supported by anti-involution policies), and Electrical Equipment (driven by policy support and AI data center power demand).

marsbit31m ago

UBS: The Crowdedness of A-Share Tech Stocks Is Far From Reaching Historical Peaks

marsbit31m ago

Trading

Spot
Futures
活动图片