Stable tests $0.025 support – Can it reach $0.039 next?

ambcryptoPublished on 2026-03-25Last updated on 2026-03-25

Abstract

Stable token gained 10% in 24 hours, testing a key support level at $0.025. While trading above the 20-day EMA suggests short-term bullish momentum, it remains below the 50-day EMA, indicating resistance. A break above the 50-day EMA could confirm a trend continuation toward the next target of $0.039. Momentum indicators like the Stochastic RSI show a potential reversal from oversold conditions. Funding rates suggest undervaluation, leaving room for upside. On-chain data shows a steady increase in holders to 6.2k and a flattening circulating supply, supporting long-term stability. The key level to watch remains $0.025 for sustained bullish momentum.

Momentum returned to the market over the last 24 hours, with Stable among the notable movers.

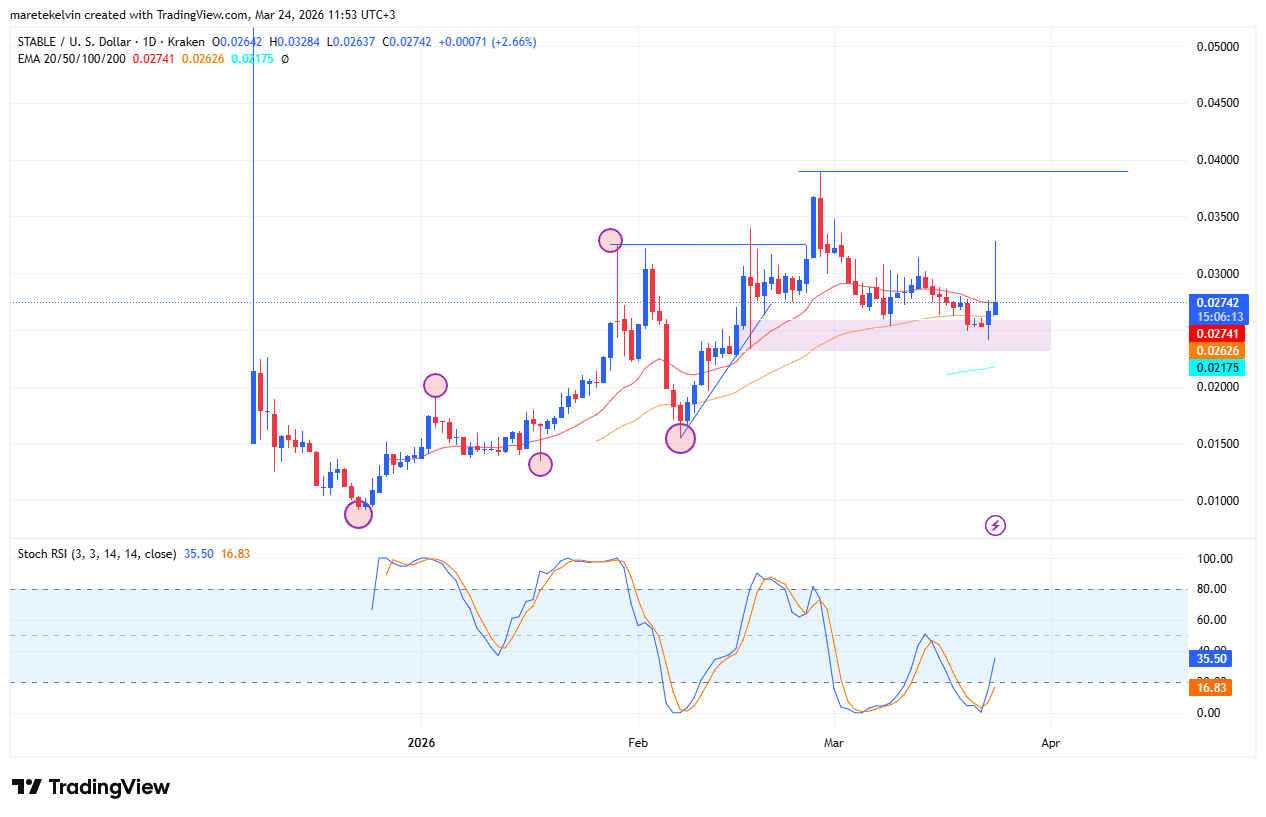
The token recorded a 10% daily gain. At press time, it tested a key demand zone near $0.025. That level stood as a key decision point for traders and investors.

The daily chart reflected a tug-of-war between buyers and sellers.

Stable traded above the 20-day EMA, indicating short-term bullish strength. However, it remained below the 50-day EMA.

This positioning suggested overhead resistance was still capped upside.

A sustained move above the 50-day EMA could confirm trend continuation. Even so, failure to break higher may extend consolidation.
Source: TradingView

Momentum hints at a reversal

Momentum indicators began shifting.

The Stochastic RSI bounced from the oversold region, signaling a possible reversal. That move aligned with the price reacting at the demand zone.

In fact, the broader structure shifted three weeks ago.

Since then, the price has formed a more constructive base, with bulls gaining control. Such setups often preceded momentum expansion.

Funding Rates suggests undervaluation

Derivatives data added weight to the bullish case.

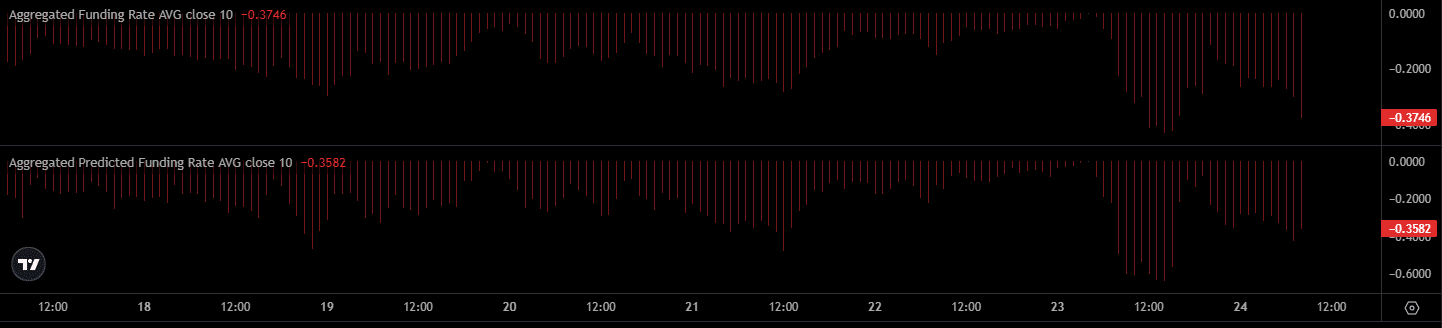
Stable Funding Rates remained below expected levels, suggesting undervaluation relative to positioning.

When Funding Rates lag rising prices, sentiment typically remained cautious. That gap often left room for further upside if confidence improved.
Source: Coinalyze

On-chain data remains steady.

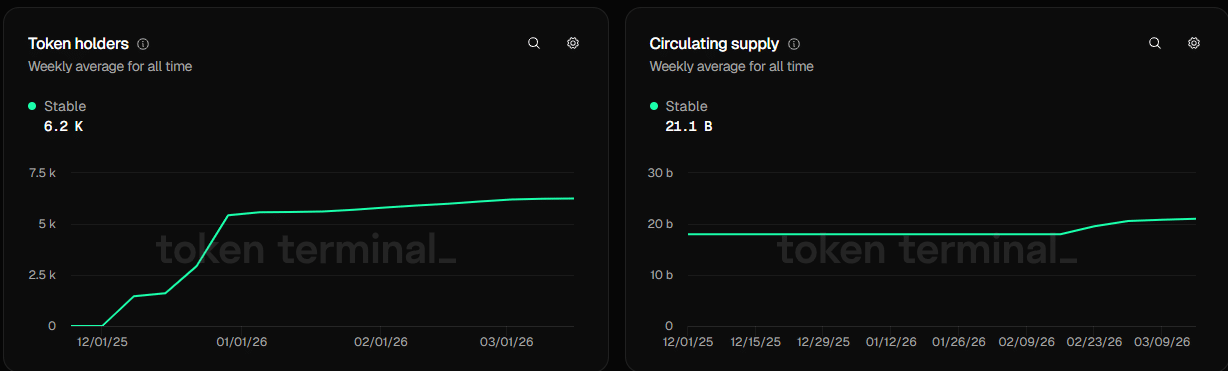
The number of Stable token holders has been gradually increasing over time. This trend highlights consistent accumulation.

From past observations, rising holder count often reflected a growing network confidence. The surge also supports long-term price stability as more investors are playing the long game.

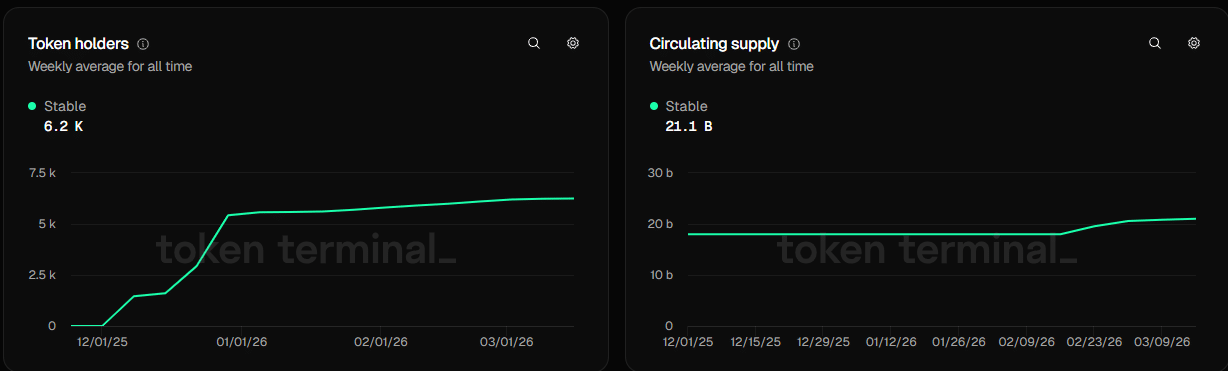
The holder’s behaviour goes hand in hand with the stale supply. Stable circulating supply has also flattened, presenting a net demand surge given the recent holders surge.

At press time, the networks had 6.2k holders and the circulating supply amounted to 21.1 billion.
Source: Token Terminal

$0.039 emerges as the next key target

Attention now shifted to the next resistance.

If momentum held, the next key level stood near $0.039, marking a liquidity zone.

A break above this level could signal further upside. However, failure to hold gains may delay the move and extend consolidation.

As it stood, $0.025 remained the key support to watch.


Final Summary

  • Stable gained 10% and tested a key demand zone near $0.025. Price held above the 20-day EMA but faced resistance below the 50-day EMA.
  • Holder count rose to 6.2k while supply flattened, signaling steady accumulation.

Related Questions

QWhat is the current key support level for Stable token mentioned in the article?

AThe current key support level for Stable token is $0.025.

QWhat does the Stochastic RSI bouncing from the oversold region signal for the Stable token?

AIt signals a possible price reversal.

QWhat does the article suggest about Stable's Funding Rates and its implication?

AThe Funding Rates remained below expected levels, suggesting the token is undervalued and may have room for further upside if confidence improves.

QWhat on-chain metric is provided as evidence of growing network confidence and long-term stability?

AThe gradual increase in the number of token holders, which reached 6.2k, along with a flattening circulating supply.

QWhat is the next key resistance target for Stable token if the current momentum holds?

AThe next key resistance target is $0.039.

Related Reads

Bitcoin Boom in Full Swing: Saylor's Latest Statement Fuels Buying Speculation

MicroStrategy's Executive Chairman Michael Saylor has fueled speculation about a new Bitcoin purchase by posting "Bitcoin Drive engaged" on August 2, accompanied by the company's customary purchase tracker. This aligns with his pattern of hinting at treasury changes ahead of weekly reports. The accompanying report showed MicroStrategy's Bitcoin holdings at 843,775 BTC, with an average cost of $75,653 per coin and an unrealized loss of -$10.58B. A similar signal preceded the company's July 27 announcement, strengthening expectations for a treasury update on Monday. However, MicroStrategy's real-time ledger reflects two recent Bitcoin sales totaling 3,588 BTC, reducing holdings from 847,363 BTC to the current 843,775 BTC. The company stated these sales funded preferred stock dividends and replenished its U.S. dollar reserve. Recent reports indicate the company made no Bitcoin purchases the week ending July 26 while increasing its dollar reserve to approximately $3.75B. The company faces financial headwinds after reporting an $8.33B operating loss for Q2 2026, including an $8.32B unrealized loss on its digital assets. Management may sell up to $1.25B more in Bitcoin to meet cash obligations. The expected Monday update will reveal if the "Bitcoin Drive" signal marks a return to accumulation as MicroStrategy balances its massive Bitcoin stash against growing cash commitments.

cryptonews.ru2h ago

Bitcoin Boom in Full Swing: Saylor's Latest Statement Fuels Buying Speculation

cryptonews.ru2h ago

Trading

Spot
活动图片





