Soaring Oil Prices No Longer Drive Up Interest Rates, What Is the Market Afraid Of?

marsbitPublished on 2026-03-31Last updated on 2026-03-31

Abstract

Oil prices surged nearly 60% in March 2026—the steepest monthly rise since Brent crude's inception in 1988—after the Strait of Hormuz closed, cutting off 17.8 million barrels per day of oil flow. Historically, such spikes pushed inflation expectations and bond yields higher, but this time, the 10-year Treasury yield fell sharply from 4.44% to 3.92% in late March, signaling a decoupling. This divergence reflects a market shift: growth risks now outweigh inflation concerns. Bond markets are betting on recession rather than persistent inflation. Historical oil shocks—like those in 1973, 1979, 1990, and 2008—often preceded economic downturns. The sole exception was the 2022 spike, which triggered severe inflation instead. Market expectations pivoted rapidly. Earlier, traders anticipated rate cuts, but by late March, weak consumer confidence and manufacturing data drove bets toward Fed dovishness. Chair Powell emphasized monitoring whether the supply shock is temporary, but the bond market has already priced in recession risks. If stagflation emerges—as during 1973–1982—real assets like gold and commodities may outperform, while stocks and bonds could suffer. The 60/40 portfolio would be particularly vulnerable. Analysts project Brent could average $115–125 in April, with a peak of $150 possible if the Strait remains closed. The bond market’s verdict is clear: fear of recession dominates.

Since the closure of the Strait of Hormuz on March 2, approximately 17.8 million barrels per day of global oil flow have been cut off. In March alone, Brent crude surged nearly 60%, while WTI rose about 53%. This marks the steepest monthly gain for the Brent contract since its inception in 1988, surpassing the 46% record set during the 1990 Gulf War.

Conventionally, soaring oil prices drive up inflation expectations, and bond yields should follow suit. For most of the past two decades, oil prices and the 10-year U.S. Treasury yield have indeed been positively correlated. But this time, they moved in opposite directions.
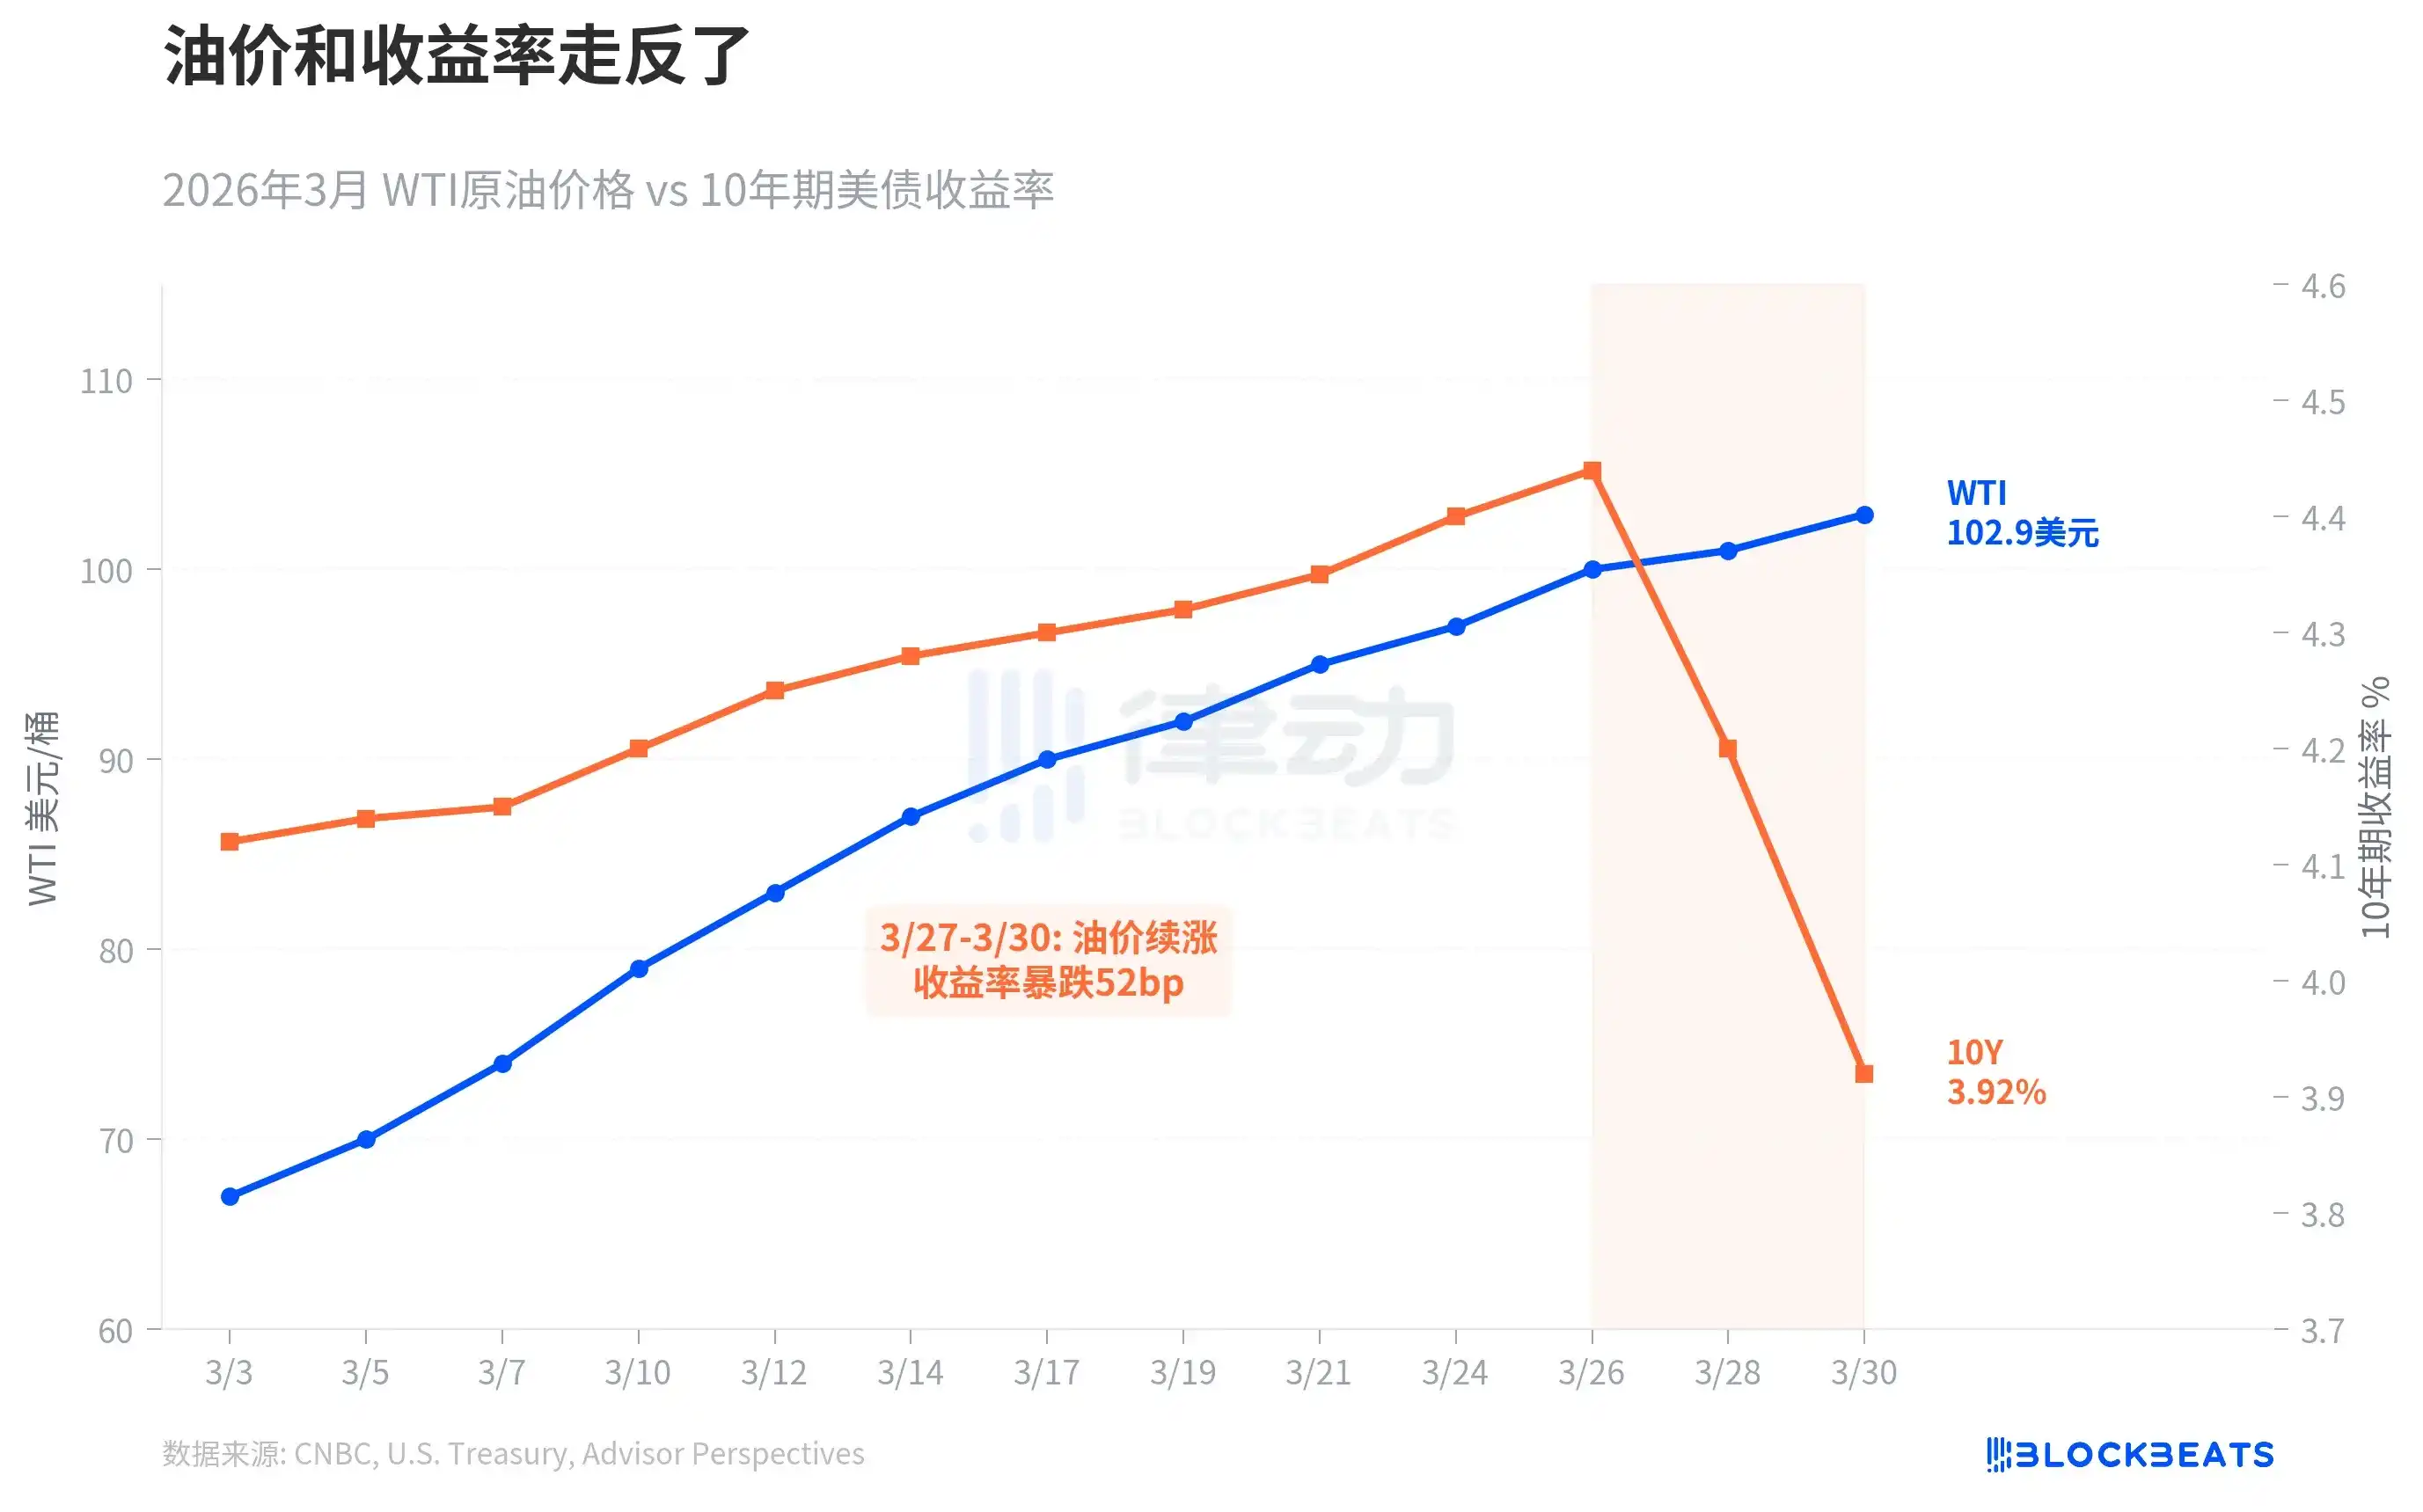
In the first three weeks of March, the two were still moving upward in sync. WTI rose from $67 to $100, while the 10-year yield climbed from 4.15% to 4.44%. The turning point occurred between March 27 and 30: oil prices continued to surge, but the yield plummeted from 4.44% to 3.92%, dropping 52 basis points in three trading sessions and breaking through the psychologically significant 4% level.

This was a classic "flight to safety," with the bond market making a judgment: growth risks have now outweighed inflation risks. As the economic firm Oxford Economics put it, "growth risks began to outweigh inflation risks." In other words, the market is not unafraid of inflation; it is more afraid of a recession.

This decoupling is not common, but whenever it occurs, the subsequent story tends to be unfavorable.
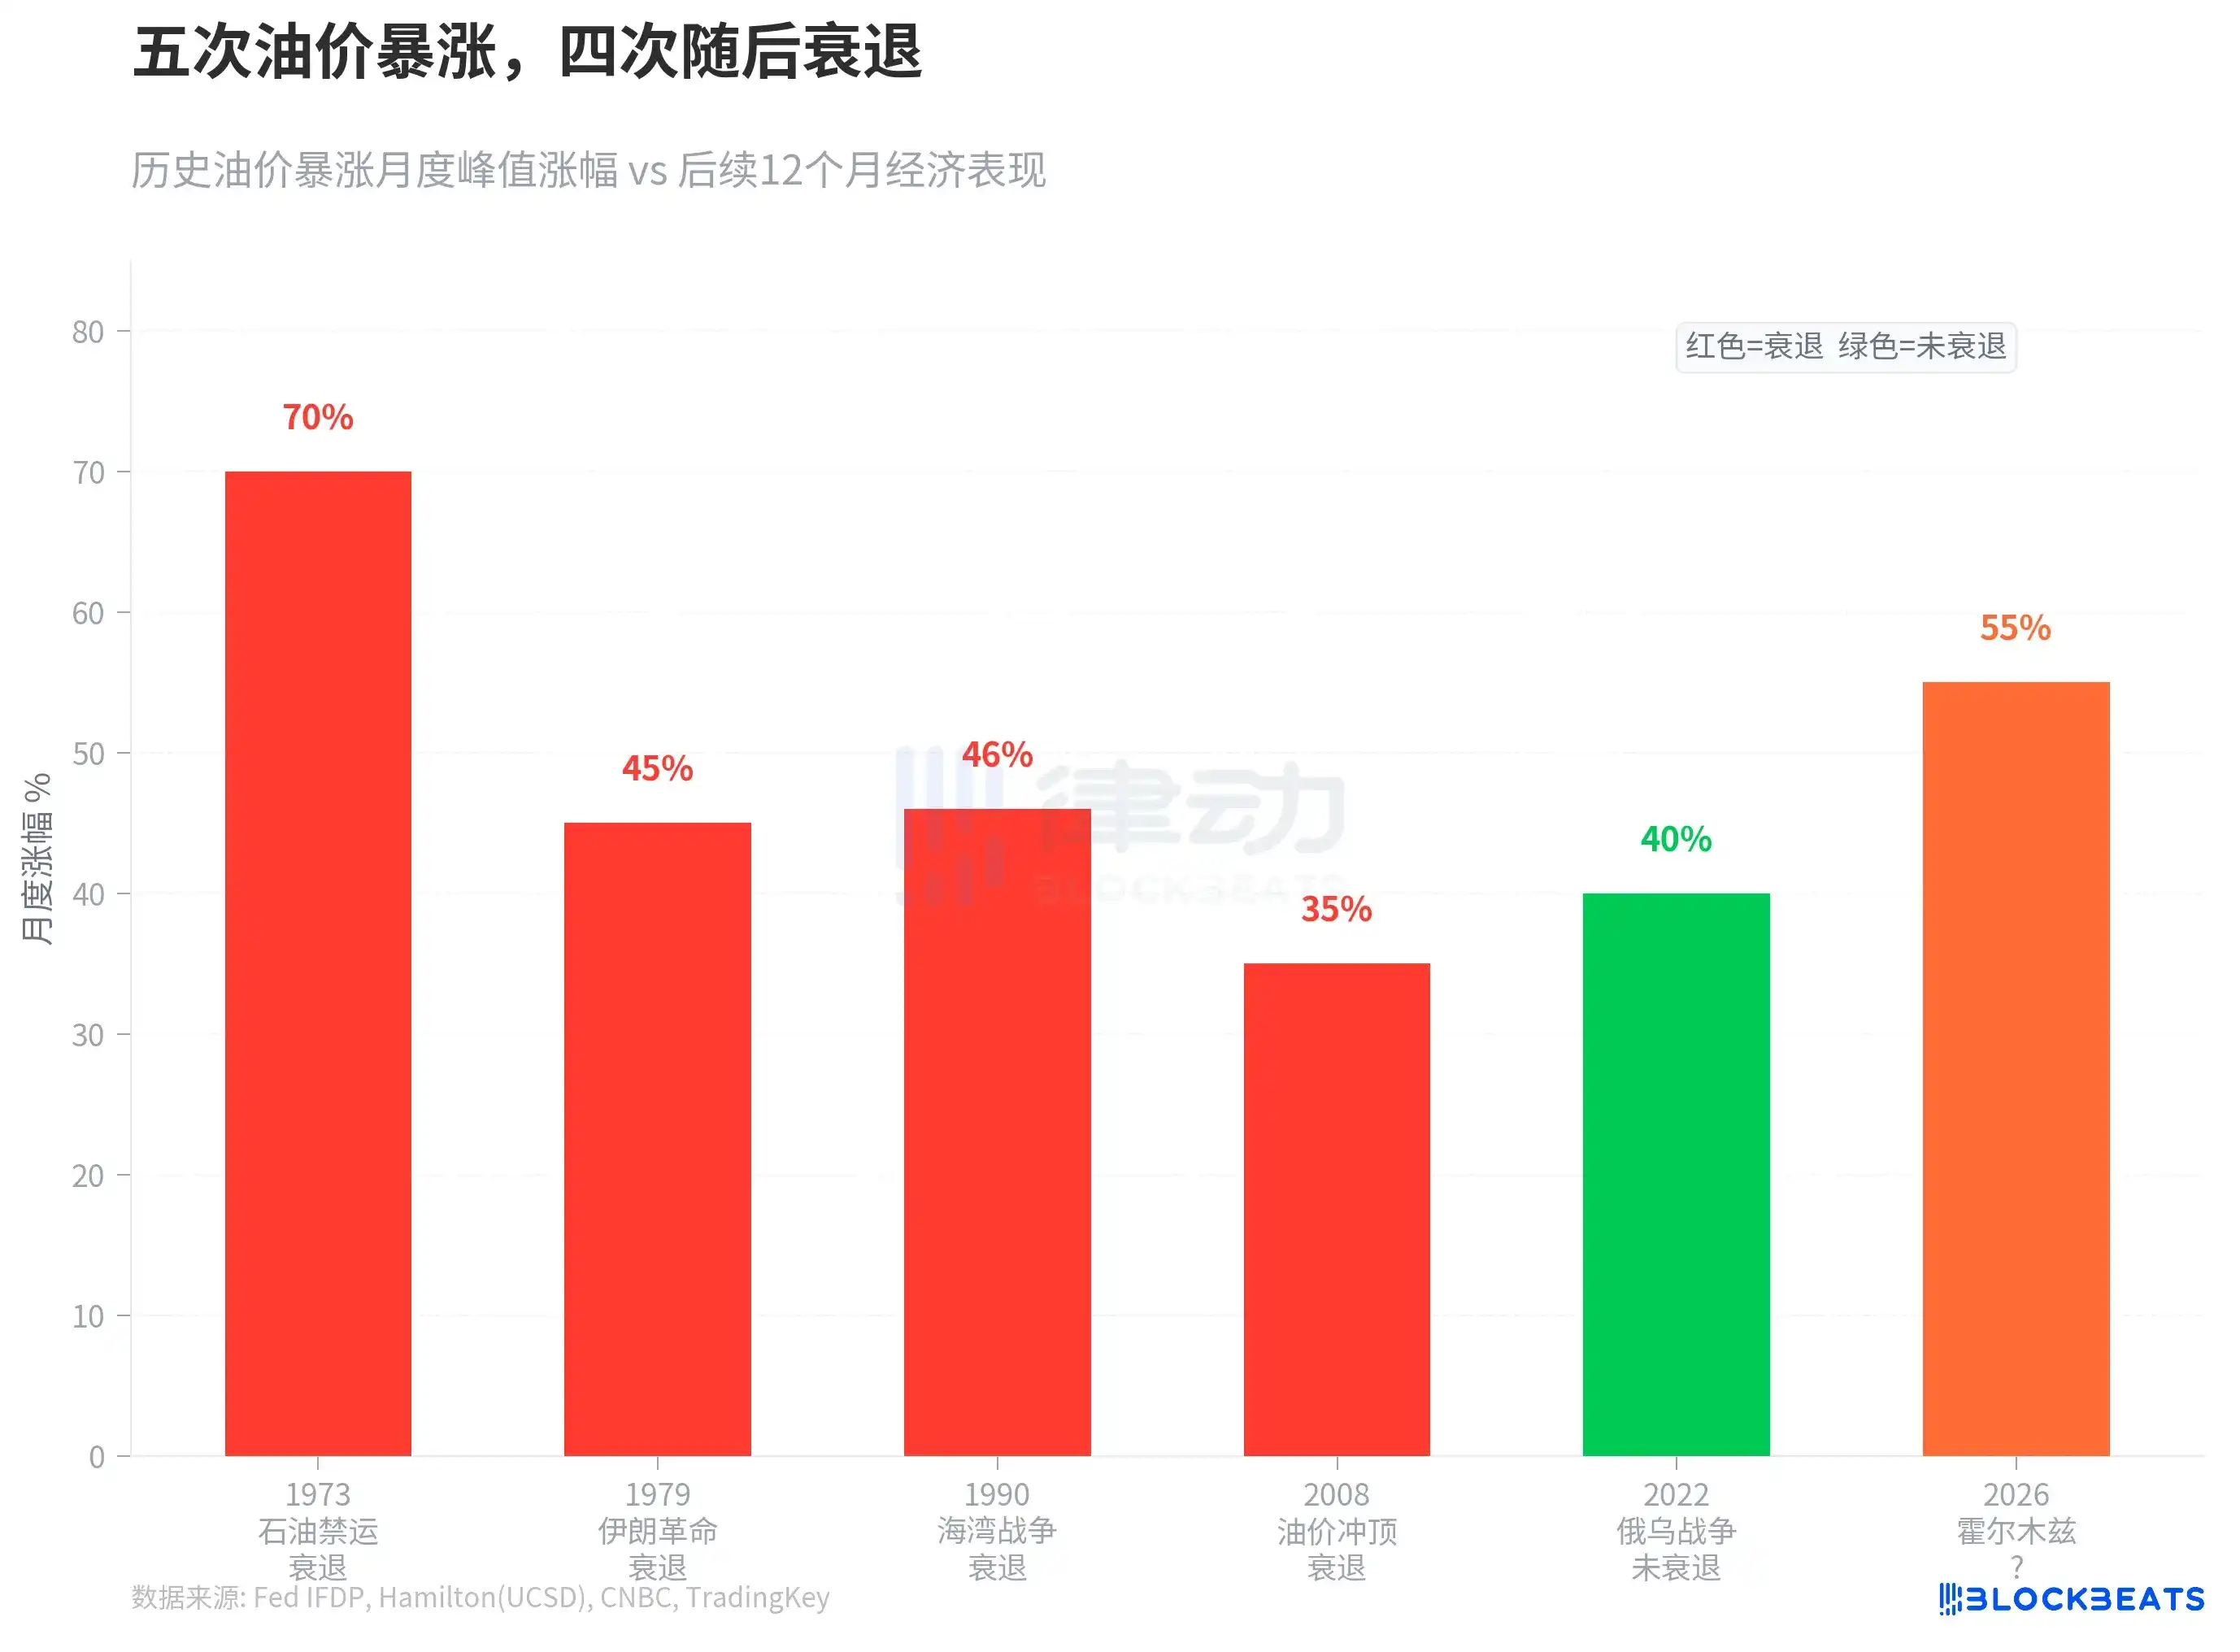
Over the past half-century, there have been five instances where oil prices surged more than 35% in a short period. During the 1973 oil embargo, U.S. GDP subsequently fell by 4.7%. The 1979 Iranian revolution caused global GDP to deviate from trend growth by 3 percentage points. The 1990 Gulf War led to a brief U.S. recession. In 2008, oil prices peaked at $147; although the primary cause of that recession was the financial crisis, the oil price shock accelerated the economic downturn. The only exception was the oil price surge driven by the 2022 Russia-Ukraine war, which did not trigger a recession but came at the cost of the most severe inflation in 40 years.

The surge in March 2026 exceeded all the above cases. According to research by Federal Reserve economist James Hamilton, there is no mechanical link between oil price shocks and recessions, but "the greater the net increase in oil prices, the more significant the suppression of consumption and investment." Goldman Sachs has raised the probability of a U.S. recession to 30%, while consulting firm EY-Parthenon puts the figure at 40%.

The market's reaction speed was also unusually fast.
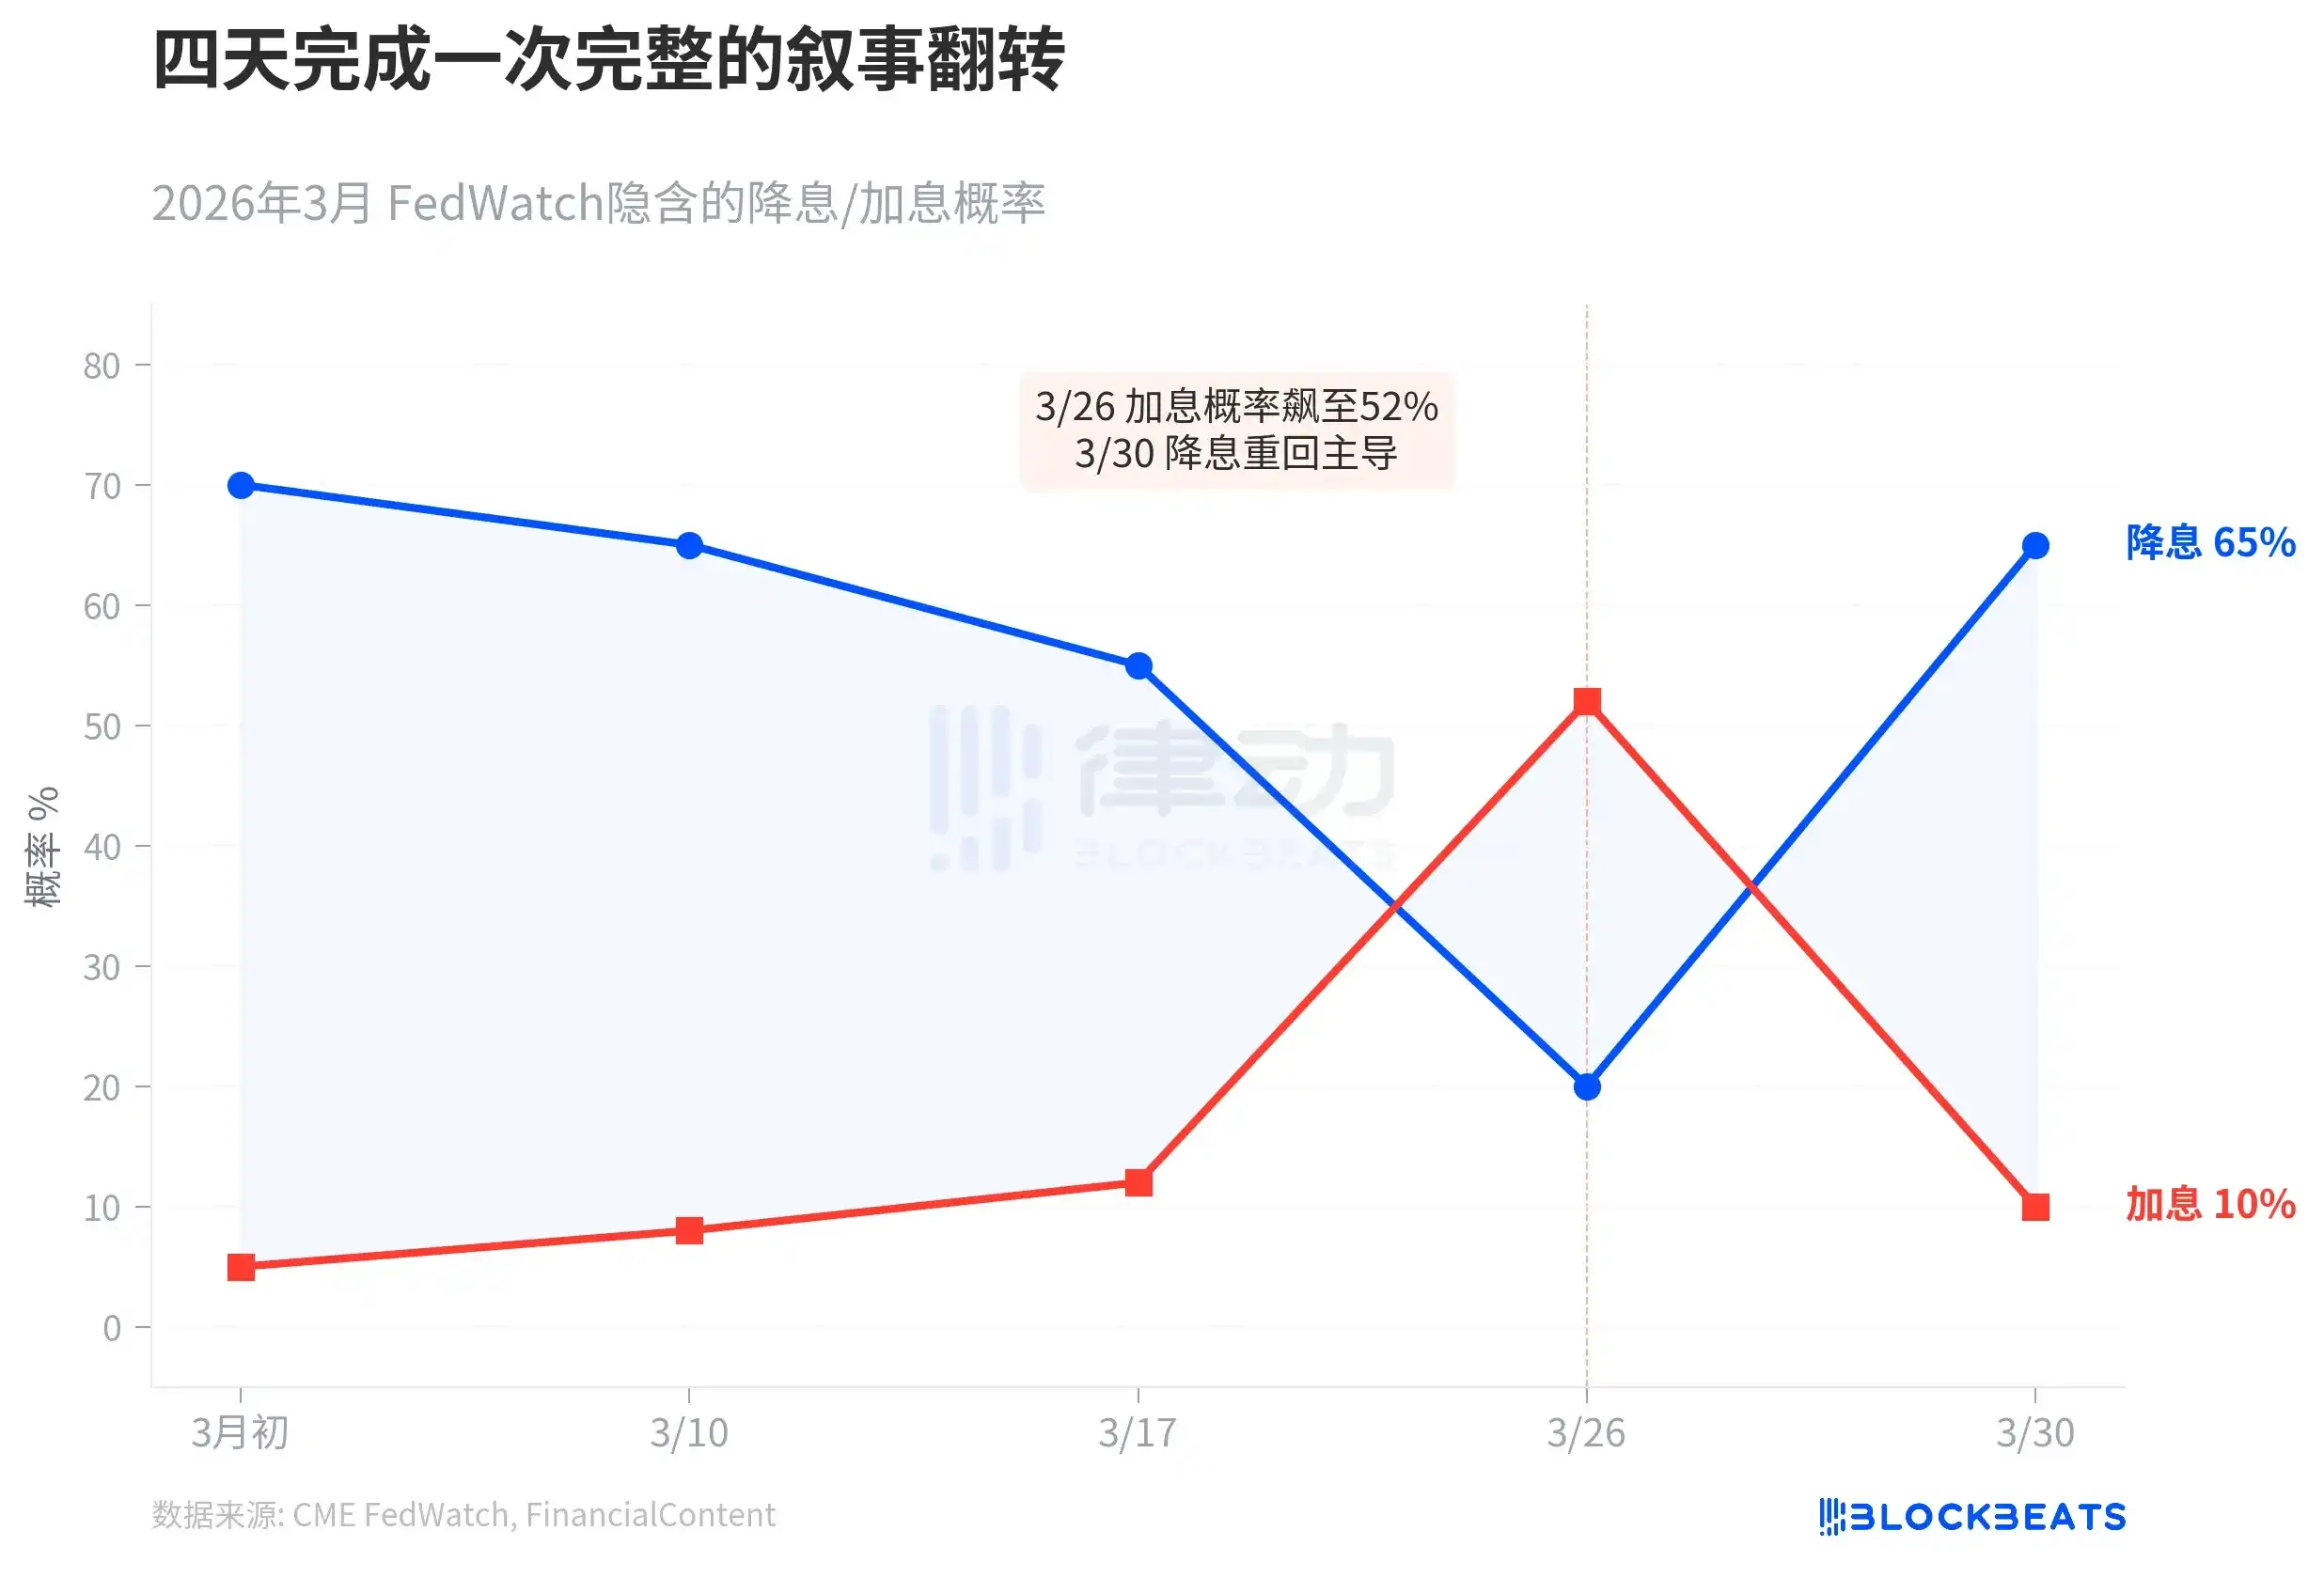
In early March, CME FedWatch showed the market expected three rate cuts for the year, with a 70% probability of a cut in June. Then, as oil prices continued to climb, the U.S. import price index jumped 1.3% on March 26, and incoming Fed Chair Kevin Warsh hinted that the neutral rate might be higher. That day, the probability of a rate hike within the year soared to 52%, and the 10-year yield touched 4.35%. FinancialContent defined this day as "The Great Hawkish Pivot."

Four days later, the narrative completely flipped. On March 30, consumer confidence data fell sharply, manufacturing unexpectedly contracted, and the 10-year yield plummeted to 3.92%. According to FinancialContent, market bets on a dovish pivot by the Fed in May rose to 65%. Goldman Sachs said the market had bet wrong on the direction of rate hikes. That same day, Powell told undergraduates at Harvard that the Fed "has not yet reached the moment where it must decide whether to look through the war shock," but emphasized that "the anchoring of inflation expectations is key."

According to Axios, Powell's remarks were interpreted by the market as: the Fed neither wants to raise rates to fight inflation nor is it in a hurry to cut rates to save the economy. Instead, it is waiting to see whether this supply shock is temporary or persistent. But the bond market can wait no longer.

If history is any guide, Citi strategist McCormick put it most bluntly: what lies ahead is stagflation, which is bad for bonds and bad for stocks.
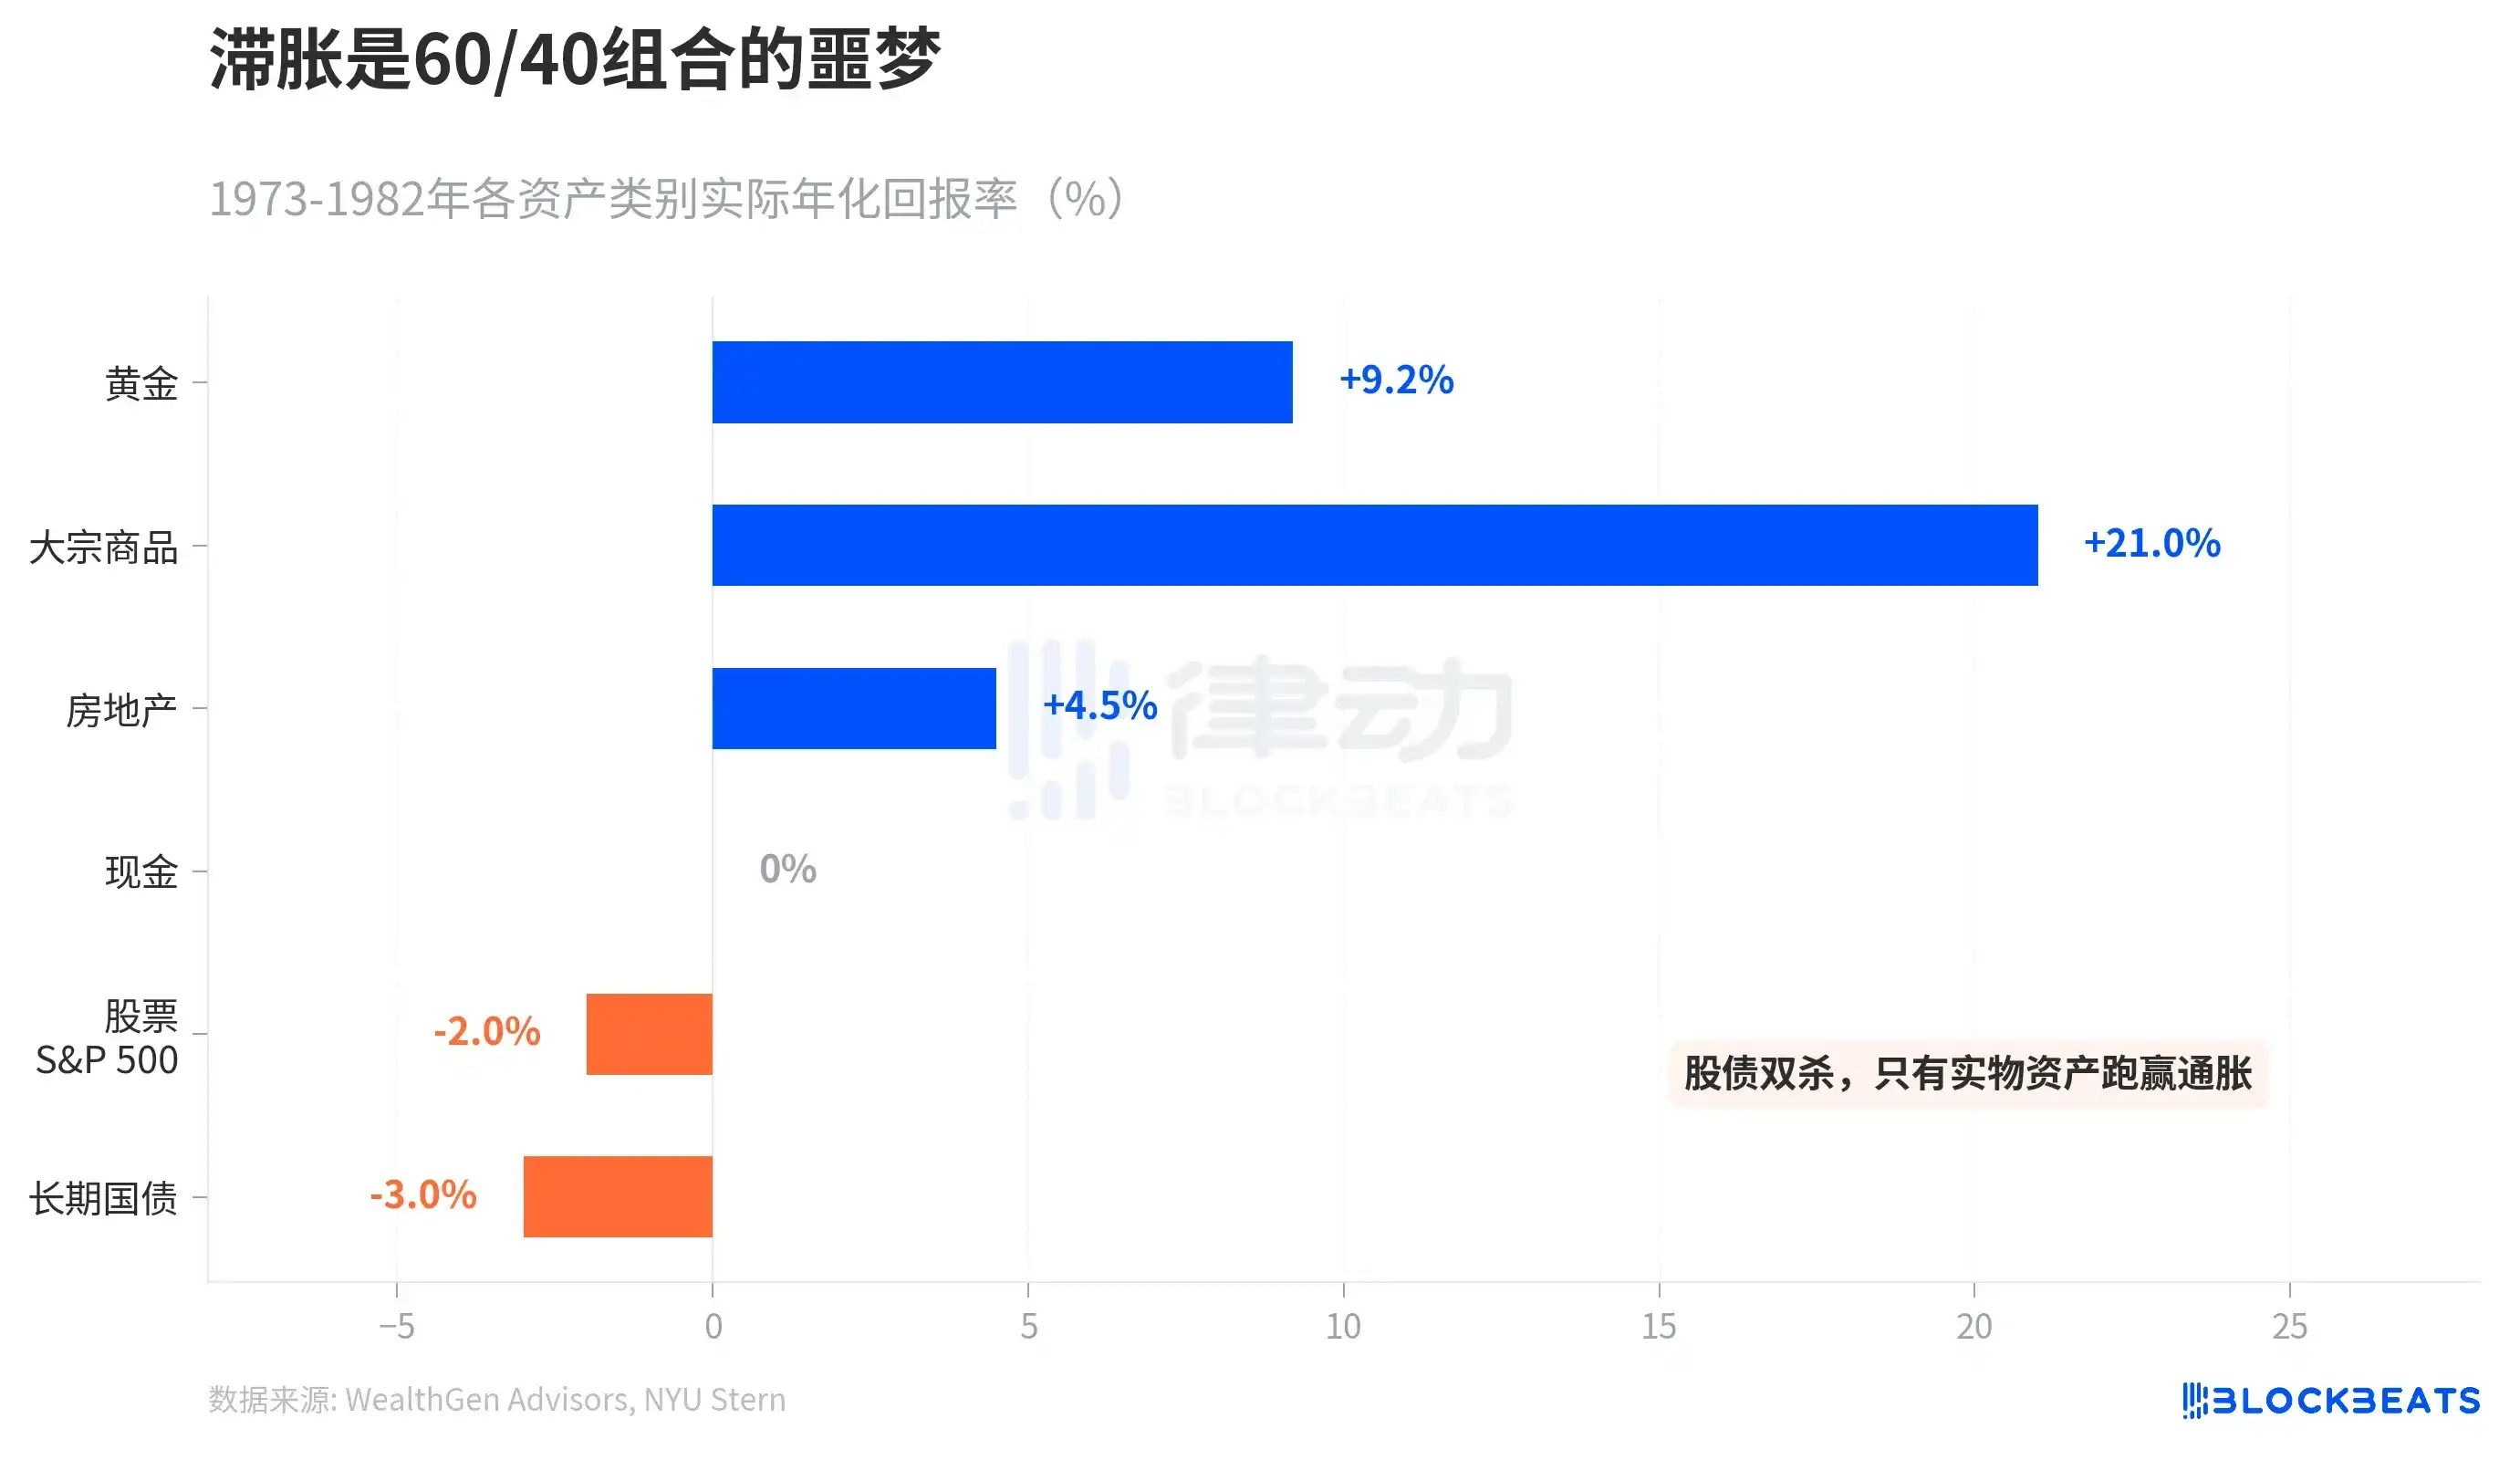
The Great Stagflation from 1973 to 1982 delivered a report card on asset returns. Gold delivered an actual annualized return of +9.2%, the commodities index (S&P GSCI) surged 586% over the decade, and real estate gained +4.5%. In contrast, the S&P 500's actual annualized return was -2%, and long-term Treasuries returned -3%. According to NYU Stern historical data, long-term Treasuries suffered a -8.6% loss in 1979 alone.

The traditional 60/40 investment portfolio (60% stocks + 40% bonds) was caught in a squeeze during stagflation. Only physical assets outperformed inflation. Société Générale predicts Brent will average $125 in April, with a "credible peak" of $150. Goldman Sachs is slightly more moderate, forecasting an April average of $115, but assuming the Strait of Hormuz reopens within six weeks, falling to $80 by year-end.

The bond market has already made a choice for everyone: between inflation and recession, it is betting on recession.

Related Questions

QWhy did the 10-year Treasury yield fall sharply despite the surge in oil prices in late March 2026?

AThe bond market experienced a 'flight to safety', with growth risks (fear of recession) beginning to outweigh inflation risks, causing investors to rush into bonds and push yields down.

QWhat historical precedent suggests about the economic outcome following such a sharp oil price increase?

AHistorical cases (1973, 1979, 1990, 2008) show that sharp oil price surges of over 35% were often followed by economic recessions or significant slowdowns, with the exception of the 2022 Ukraine war spike which caused high inflation instead.

QHow did the market's expectation for Federal Reserve policy change dramatically within a few days?

AOn March 26, market pricing indicated a 52% probability of a rate hike due to inflation concerns, but by March 30, it had flipped to a 65% probability of a dovish pivot and rate cuts due to weak consumer confidence and manufacturing data.

QWhat is the potential worst-case macroeconomic scenario feared by the market, according to a Cit strategist?

ACit strategist McCormick stated that the worst-case scenario ahead is stagflation, which is bad for both bonds and stocks.

QWhich asset classes historically performed well during the 1973-1982 stagflation period, according to the article?

ADuring the 1973-1982 stagflation, gold delivered a +9.2% real annualized return, the S&P GSCI commodity index rose 586% cumulatively, and real estate returned +4.5%. In contrast, stocks and long-term bonds had negative real returns.

Related Reads

Bank of America Quietly Positions: Could $6 Trillion in Bank Deposits Flow into Stablecoins?

Bank of America (BofA) is making strategic moves in digital assets, appointing senior leaders to advance a platform covering stablecoins, tokenized deposits, custody, and crypto settlement. This comes amid a broader discussion about the potential migration of trillions in bank deposits to stablecoins. A cited TBAC report estimated up to $6.6 trillion in transactional deposits could be at risk of moving to stablecoins long-term, a point BofA's CEO previously conditioned on stablecoins being allowed to pay interest. The regulatory landscape is evolving, with the GENIUS Act setting a final implementation deadline for January 2027. Major banks, however, are not waiting; JPMorgan, Citi, BofA, and others are already developing tokenized deposit networks and services. Industry observers note that while retail crypto trading is sluggish, institutional adoption of stablecoins for real-world use cases is driving growth. Despite the activity, some analysts remain cautious, noting banks have a long history of blockchain announcements and that true structural change is slow. The stablecoin market itself has seen a recent dip from its peak. Optimistic projections, however, foresee significant growth, with stablecoin settlement volume already reaching $33 trillion in 2025. The race is on for the post-January 2027 landscape, where regulatory clarity is expected to accelerate the fusion of traditional finance and crypto.

marsbit2m ago

Bank of America Quietly Positions: Could $6 Trillion in Bank Deposits Flow into Stablecoins?

marsbit2m ago

STAR 50 Soars 10.73%, Why Did A-Shares Stage a "V-Shaped Reversal"?

After a prolonged decline, the Chinese A-share market staged a strong rally on July 21. The STAR 50 index surged 10.73%, its largest single-day gain in nearly a year, leading a broad-based "V-shaped" reversal. The Shanghai Composite Index rose 1.79%, the Shenzhen Component Index gained 4.81%, and the ChiNext Index jumped 7.05%. Total market turnover reached 2.97 trillion yuan, an increase of 256.1 billion yuan from the previous session, with over 3,100 stocks advancing. The semiconductor sector spearheaded the rebound, with related ETFs posting significant gains. Analysts attribute the surge to three converging factors. First, coordinated capital inflows from "national team" institutions, insurance funds, listed company buybacks, and fund house self-purchases have bolstered market liquidity and confidence. Second, supportive policy signals, including commitments from regulators to ensure stable market operations, provided a favorable backdrop. Third, a stabilization and recovery in overseas markets, notably South Korea, created a positive external environment. Institutions suggest the most severe panic selling phase for the tech sector has likely passed, following a significant digestion of crowded positions and leveraged funds. While short-term volatility may persist, the medium to long-term outlook remains underpinned by enduring trends like AI computing demand expansion and semiconductor localization. The market's focus now shifts to the sustainability of supportive fund flows, earnings reports, and upcoming catalysts from the global AI industry chain.

marsbit40m ago

STAR 50 Soars 10.73%, Why Did A-Shares Stage a "V-Shaped Reversal"?

marsbit40m ago

U.S. Tech Momentum Stocks Post Largest Single-Day Gain Ever, But Is the Plunge Over?

US tech momentum stocks staged a sharp rebound on Tuesday (July 21st). Morgan Stanley's TMT Momentum Factor surged over 12%, marking its largest single-day gain on record, exceeding even peaks from the 2000 dot-com bubble. Key momentum indices from Goldman Sachs also posted their strongest daily performances in years. The rally was led by semiconductors, with the Philadelphia Semiconductor Index jumping 4.6%. This rebound followed three consecutive down days and a cumulative 33% plunge in momentum stocks, one of the steepest drawdowns since the dot-com era. Analysts attribute the surge largely to a short squeeze. Heavy selling had pushed high-beta momentum stocks into deeply oversold territory, forcing many short sellers, particularly in Asia, to cover their positions, creating a self-reinforcing buying spiral. However, the rebound's internals appear weak. Trading volume was notably low, and advancing stocks still lagged decliners on the S&P 500, indicating a narrow, concentrated rally rather than broad market participation. Diverging views emerge on the outlook. BTIG warns the bounce has hit key resistance and recommends selling into strength, citing extreme volatility and historical parallels to past market tops. Conversely, Goldman Sachs and UBS believe the momentum unwind is nearing its end, suggesting it may be time to gradually add exposure, as positioning has been significantly reduced. They caution, however, that high volatility warrants a measured approach, potentially using defined-risk strategies. The upcoming earnings season, particularly reports from major tech firms like Alphabet, is seen as a critical test for the rally's sustainability. Simultaneously, bond markets flashed a warning, with yields rising partly due to spiking oil prices. Analysts note that if long-term Treasury yields break decisively higher, it could pose a significant headwind for equities, especially growth stocks.

marsbit47m ago

U.S. Tech Momentum Stocks Post Largest Single-Day Gain Ever, But Is the Plunge Over?

marsbit47m ago

U.S. Tech Momentum Stocks Record Largest Single-Day Gain Ever, but Has the Rout Ended?

U.S. tech momentum stocks staged a dramatic rebound on Tuesday, July 21st. Key momentum indices like the Morgan Stanley TMT Momentum Factor and Goldman Sachs' High Beta Momentum Long Index posted historic or near-historic single-day gains, fueled largely by semiconductor stocks. This sharp rally followed a severe three-day sell-off that saw momentum stocks plunge 33%, marking one of the steepest pullbacks since the dot-com bubble. Analysts attribute the bounce primarily to a short squeeze, as forced covering from over-leveraged traders, particularly in Asia, created a buying spiral. However, the rally's health is questioned due to weak market breadth—overall trading volume was low, and decliners outnumbered advancers in the S&P 500 despite the index's gain—suggesting a narrow, concentrated surge rather than broad recovery. Opinions on the sustainability diverge. BTIG strategists warn the rebound has hit key resistance levels, citing extreme volatility and historic stock dispersion as signs of an ongoing broader correction, and recommend selling into strength. Conversely, Goldman Sachs and UBS view the aggressive momentum unwinding as nearing its end, noting reduced positioning and a lack of new fundamental catalysts. They suggest the sell-off presents a selective opportunity to add exposure, albeit cautiously and gradually using defined-risk strategies. The immediate trajectory hinges on the ongoing earnings season, with market focus on Alphabet's capital expenditure guidance for AI investment clarity. Meanwhile, bond markets present a risk, with rising Treasury yields—potentially heading toward 5.5%—and widening credit spreads for mega-cap tech companies posing a threat to equity valuations. The combination of technical factors, earnings results, and macro conditions leaves the durability of the rebound in doubt.

链捕手50m ago

U.S. Tech Momentum Stocks Record Largest Single-Day Gain Ever, but Has the Rout Ended?

链捕手50m ago

Trading

Spot
活动图片