SIREN rallies 2450% – But weakening fundamentals still flash warning signs

ambcryptoPublished on 2026-03-30Last updated on 2026-03-30

Abstract

SIREN has surged 2450% in 90 days, but underlying fundamentals show significant warning signs. Despite the price rally, the number of token holders has declined from an all-time high of 41,570 to 39,390, reducing demand and increasing circulating supply. Market capitalization also dropped by $490 million, yet the price continued to rise, largely driven by perpetual traders taking long positions. The Taker Buy/Sell Ratio remained above 1, indicating dominant buy-side pressure, and short liquidations outweighed long liquidations. However, the Funding Rate has turned negative, suggesting growing bearish sentiment. If this trend continues, SIREN could face a sharp reversal, erasing recent gains.

Siren [SIREN], one of the top-performing altcoins by gains, has extended its rally once again. Over the past 90 days, the asset has surged by approximately 2,450%, while adding another 11% in the last 24 hours.

Although this surge may attract strong investor interest, it carries underlying risk. Market fundamentals do not align with the perpetual trading activity currently driving the gains.

On-chain fundamentals deteriorate

The number of holders of the AI agent token SIREN has declined after reaching an all-time high of 41,570. Since hitting this milestone, holder count has trended downward.

Within about a week, the network lost roughly 2,200 holders, falling to 39,390, according to CoinMarketCap.

A decline in holders typically increases the circulating supply of an asset in the market, which often places downward pressure on price, especially when demand weakens.

Source: CoinMarketCap

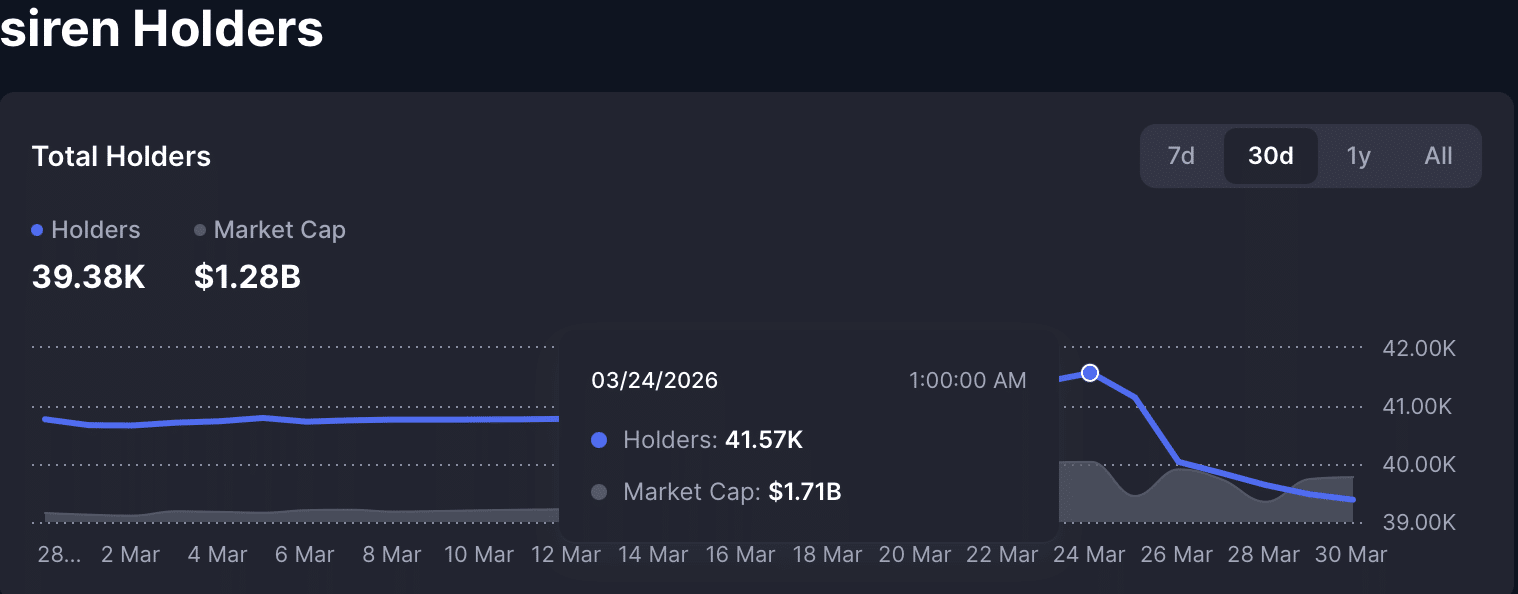
SIREN has already reflected part of this trend, with its market capitalization dropping by $490 million. Under normal conditions, such a decline would weigh on price action.

However, SIREN has defied this logic and continued to rally. Analysis indicates that this divergence introduces significant risk.

What is driving the rally?

Despite weakening fundamentals, perpetual traders have largely fueled the rally by increasing long positions.

Long trades occur when traders expect prices to rise. Over the past 24 hours, the cumulative Taker Buy/Sell Ratio across centralized exchanges has remained above 1, with a reading of 1.05, indicating that buy-side pressure dominates.

In simple terms, a Taker Buy-dominated market means that long trade volume exceeds short trade volume within the observed period.

Source: CoinGlass

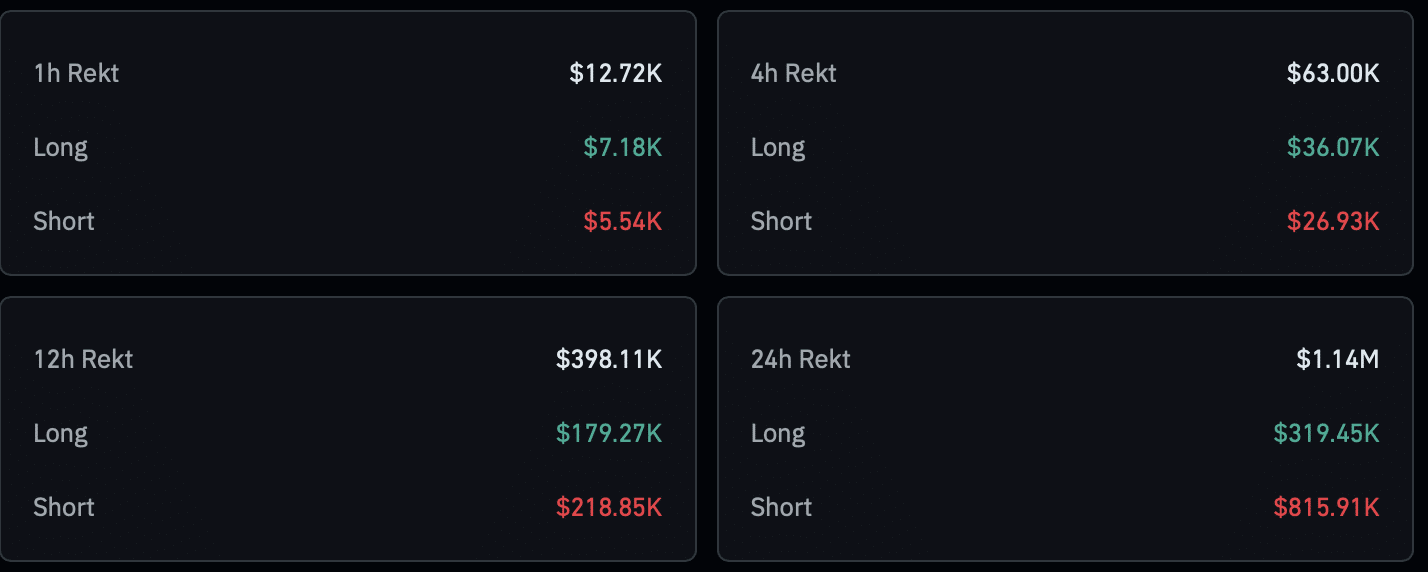
During the same timeframe, short traders recorded higher losses than long traders. CoinGlass liquidation data shows that approximately $817,000 in short positions was liquidated, compared to about $319,000 in long liquidations.

These liquidation imbalances and volume dynamics suggest that long traders currently control the market and continue to push prices higher.

The risk: a potential trap

Despite the ongoing rally, signs point to a possible trap forming for bullish perpetual traders. Market conditions could shift quickly.

The Funding Rate has started to turn negative, even as prices climb. At the time of writing, the Funding Rate stood at -0.0687%, indicating that more traders were opening short positions and sentiment was gradually turning bearish.

Source: CoinGlass

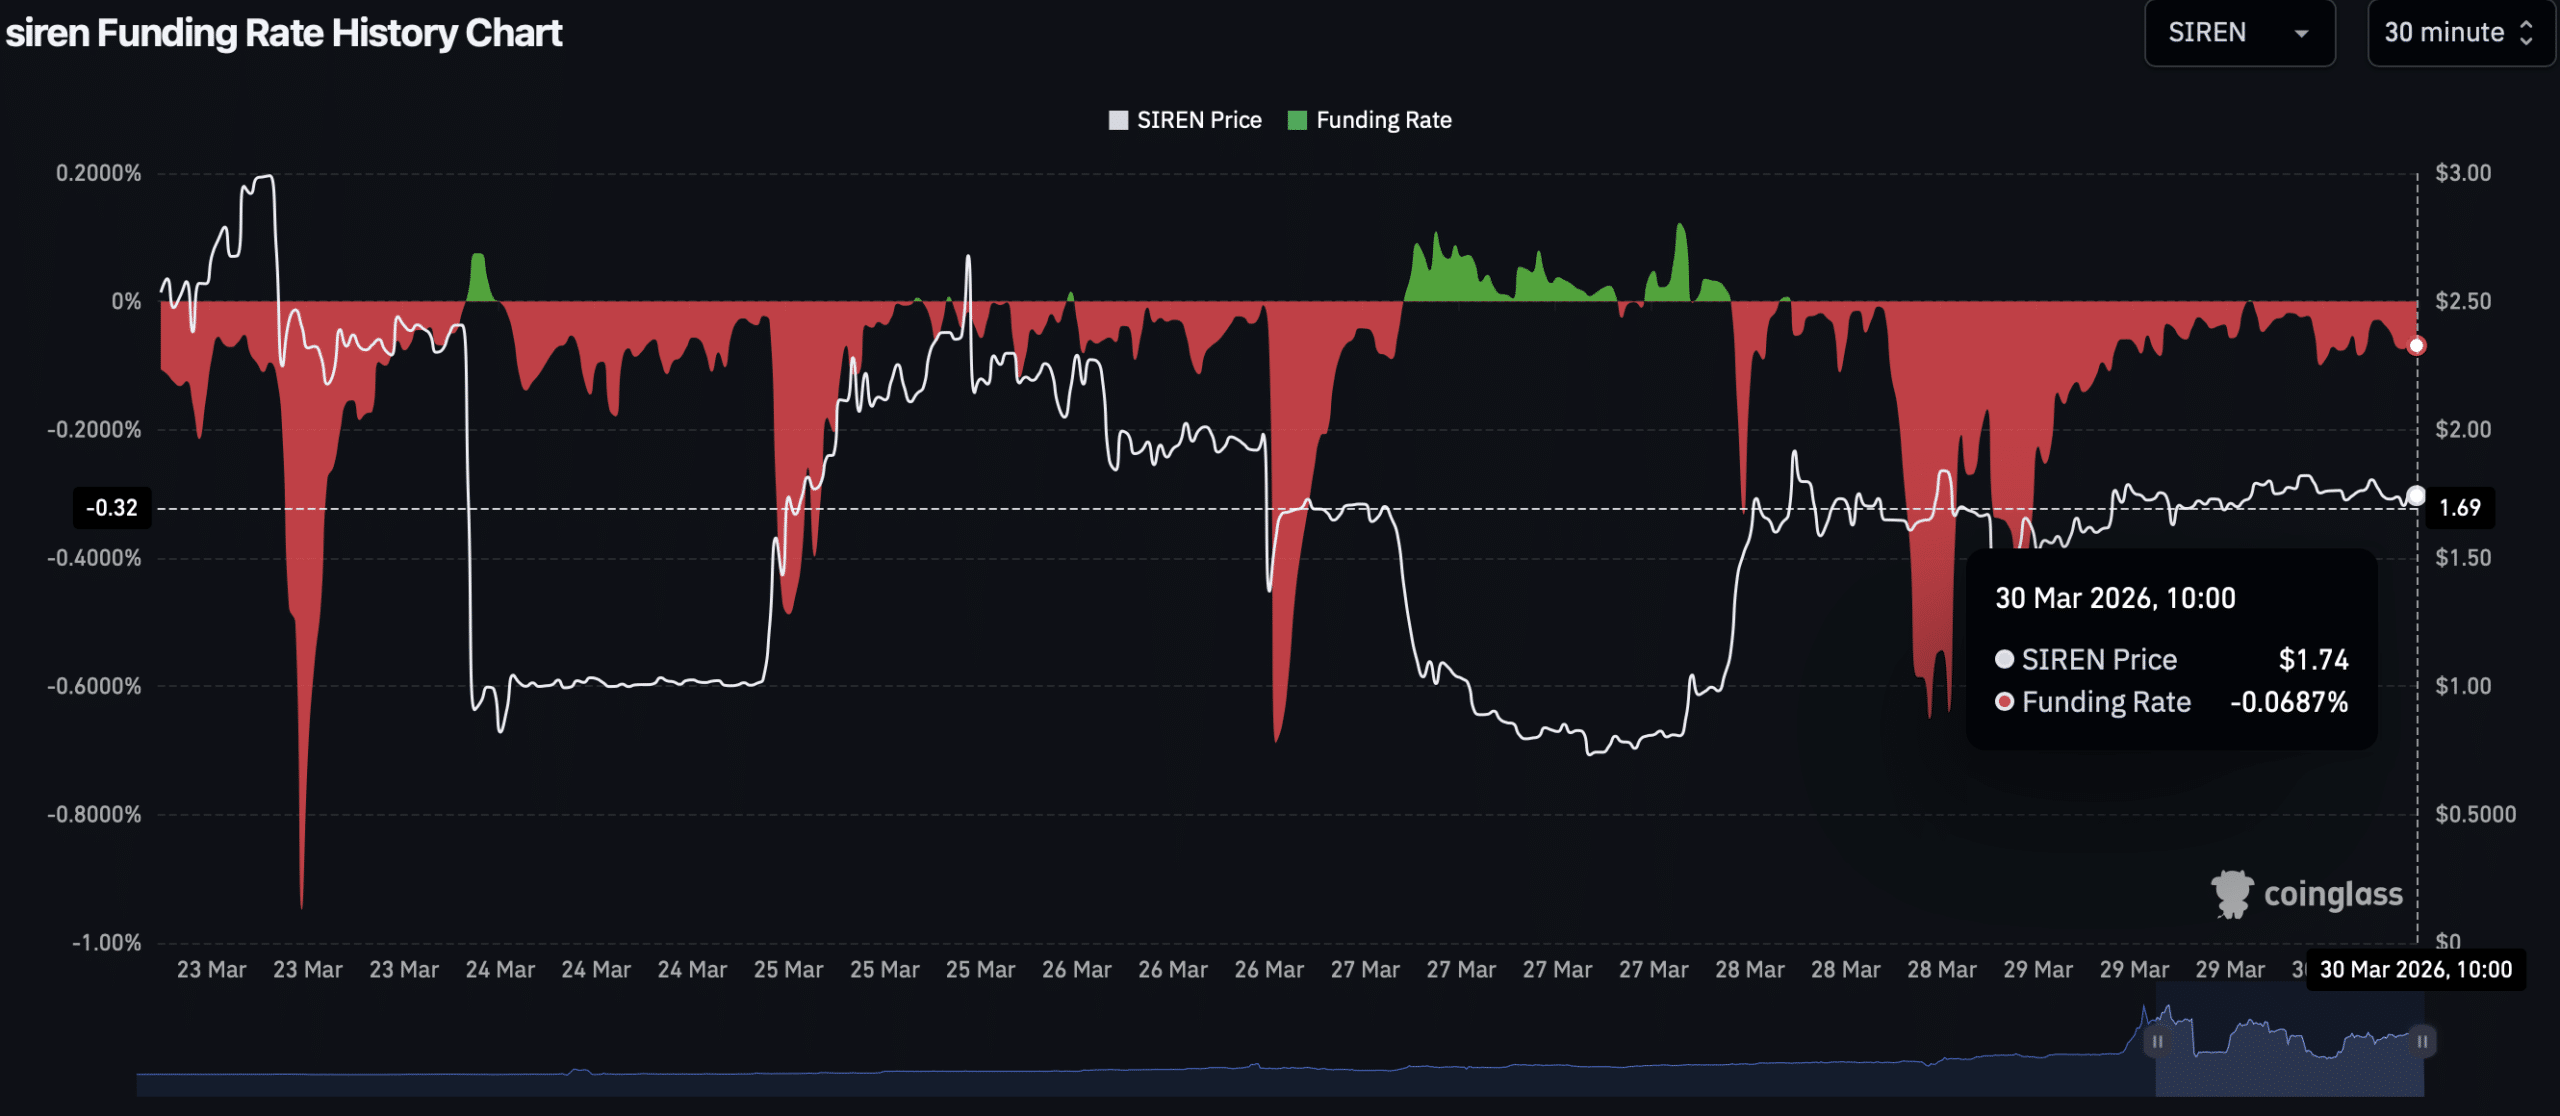
If this trend persists, price could eventually respond to the growing bearish pressure. In that scenario, SIREN may reverse course and decline from current levels, erasing a portion of its recent gains.


Final Summary

  • SIREN continues to rally despite a decline in holders and a $490 million drop in market capitalization.
  • Perpetual markets are driving the rally, but early signs of weakness are emerging.

Related Questions

QWhat is the percentage gain of SIREN over the past 90 days according to the article?

ASIREN has surged by approximately 2,450% over the past 90 days.

QWhat key on-chain fundamental metric has deteriorated for SIREN, indicating potential weakness?

AThe number of holders of SIREN has declined, falling from an all-time high of 41,570 to 39,390 within about a week.

QWhat specific type of trading activity is identified as the main driver behind SIREN's ongoing price rally?

APerpetual traders increasing their long positions are largely fueling the rally.

QWhat does a negative Funding Rate suggest about market sentiment for SIREN, even as its price climbs?

AA negative Funding Rate of -0.0687% indicates that more traders are opening short positions and that sentiment is gradually turning bearish.

QWhat is the primary risk highlighted for traders in the SIREN market despite the strong price performance?

AThe primary risk is a potential trap for bullish perpetual traders, where market conditions could shift quickly and cause the price to reverse and decline, erasing recent gains.

Related Reads

From Survival to Accelerated Growth: The Journey of Zcash's Three-Year Rise as Told by the Founder of ZODL

**From Survival to Accelerated Growth: Zcash Founder Details the 3-Year Rise** Three years ago, Zcash (ZEC) was a struggling pioneer in privacy technology, with a price near $30, low shielded supply (11%), and a community mired in governance disputes. Today, ZEC trades around $600, with over 31% of its supply (~$3B) in user-controlled shielded pools. This transformation resulted from breaking key constraints. First, **governance shackles were removed**. The old model guaranteed funding to two entities (ECC and ZF) regardless of performance, creating a monopoly. In 2024, ECC rejected further direct funding, forcing a change. The NU6 upgrade ended direct funding, allocating 8% to community grants and 12% to a protocol-controlled treasury for retroactive rewards, expiring in 2028 unless renewed by overwhelming consensus. The entities also relinquished their trademark-based veto power, freeing community governance. Second, the **product focus shifted** from pure cryptography to user growth. Previously, engineering excelled at privacy tech but failed to attract users. In early 2024, the team (later ZODL) pivoted to building products users wanted, like the Zodl wallet (default privacy, hardware support, cross-asset swaps). This drove shielded supply to grow over 400% in ZEC terms, with 86.5% of recent transactions being shielded, representing real user adoption. Third, the **narrative evolved** from the limiting "privacy coin" label to "unstoppable private money." This clarified Zcash's value proposition: a Bitcoin-like monetary policy with verifiable private payments via advanced cryptography. This structural narrative—protocol (Zcash), asset (ZEC), gateway (Zodl)—enabled broader exchange listings, institutional interest, and ETF filings. Finally, **organizational constraints were broken**. In early 2026, the ECC team left its non-profit structure after disputes over control, forming Zcash Open Development Lab (ZODL). ZODL raised $25M from top VCs (Paradigm, a16z, etc.), gaining the capital and agility of a startup to scale consumer products. Current metrics show strong momentum: social discussion volume for ZEC surged 15,245% in a year, with 81% positive sentiment. The focus is now on enhancing user experience (Zodl wallet), scalability (Tachyon project targeting Visa-level throughput with 25-second blocks), and post-quantum security (quantum-recoverable wallets coming soon). Zcash is positioned to become faster, more usable, scalable, and quantum-resistant.

marsbit3m ago

From Survival to Accelerated Growth: The Journey of Zcash's Three-Year Rise as Told by the Founder of ZODL

marsbit3m ago

Five Counterparty Risk Architectures: A Settlement-Layer Methodology for Classifying TradFi Models in Crypto Exchanges

**Summary:** This companion piece reframes the five TradFi-on-crypto exchange architectures, previously classified by "architectural fingerprint," through the lens of counterparty risk. The core question is: whose balance sheet bears the loss first in a stress scenario, and has it historically done so? Each of the five models corresponds to a distinct risk holder with its own documented failure modes. * **Model 1 (Stablecoin-Settled CEX Perpetuals):** Risk is held by the stablecoin issuer (e.g., reserve composition, bank connectivity) and the CEX's own book. History includes Tether's banking disconnections (2017) and reserve misrepresentations (CFTC 2021 Order). * **Model 2 (CFD Brokers):** Risk resides on the broker's balance sheet (B-book model). Regulatory differences (e.g., ESMA's mandatory negative balance protection vs. Mauritius FSC's lack thereof) define loss allocation rules, as seen in the 2015 SNB event (Alpari UK insolvency). * **Model 3 (Off-Chain Custody & Transfer Agent Chain):** Risk lies with the off-chain custodian/platform. User asset recovery depends on Terms of Use and corporate structure, exemplified by the Celsius bankruptcy ruling (2023) where Earn Account assets were deemed property of the estate. * **Model 4 (DEX Perpetual Protocols):** No single balance sheet bears risk. Loss absorption relies on a protocol's insurance fund and Auto-Deleveraging (ADL) mechanism, as demonstrated in the GMX V1 (2022) and dYdX v3 YFI (2023) incidents. * **Model 5 (Regulated CCP - DCM-DCO-FCM):** The most institutionalized model concentrates risk in the Central Counterparty (CCP). However, history shows CCPs can employ non-standard tools under extreme stress, such as mass trade cancellation (LME Nickel, 2022) or enabling negative price settlements (CME WTI, 2020). The report argues that regulatory choices and counterparty risk structures are co-extensive, not in an upstream-downstream relationship. It concludes with five separate observation checklists (not predictions) for monitoring the structural vulnerabilities of each risk model.

marsbit20m ago

Five Counterparty Risk Architectures: A Settlement-Layer Methodology for Classifying TradFi Models in Crypto Exchanges

marsbit20m ago

Trading

Spot
Futures

Hot Articles

How to Buy ONE

Welcome to HTX.com! We've made purchasing Harmony (ONE) simple and convenient. Follow our step-by-step guide to embark on your crypto journey.Step 1: Create Your HTX AccountUse your email or phone number to sign up for a free account on HTX. Experience a hassle-free registration journey and unlock all features.Get My AccountStep 2: Go to Buy Crypto and Choose Your Payment MethodCredit/Debit Card: Use your Visa or Mastercard to buy Harmony (ONE) instantly.Balance: Use funds from your HTX account balance to trade seamlessly.Third Parties: We've added popular payment methods such as Google Pay and Apple Pay to enhance convenience.P2P: Trade directly with other users on HTX.Over-the-Counter (OTC): We offer tailor-made services and competitive exchange rates for traders.Step 3: Store Your Harmony (ONE)After purchasing your Harmony (ONE), store it in your HTX account. Alternatively, you can send it elsewhere via blockchain transfer or use it to trade other cryptocurrencies.Step 4: Trade Harmony (ONE)Easily trade Harmony (ONE) on HTX's spot market. Simply access your account, select your trading pair, execute your trades, and monitor in real-time. We offer a user-friendly experience for both beginners and seasoned traders.

3.5k Total ViewsPublished 2024.03.29Updated 2025.06.04

How to Buy ONE

Discussions

Welcome to the HTX Community. Here, you can stay informed about the latest platform developments and gain access to professional market insights. Users' opinions on the price of ONE (ONE) are presented below.

活动图片