Sentient: Why $51K long liquidations put SENT’s $0.015 at risk

ambcryptoPublished on 2026-03-28Last updated on 2026-03-28

Abstract

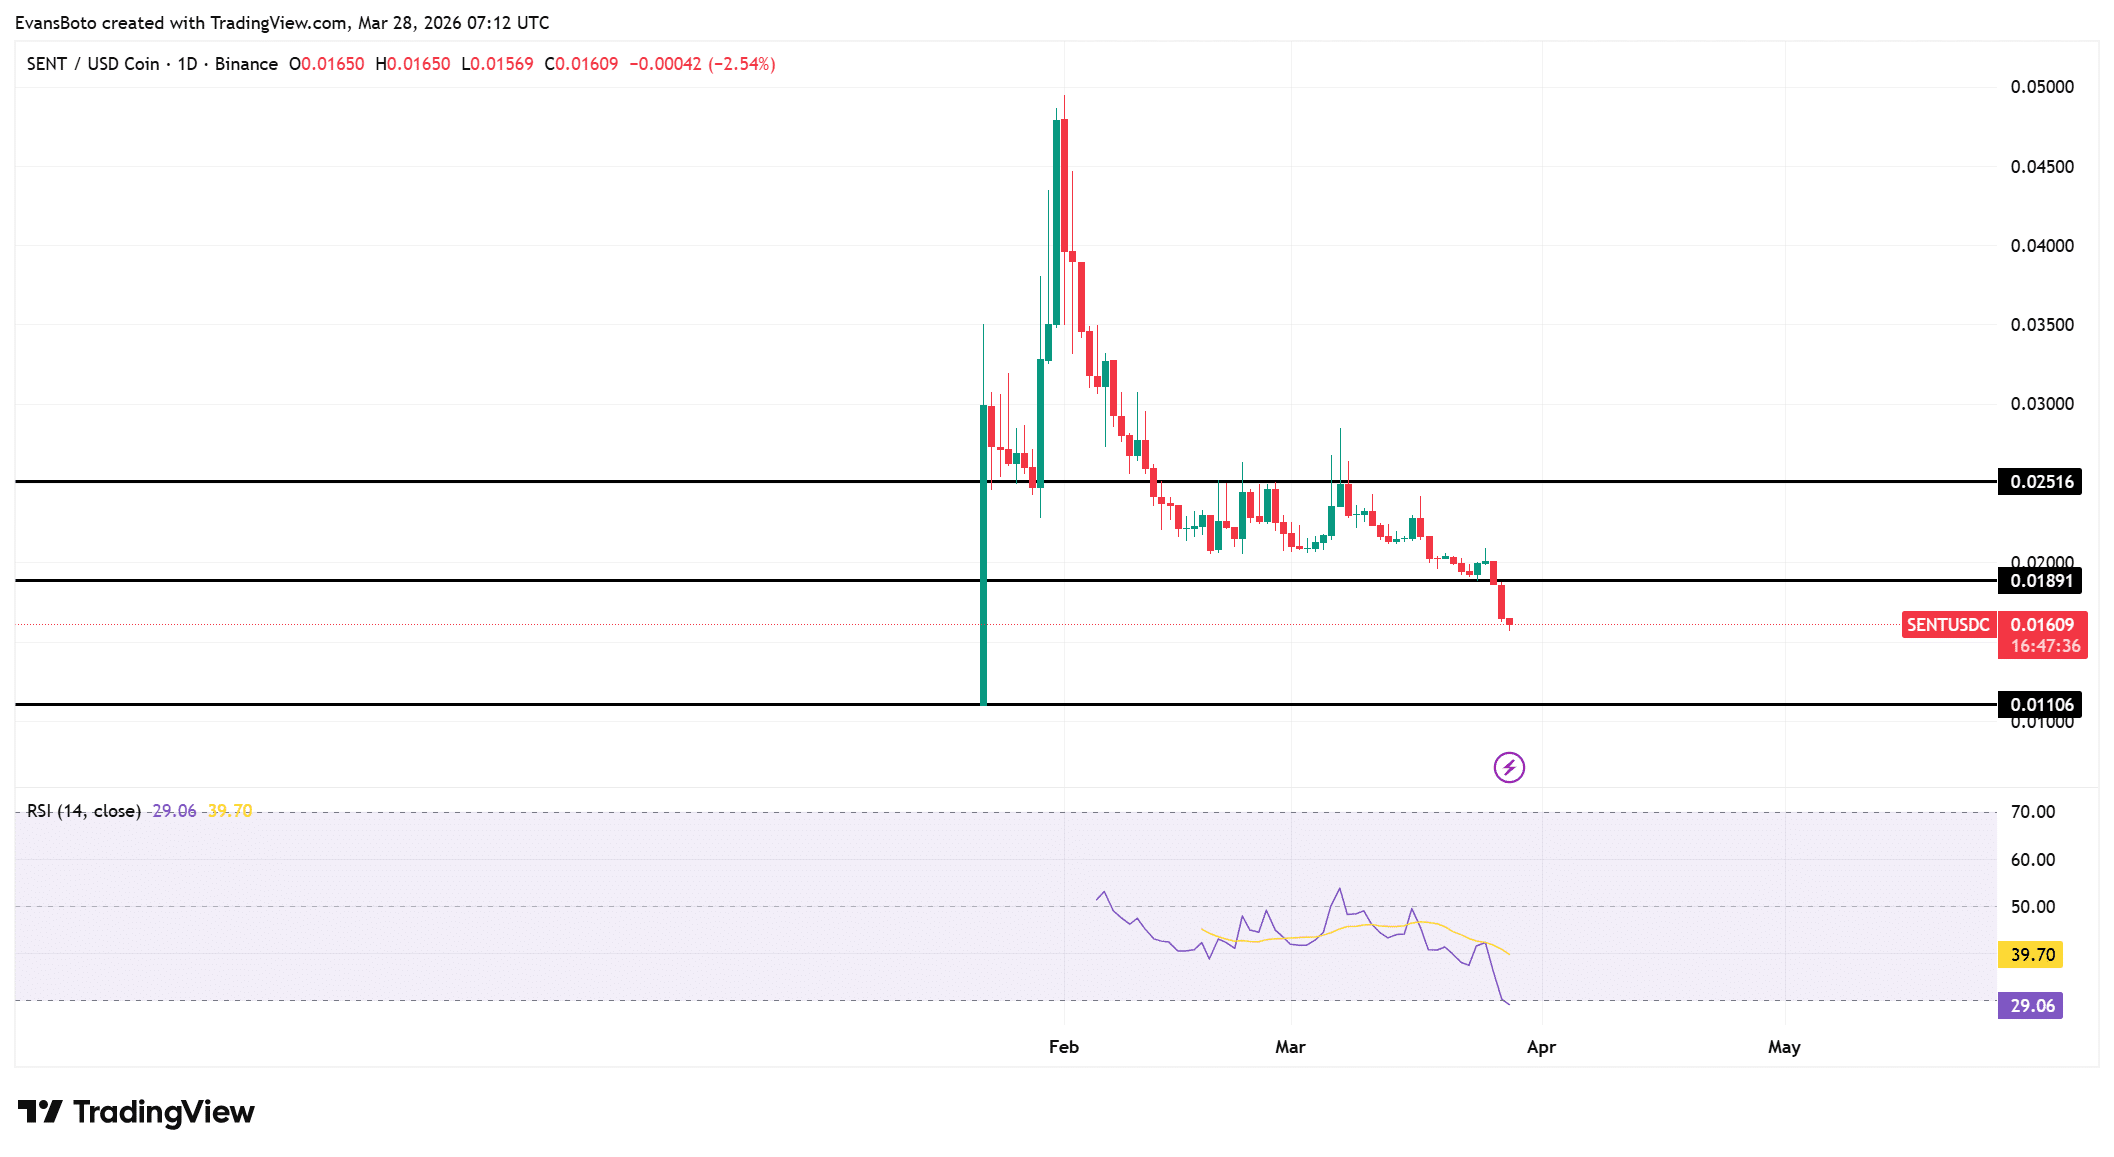
Sentient (SENT) dropped 14.3% to $0.01585 amid a 65% surge in trading volume, signaling strong sell-side pressure despite increased market activity. The price broke below the $0.01891 support level, indicating a continued bearish trend toward the $0.01106 demand zone. RSI fell to 29.06, confirming oversold conditions but suggesting persistent weakness rather than a short-term rebound. Open Interest declined by 16.30%, reflecting capital withdrawal and reduced participation from leveraged traders. Long liquidations dominated with $51K wiped out compared to only $96 in short liquidations, accelerating downward momentum. Current market structure, liquidations, and capital outflows align against recovery, indicating SENT may drift lower before stabilization attempts emerge.

Sentient [SENT] drops 14.3% to $0.01585 as volume surges 65% to $24.32 million at press time, reflecting aggressive sell-side activity despite rising market participation.

Sellers continue to dominate order flow, pushing price lower despite increased liquidity entering the market. Volume expansion under declining price conditions usually signals that participants are exiting positions rather than accumulating.

As a result, this structure shows clear sell-side control, where each attempt to stabilize gets absorbed quickly. The market reflects urgency from participants reducing exposure, which reinforces the ongoing SENT downside pressure.

SENT breakdown below support exposes

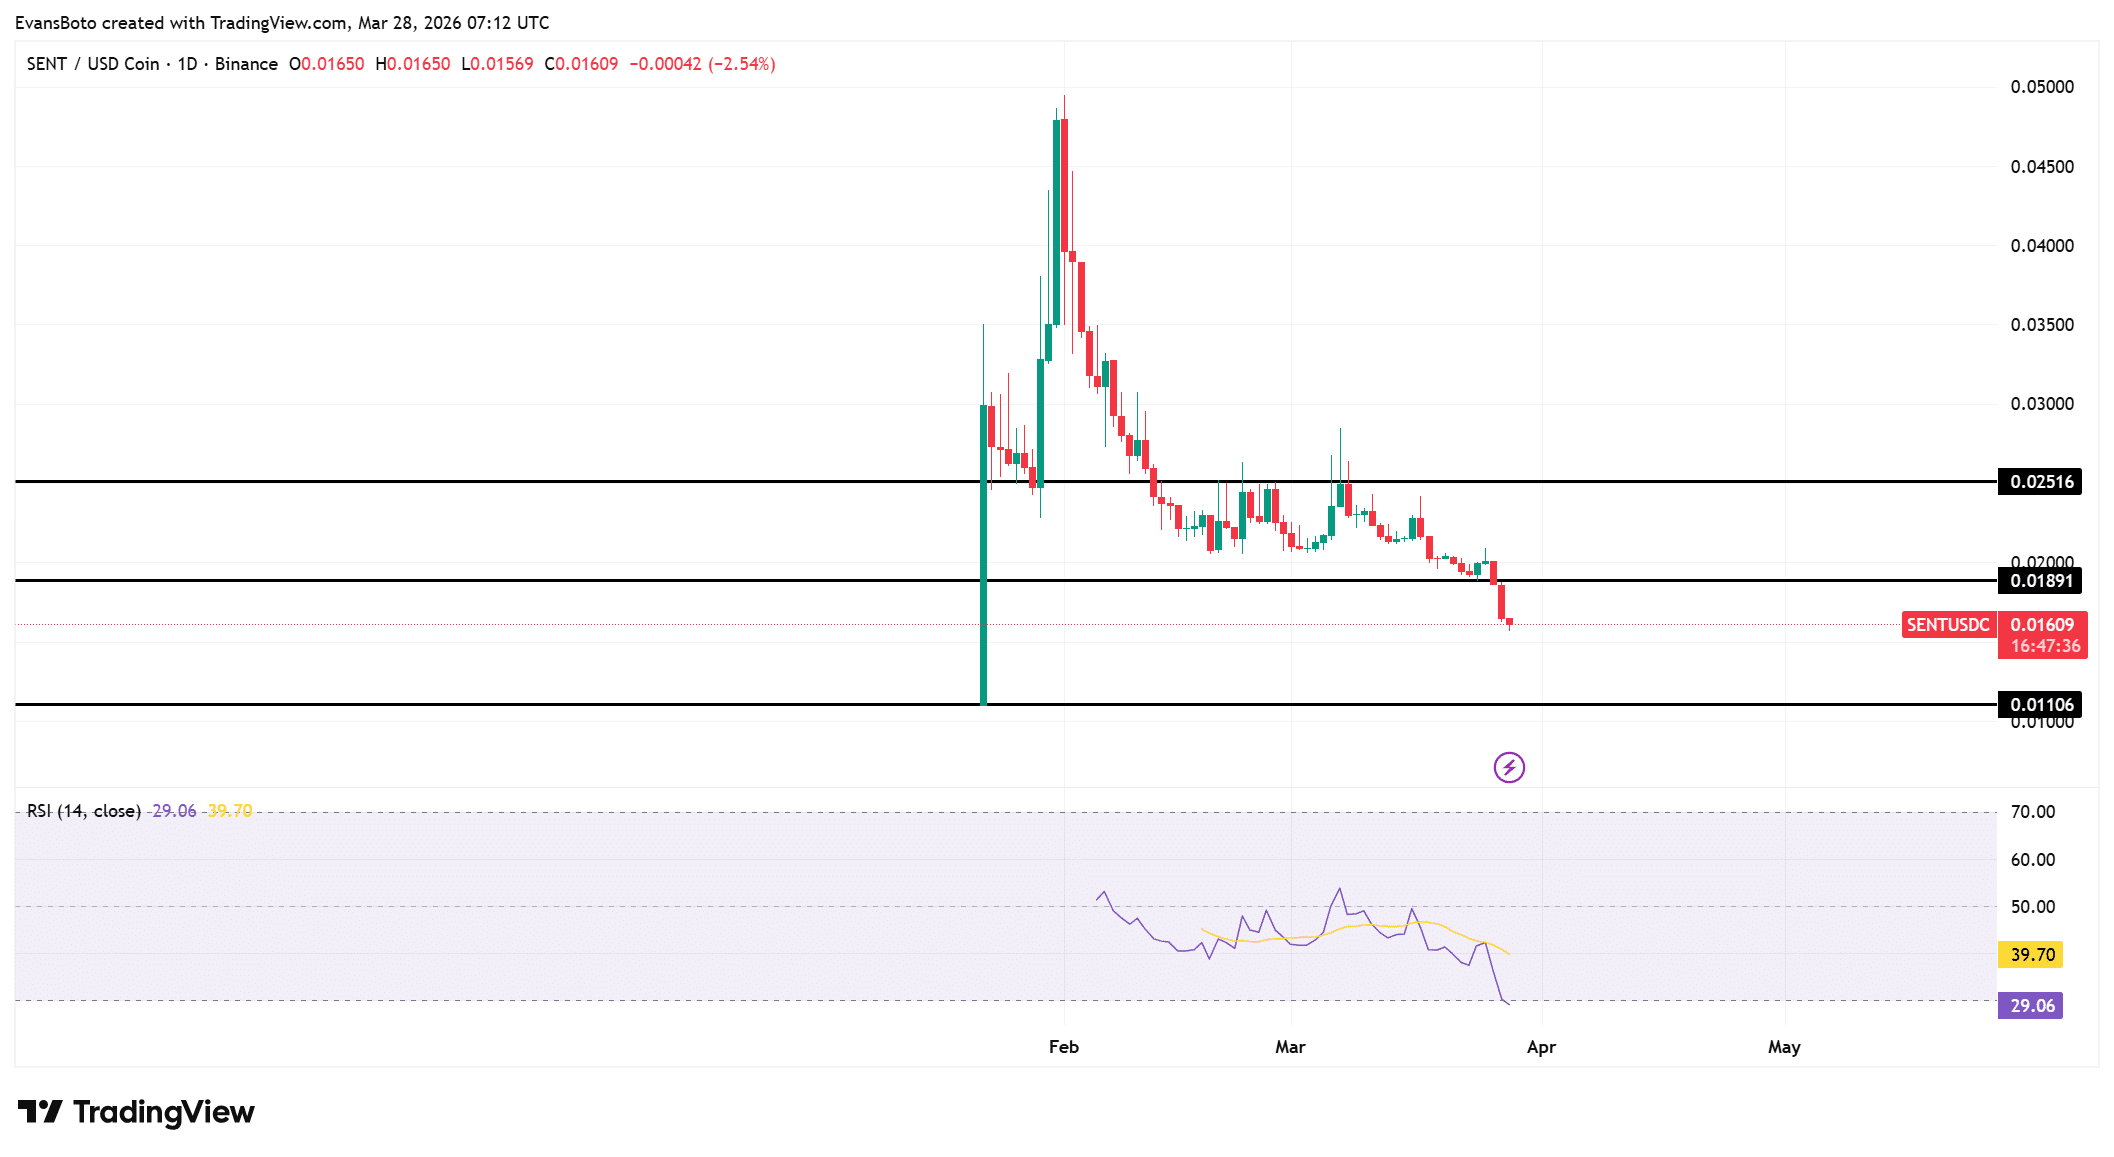
SENT price has broken below the $0.01891 support level and continues to extend lower toward the $0.01106 demand zone. This breakdown confirms that previous consolidation has failed to hold, shifting structure into a continuation phase.

Lower highs have remained intact across recent sessions, which reinforces bearish control over the trend. Attempts to reclaim the lost support have lacked follow-through, showing weak buyer commitment.

As price trades below key levels, market structure reflects continuation rather than reversal. This positioning suggests that sellers continue to dictate direction as the asset searches for a stronger demand base.

At press time, RSI dropped to 29.06, pushing Sentient into oversold territory and confirming the intensity of recent selling pressure. This reading reflects persistent downside strength rather than a temporary pullback.

While oversold conditions sometimes hint at short-term relief, the broader structure still aligns with continued weakness.
Source: TradingView

Falling OI signals capital withdrawal

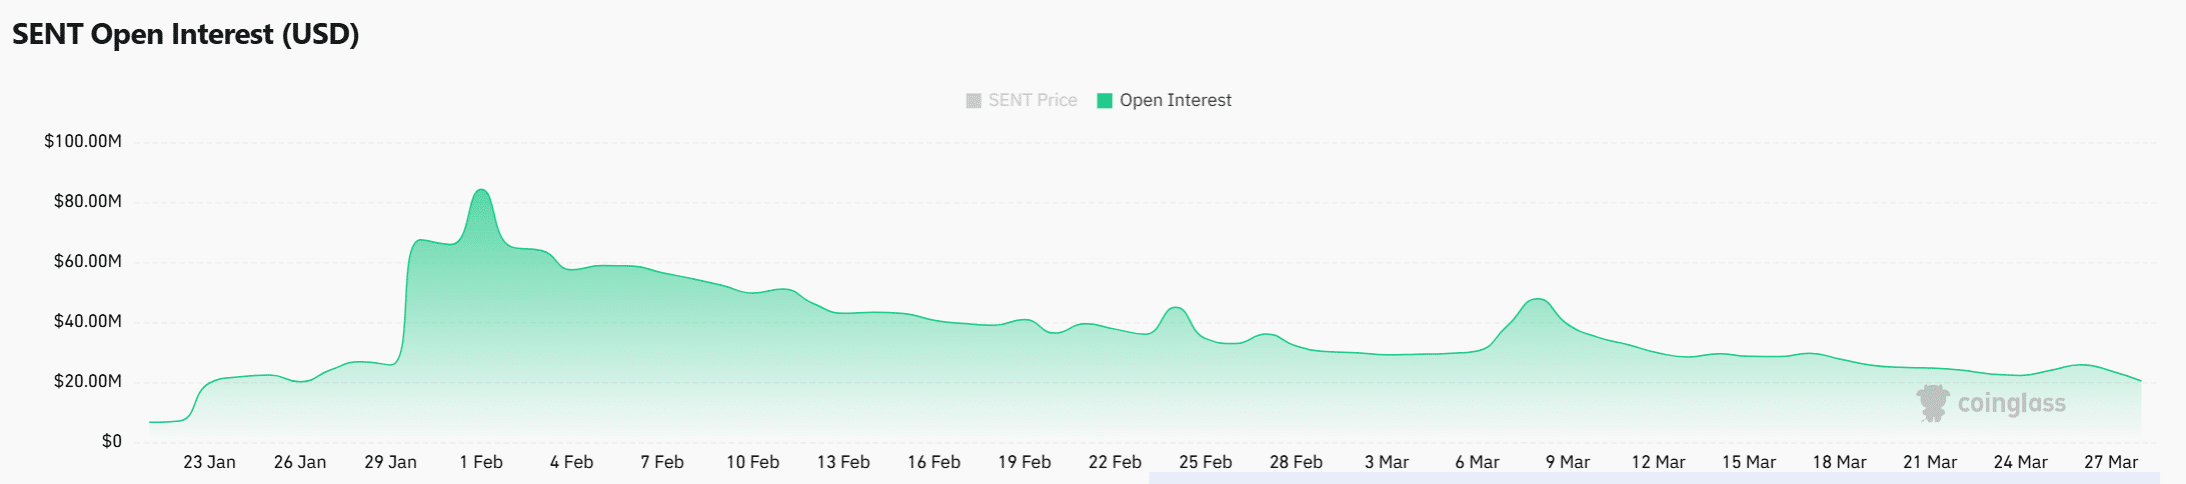
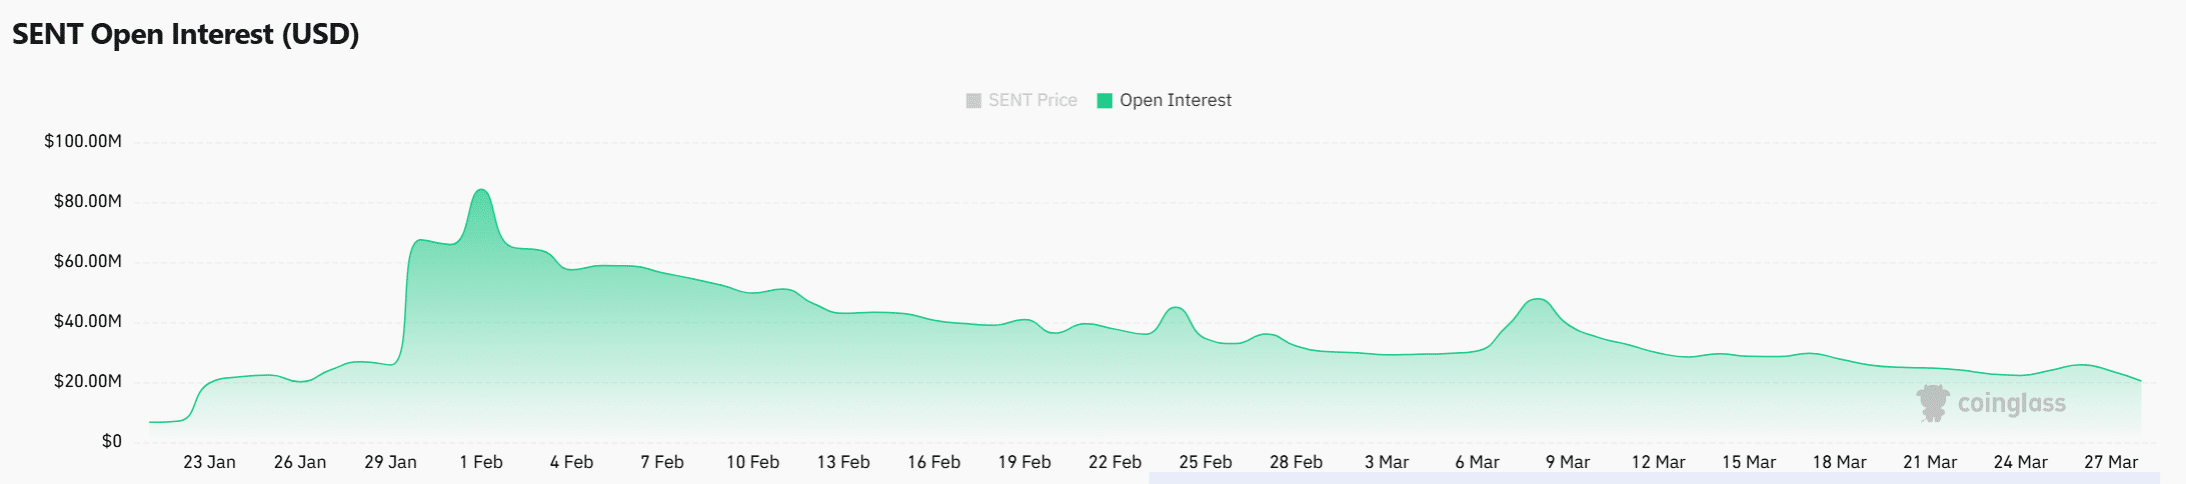
Open Interest (OI) has declined 16.30% to $19.76 million, indicating that leveraged traders are closing positions rather than opening new ones. This drop reflects a clear reduction in market participation from derivatives traders, especially those previously positioned on the long side.

As positions close, liquidity exits the market, which reduces the probability of immediate recovery. The decline in OI aligns closely with the price drop, confirming that traders are stepping away instead of defending positions. This behavior highlights a broader shift toward risk reduction across the market.
Source: CoinGlass

Long liquidations dominate across exchanges

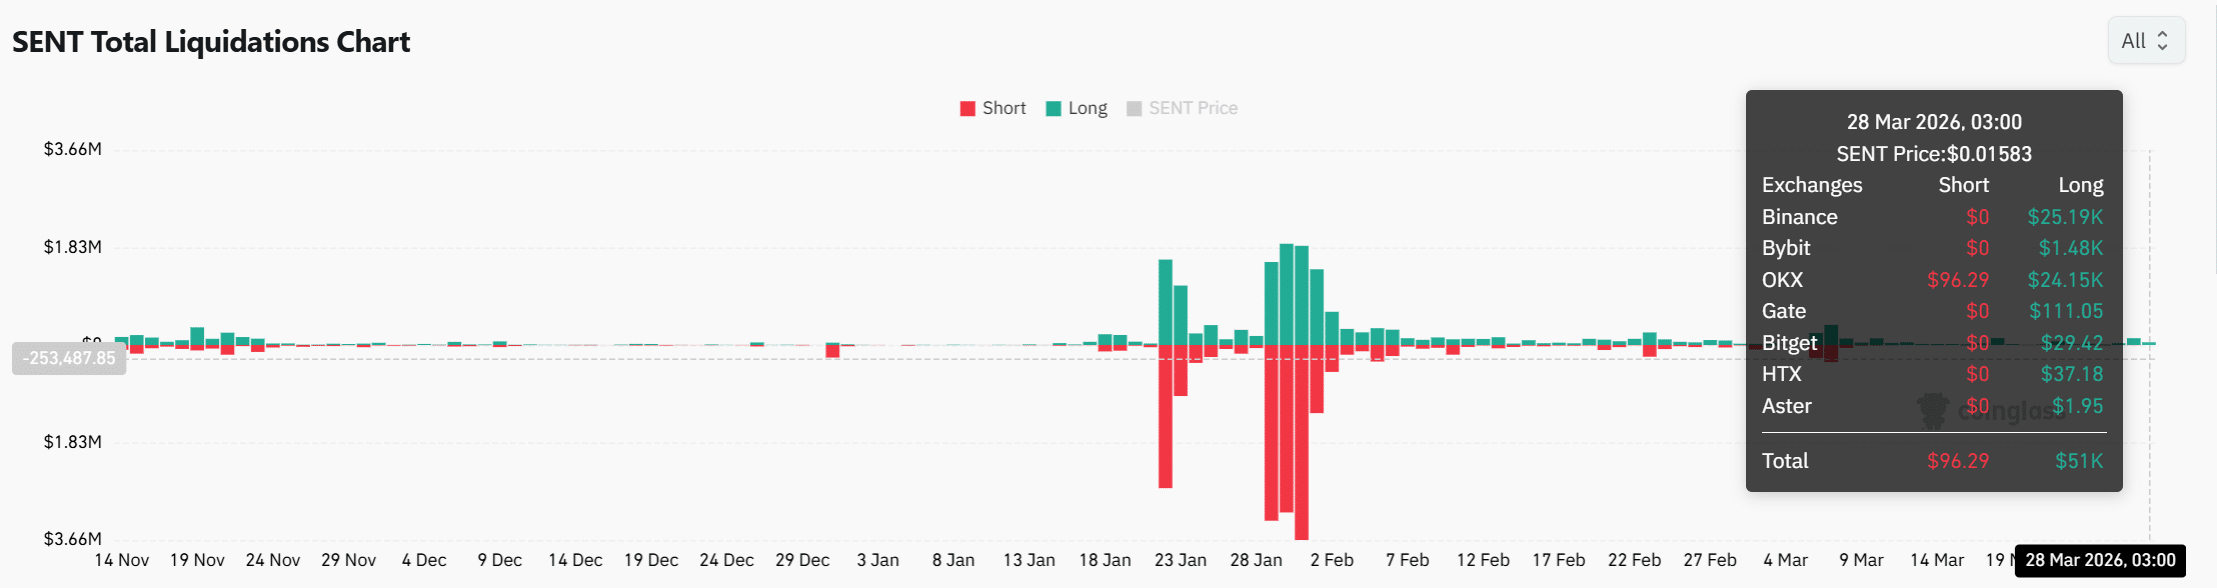
Liquidation data shows that long positions have faced heavy losses, with approximately $51K in longs wiped out compared to just $96 in short liquidations. This imbalance reflects aggressive forced exits, particularly across major exchanges like Binance and OKX.

When long positions get liquidated at this scale, they amplify downward pressure as positions close automatically. This cascade effect accelerates price declines and weakens bullish positioning further.

The dominance of long liquidations confirms that traders who expected upside continuation have exited under pressure, leaving the market tilted toward sellers.
Source: CoinGlass

Is SENT nearing stabilization or further downside?

SENT continues to face sustained downside pressure as structure, liquidations, and capital outflows align against recovery.

The breakdown below support, combined with the OI drop and dominant long liquidations, reflects a market still unwinding bullish exposure. Although RSI has entered oversold territory, current conditions do not support a stable rebound.

SENT would likely continue drifting lower toward the $0.01106 zone before any meaningful stabilization attempt emerges.


Final Summary

  • Sentient shows weakening structure as sellers maintain control and buyers fail to defend key levels effectively.
  • Market positioning reflects reduced confidence, suggesting price would continue drifting lower before any meaningful stabilization emerges.


Related Questions

QWhat is the current price of Sentient (SENT) and how much has it dropped?

ASentient (SENT) is currently priced at $0.01585, representing a drop of 14.3%.

QWhat key support level did SENT break below, and what is the next potential demand zone?

ASENT broke below the $0.01891 support level and is extending lower toward the $0.01106 demand zone.

QWhat does the 16.30% decline in Open Interest (OI) to $19.76 million indicate?

AThe decline in Open Interest indicates that leveraged traders are closing their positions rather than opening new ones, signaling a reduction in market participation and capital withdrawal.

QHow did long liquidations compare to short liquidations, and what does this imbalance reflect?

ALong liquidations dominated with approximately $51,000 wiped out, compared to only $96 in short liquidations. This reflects aggressive forced exits of bullish positions, amplifying downward price pressure.

QDespite the RSI reading of 29.06 indicating oversold conditions, why does the article suggest further downside is likely?

AThe article suggests further downside is likely because the broader market structure, capital outflows, and dominant sell-side control align against recovery. Oversold conditions alone are not enough to support a stable rebound without a change in these underlying factors.

Related Reads

Within Strategy's Framework, STRC's Dividend Yield Remains at 12% as Share Price Stays Below Par Value

Michael Saylor, Executive Chairman of Strategy (MSTR), confirmed that the dividend rate for its STRC perpetual preferred shares will remain at 12.00% through August 2026. The rate has increased from 9% at its July 2025 launch to the current high via a "ratchet" mechanism, which permanently raises the rate by 0.5% whenever the share price falls below $95. This mechanism is intended to push the price back toward its $100 par value and support Strategy's "at-the-market" (ATM) program for issuing new shares to fund Bitcoin purchases. However, the mechanism has not worked as intended. STRC shares closed at $89.46 on July 31, remaining about 10-11% below par value despite the record-high dividend. Competition from rival Strive's higher-yielding SATA securities has pressured demand. The persistent discount has forced Strategy to suspend new STRC issuances via its ATM program, limiting this funding channel for Bitcoin acquisitions. STRC's struggles reflect Bitcoin's own volatility, as the preferred shares historically move in tandem. Analysts have warned the ratchet structure carries long-term, one-way risk. A law firm is investigating Strategy's ability to maintain dividend payments if Bitcoin's price stays low. Retail investors own roughly 83% of outstanding STRC shares, a group seen as prone to panic selling during downturns. In response, Strategy has established financial reserves, including a liquidity cushion covering about 26 months of dividend/interest obligations, and a $2 billion share buyback program alongside a Bitcoin monetization framework, though the company emphasized it is not obligated to sell any Bitcoin.

cryptonews.ru24m ago

Within Strategy's Framework, STRC's Dividend Yield Remains at 12% as Share Price Stays Below Par Value

cryptonews.ru24m ago

Analyst: Bitcoin's Price Will Drop to $60k in August, Then Rebound to $70k

Financial analyst Andrey Poroshin has provided a new forecast for Bitcoin's price dynamics in August. Poroshin, an analyst at the Bitbanker exchange, expects the cryptocurrency market to experience a downturn this month, with prices retesting the $60,000 level due to a lack of supportive macroeconomic catalysts. He noted that the recent US Federal Reserve decision to hold interest rates did not significantly impact the market, while inflation remains above the 2% target. Poroshin stated that Bitcoin is ending July under pressure from moderate volatility and a lack of new macroeconomic stimuli, leading to continued market caution. According to his base scenario, Bitcoin will drop to a range of $60,000 to $62,000 before recovering to $70,000. He pointed out that even $70,000 remains below the cost of mining in the US, which has prompted some miners to shift towards AI data center operations. Poroshin cited the winding down of BitMEX's operations as a potential catalyst for a price rebound, suggesting the exit of weaker players often coincides with market reversals and reduced short-term selling pressure. He believes Bitcoin is currently less susceptible to geopolitical shocks, such as the Iran-US conflict, and does not expect significant market changes in August related to the pending CLARITY Act. Looking ahead, Poroshin forecasts that September will bring more active price fluctuations driven by potential Fed rate decisions and possible discussions or approval of the CLARITY Act.

cryptonews.ru24m ago

Analyst: Bitcoin's Price Will Drop to $60k in August, Then Rebound to $70k

cryptonews.ru24m ago

Trading

Spot
活动图片