Hello everyone, I'm your old friend, Cody, an invited market analyst for Odaily. Before we begin today's Bitcoin market analysis, I'd like to say one thing:
Tomorrow is the first day of the Lunar New Year, so I'd like to take this opportunity to wish all our readers a happy Lunar New Year in advance.
The past year has seen constant market fluctuations, with periods of smooth sailing and tests of repeated volatility. Regardless of the investment results this year, I hope that in the new year, all readers can maintain stable mentality, clear rhythm, and controlled risks.
Cody also sends his most sincere wishes:
Wishing you all immediate success and immediate blessings in the new year, with accounts always in the green and families safe and sound.
The holiday is brief, but the market never stops.
Returning to the market itself, during this special time window of the Spring Festival, some noteworthy changes are occurring in Bitcoin's price structure, capital behavior, and market sentiment.

Trading Weekly Report Core Summary:
• Updated Trend Structure: Analysis of the internal C-2 wave within Bitcoin's declining C wave, and interpretation of the future C-3 wave decline structure after the rebound ends. (Detailed explanation see Figure 1)
• Strategy Execution (Short-term) Effectiveness Verification: Last week's operations strictly followed the established short-term strategy, completing two short-term trades (1x leverage), successfully achieving a cumulative return of approximately 4.01%. (Detailed explanation see Table 1)
• Strategy Execution (Medium-term) Effectiveness Verification: Last week followed the established medium-term strategy, continuing to hold the short position built at $89,000 (1x leverage). As of last week's close, the profit was approximately 22.71%, with a maximum profit during the period of about 32.58%.
• Core View (Short-term) Verification: Last week, Bitcoin found support near $65,000 and transitioned into a volatile rebound. Multiple technical signals collectively indicated that this level could be the low of the C-1 wave. The current price action aligns with the previous expectation of an oversold rebound in the C-2 wave, with the market structure gradually transitioning into a repair phase.
The following will provide a detailed review of market predictions, strategy execution, and specific trading processes.
I. Detailed Explanation of the Three-Segment Adjustment Structure Inside Bitcoin's C Wave
Bitcoin Daily K-Line Chart
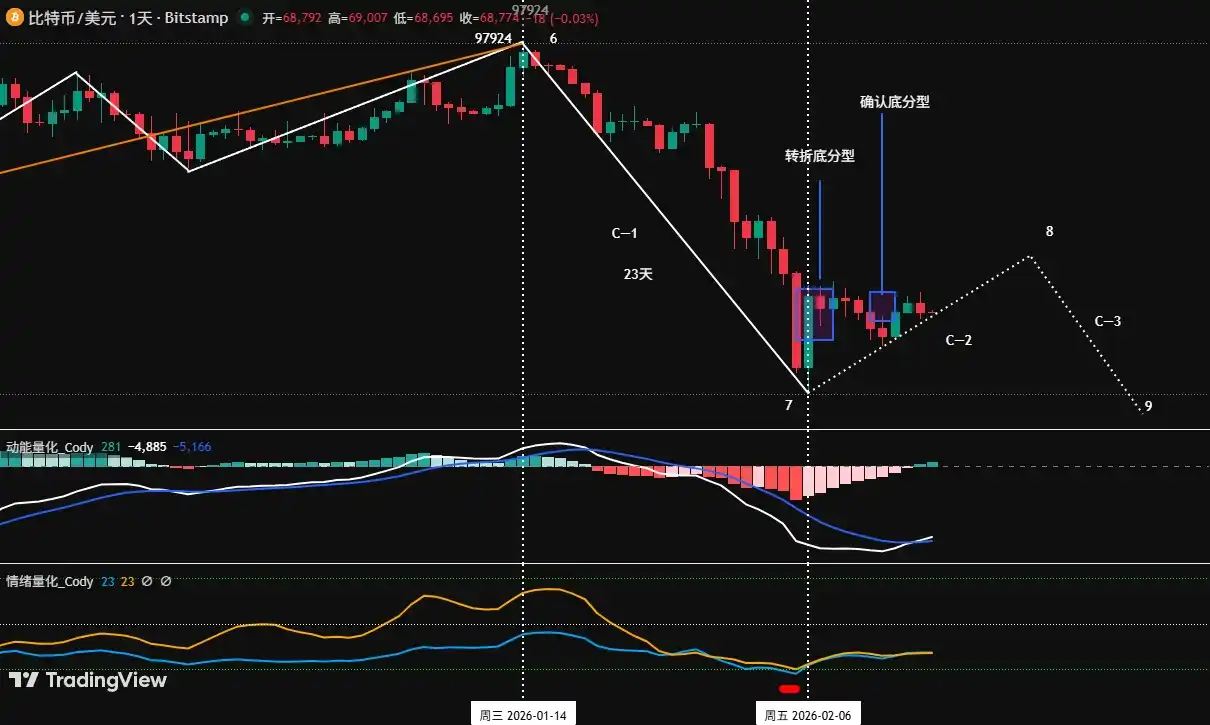
Figure 1
As clearly pointed out in the weekly review on February 8th, Bitcoin's adjustment since the high on October 6, 2025, follows the classic A-B-C three-wave structure, and several possible subsequent internal wave structures for the C wave were projected. Currently, given that both the A and B waves internally show clear three-segment wave structures, according to the principles of alternation and consistency in Elliott Wave Theory, the probability is highest that the C wave will also complete its adjustment internally with a three-segment structure (i.e., C-1, C-2, C-3).
Below, we will provide a detailed analysis of the possible three-segment adjustment wave structure inside the C wave:
1. Overview of the C Wave Main Decline Segment
• Time and Magnitude: The C wave began on January 14, 2026, and has run for about 32 days as of the time of analysis, with a maximum decline of 38.7%. This conforms to the characteristic of the C wave as the "main declining wave," usually having the largest magnitude and fierce momentum.
2. C-1 Wave: Segment 6–7 in the chart, first driving decline (completed)
• This decline lasted from January 14th to February 6th, spanning 23 days. The target was achieved, pushing the price down to near $60,000, forming the first "foot" of the C wave.
3. C-2 Wave: Segment 7–8 in the chart (dashed part), rebound correction segment (ongoing)
• Current Stage: The rebound starting from the low on February 6th can currently be defined as the C-2 wave.
• Technical Pattern Confirmation: On the daily chart, the K-line combination formed from February 5th to 8th constitutes a "reversal bottom pattern", initially suggesting exhaustion of downward momentum. Subsequently, the K-lines from February 11th to 13th further formed a "confirmed bottom pattern", enhancing the validity of February 6th as a short-term bottom. Currently, the price is oscillating upward along the short-term rising trendline connecting the lows of February 6th and 12th. If the market's trajectory changes later, I will share updates with everyone.
• Key Resistance Zone: Based on historical price action, the primary pressure zone for the C-2 rebound is around $74,500. This is not only the lower edge of the previous震荡中枢 (consolidation center) but also resonates with technical key points like the 50% Fibonacci retracement level of the A wave decline. A more important pressure zone is located around $79,500. This area is the dense trading zone (震荡中枢) formed during the previous C-1 decline and is expected to constitute strong resistance.
4. C-3 Wave: Segment 8–9 in the chart (dashed part), final decline segment (may occur in the future)
• Technical Pattern Confirmation: On the daily chart, a decisive break below the short-term rising trendline connecting the February 6th and 12th lows by the future coin price might be a key condition for judging the formation of the C-3 wave.
• This adjustment segment will need to break below the February 6th low (approx. $60,000) to achieve wave pattern completeness. The timing and space of the final decline will be determined by the strength and height of the C-2 wave rebound.
5. Core View Summary:
The market is currently in the expected C-2 wave rebound stage. The strength and height of this rebound, particularly whether it effectively breaks through the core resistance band of $74,500~$79,500, will be a critical observation window for judging the subsequent force and target of the C-3 wave decline. Traders should closely monitor the market reaction near the aforementioned price levels.
II. Review of Last Week's Bitcoin Operation Strategy and Key Levels: (02.09~02.15)
1. Short-term Operation Strategy Review: As shown in (Figure 2)
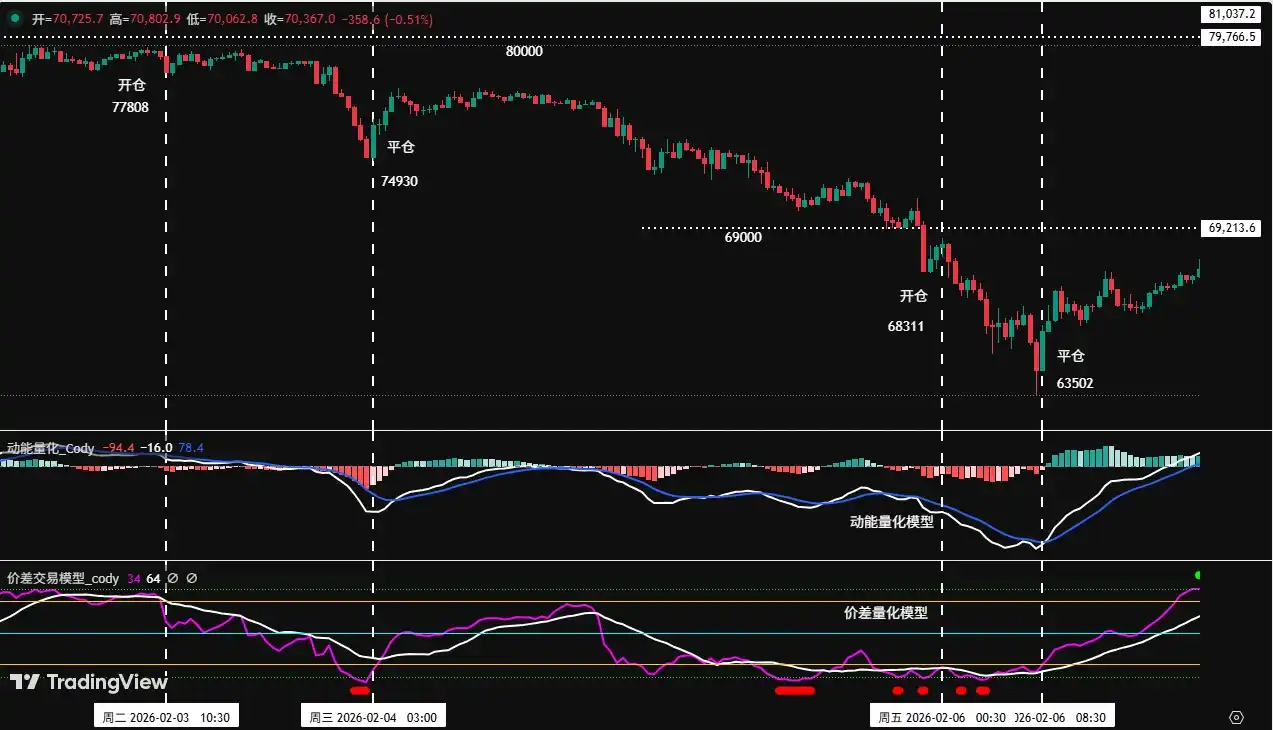
We strictly followed the trading signals issued by our self-constructed Spread Trading Model and Momentum Quantification Model, combined with predictions of market trends, and completed two short-term operations, achieving a cumulative profit of 4.01%.
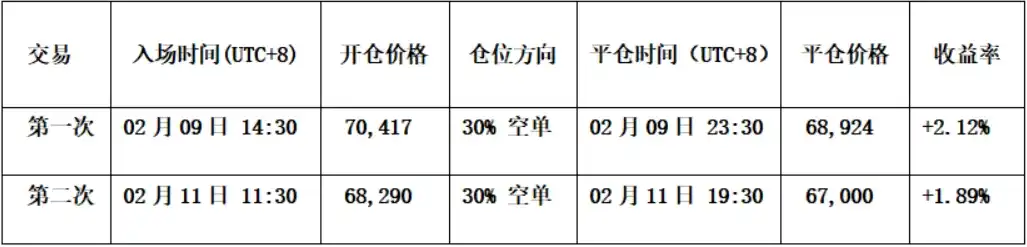
Figure 2
• First Trade (Profit 2.12%):
• Entry: The coin price rebounded to near the $72,500 pressure line and encountered resistance. Simultaneously, the Spread Quantification Model triggered a top warning signal (green dot), and the Momentum Quantification Model issued a "turn from long to short" signal. Therefore, a 30% short position was established at $70,417.
• Risk Control: Initial stop-loss for the short position was set at $74,500.
• Closing: When it fell to around $68,000, the K-line combination showed bottom signals,叠加 resonance signals from both models at the bottom, we closed all positions at $68,924.
• Second Trade (Profit 1.89%):
• Entry: The coin price rebounded to near the short-term descending trendline and showed resistance signals. Simultaneously, the momentum line of the Momentum Quantification Model made another "death cross" turning short below the zero axis. A 30% short position was established at $68,290.
• Risk Control: Initial stop-loss for the short position was set at $70,000.
• Closing: It encountered resistance near $66,500,叠加 resonance signals from both models at the bottom, all positions were closed at $67,000.
Bitcoin 30-minute K-Line Chart: (Momentum Quantification Model + Spread Trading Model)
2. Medium-term Operation Strategy Review:
Medium-term Strategy: Continued to hold the 60% short position established near $89,000 as planned. As of last week's close, the profit was 22.71%.
3. Core Level Review:
Resistance levels watch the $72,000~$74,500 area;
Support levels watch the $60,000~$62,500 area.
III. Analysis of Current Bitcoin Market Technical Indicators: Comprehensive Judgment Based on Multiple Models and Dimensions
Combining market movements, based on my self-constructed trading system, I conduct an in-depth analysis of multiple technical indicators for Bitcoin from aspects such as multiple models and multiple dimensions.
1. As shown in (Figure 3), analysis from the weekly chart:
Bitcoin Weekly K-Line Chart: (Momentum Quantification Model + Sentiment Quantification Model)
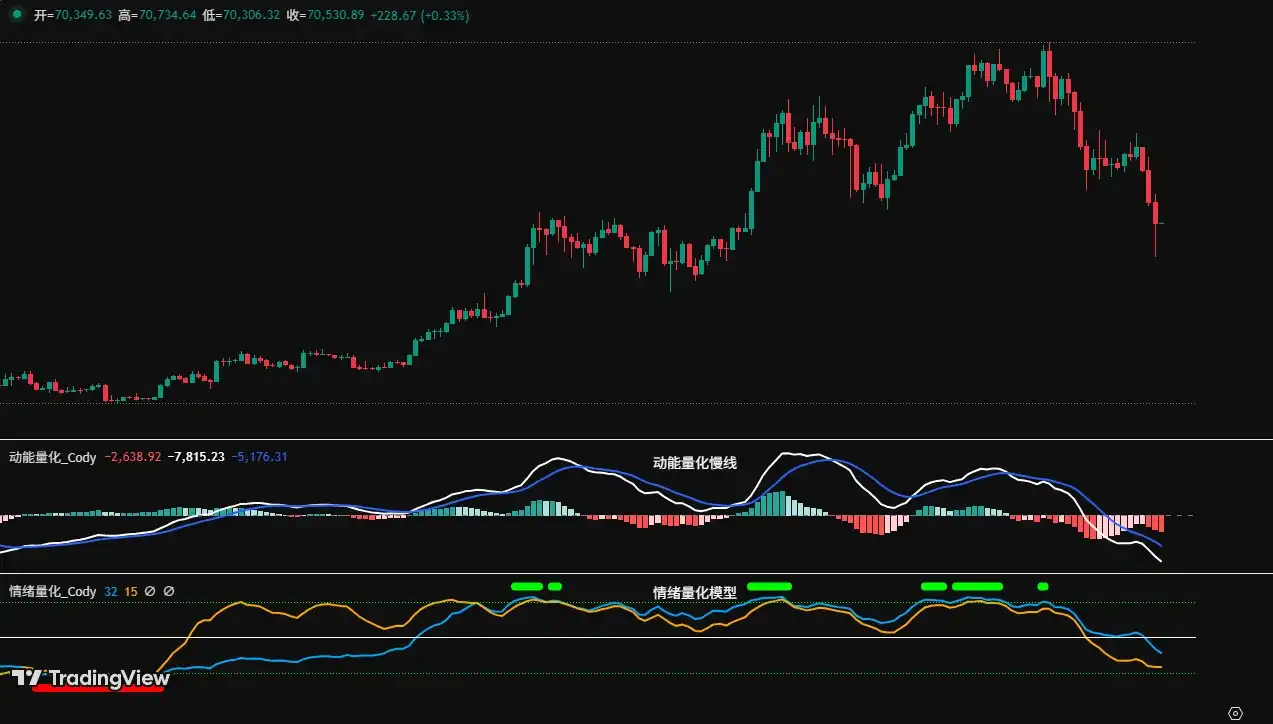
Figure 3
• Momentum Quantification Model: Technical indicators show the momentum line declining synchronously, negative energy bars are still放大 (expanding), but the expansion force is weakening, with no momentum divergence signal appearing.
Momentum Quantification Model indicates: Coin price decline index: High
• Sentiment Quantification Model: Blue sentiment line value 34, intensity zero; yellow sentiment line value 10, intensity zero, peak value is 0.
Sentiment Quantification Model indicates: Coin price bottom support index: Neutral
• Digital Monitoring Model: Bottom digital monitoring signal has not appeared.
Digital Monitoring Model indicates: Digital bottom signal not appeared; Weekly K-line closed as a small bearish candle with upper and lower shadows, decline about 2.15%.
The above data suggests: Bitcoin weekly chart bearish trend, decline narrowing. Currently属于 (belongs to) a falling mid-way pattern.
2. As shown in (Figure 4), analysis from the daily chart:
Bitcoin Daily K-Line Chart: (Momentum Quantification Model + Sentiment Quantification Model)
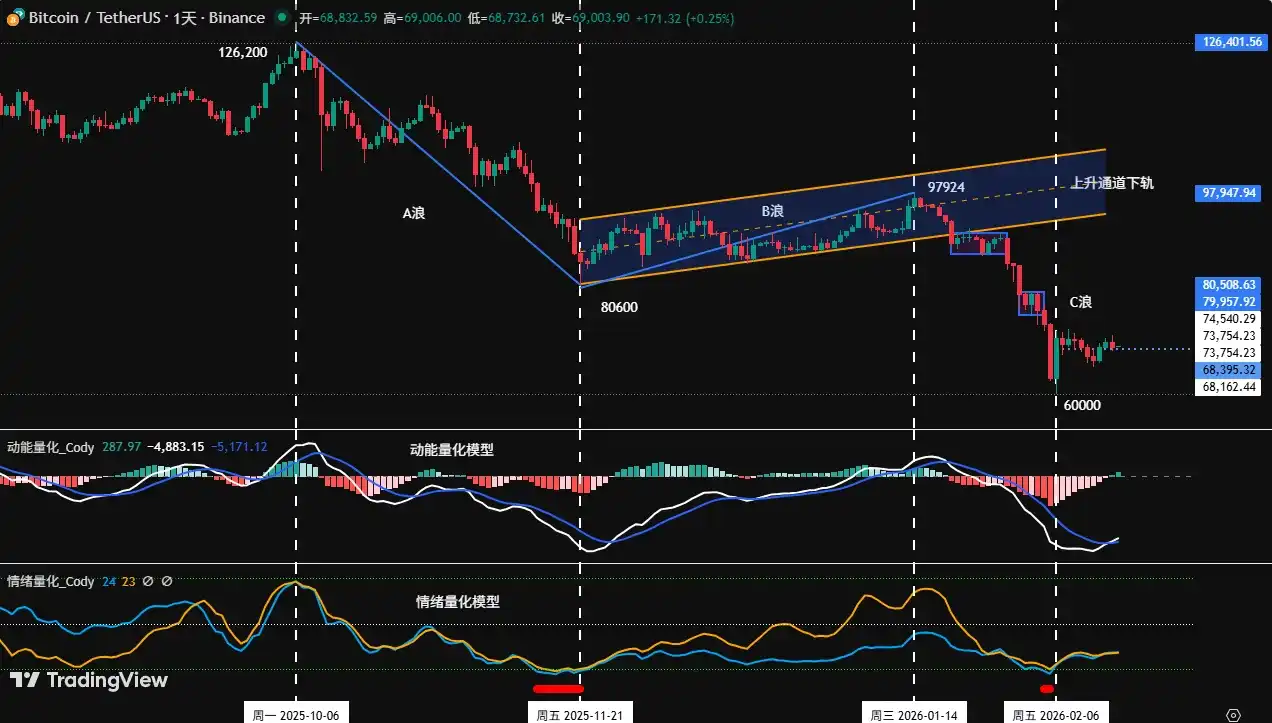
Figure 4
• Momentum Quantification Model: Last week's overall performance was a "first suppress then rise" pattern. Post Sunday session, the momentum line formed its first "golden cross" below the zero axis,同时 (simultaneously) the energy bars "turned from negative to positive".
Momentum Quantification Model indicates: Long momentum is beginning to accumulate, short-term trend is expected to gradually strengthen.
• Sentiment Quantification Model: After the sentiment model triggered a bottom warning (red dot), the two sentiment lines began to拐头向上 (turn upward). Post Sunday session, the sentiment lines left the oversold area and turned to slowly rise.
Sentiment Quantification Model indicates: The timeliness of the bottom warning signal has been verified by the market, sentiment lines are slowly turning upward, and oversold market sentiment is being repaired.
The above data suggests: The daily level bearish trend has not changed. The current price action属于 (belongs to) an oversold rebound nature. Currently, a small-scale rebound can be seen, please control short-term long positions carefully.
IV. This Week's Market Prediction: (02.16~02.22)
1. Core View for the Week: The C-2 wave rebound行情 (market condition) has most likely formed. Pay attention to the performance of the多空争夺 (long-short battle) when the coin price rebounds to the core pressure area.
• For investors who participated in this short-term rebound, the strategy should be to "take profits on rallies, lock in gains";
• For investors who were previously trapped, they should resolutely implement "reduce positions on rallies, operate滚动 (rolling operation), control risks".
2. Core Resistance Levels:
• First Resistance Area: $72,000-$74,500 area (near last April's low)
• Second Resistance Area: $79,500-$80,600 area (near the B wave starting point)
3. Core Support Levels:
• First Support Level: Near $65,000 (low of previous K-line bottom pattern)
• Second Support Level: $60,000-$62,500 area (near the February 6th low)
• Third Support Level: Near $57,400 (near the 210-week moving average)
V. This Week's Operation Strategy (Excluding Impact of Sudden News): (02.16~02.22)
1. Medium-term Strategy: Maintain 60% short position. If the rebound effectively breaks above $74,500, reduce the position to 40%.
2. Short-term Strategy: Use 30% of position, set stop-loss points, look for "spread" opportunities based on support and resistance levels. (Use 30/60 minutes as the operation cycle).
3. Since the medium-term market direction is bearish, short-term operations should follow the principle of "go with the trend, go short on rallies". To dynamically respond to the complex evolution of the market and combine with signals from the self-built trading model, we have formulated A/B two sets of short-term operation plans:
• Plan A: If the coin price rebounds to the $72,500~$74,500 area and encounters resistance:
• Entry: When the rebound reaches this area triggering resistance signals combined with model top signals, a 15% short position can be established.
• Risk Control: Initial stop-loss for the short position is set 1.5% above the entry price (i.e., 1.015 * entry price).
• Closing: When it falls near important support levels combined with model signals, gradually close positions to take profits.
• Plan B: If the coin price rebounds to the $79,500~$80,600 area and encounters resistance:
• Entry: When the rebound reaches this area encountering resistance combined with model top signals, a 30% short position can be established.
• Risk Control: Initial stop-loss for the short position is set 1.5% above the entry price (i.e., 1.015 * entry price).
• Closing: When it declines to support levels combined with model signals, gradually close positions to take profits.
VI. Special Notes:
1. When opening a position: Immediately set the initial stop-loss level.
2. When profit reaches 1%: Move the stop-loss to the entry cost price (breakeven point), ensuring capital safety.
3. When profit reaches 2%: Move the stop-loss to the position of 1% profit.
4. Continuous tracking: Thereafter, for every additional 1% profit, move the stop-loss同步 (synchronously) by 1%, dynamically protecting and locking in profits.
Financial markets change rapidly, all market analysis and trading strategies need dynamic adjustment. All views, analytical models, and operational strategies involved in this article are derived from personal technical analysis, for personal trading log purposes only, and do not constitute any investment advice or operational basis. The market has risks, investment needs caution, please do not make decisions based on this.





