Market Plunges into Extreme Panic, Five Major Data Indicators Reveal BTC Buying Signals

比推Published on 2026-02-02Last updated on 2026-02-02

Abstract

The cryptocurrency market is experiencing extreme fear, with Bitcoin (BTC) dropping to $75,700 and Ethereum (ETH) to $2,220, causing $435 million in liquidations. A survey of 1,189 investors revealed that 45.6% believe BTC’s 2026 bottom will be between $75,000–$85,000, while 30.2% see it at $60,000–$75,000. Nearly half of respondents (47.2%) plan to DCA and hold long-term. Key on-chain metrics from Glassnode indicate potential support levels: the short-term holder cost basis is $95,400, the active investor average is $87,300, the realized price is $80,500, and the network-wide average cost basis is $55,900. The ahr999 indicator, which recently fell below 0.45 for the first time since October 2023, suggests a buying opportunity below $76,000. Analyst Willy Woo’s CVDD model points to a hard bottom near $45,000, while the cost basis of large holder “Strategy” ($76,040) is seen as a critical support level. Overall, data suggests a potential bottom formation between $45,000–$76,000.

Author: Ma He, Foresight News

Original Title: 5 Major Data Indicators Revealed: Is There a BTC Buying Signal Below $75,000?


Wintermute stated last week that $85,000 is a key level for BTC and that a direction would be chosen soon. Unfortunately, the direction was not upward but sharply downward.

On February 2, BTC fell to $75,700, and ETH dropped to $2,220. Numerous altcoins continued to decline. Regarding liquidation data, Coinglass data shows that $435 million was liquidated in the past 12 hours, with long positions accounting for $324 million.

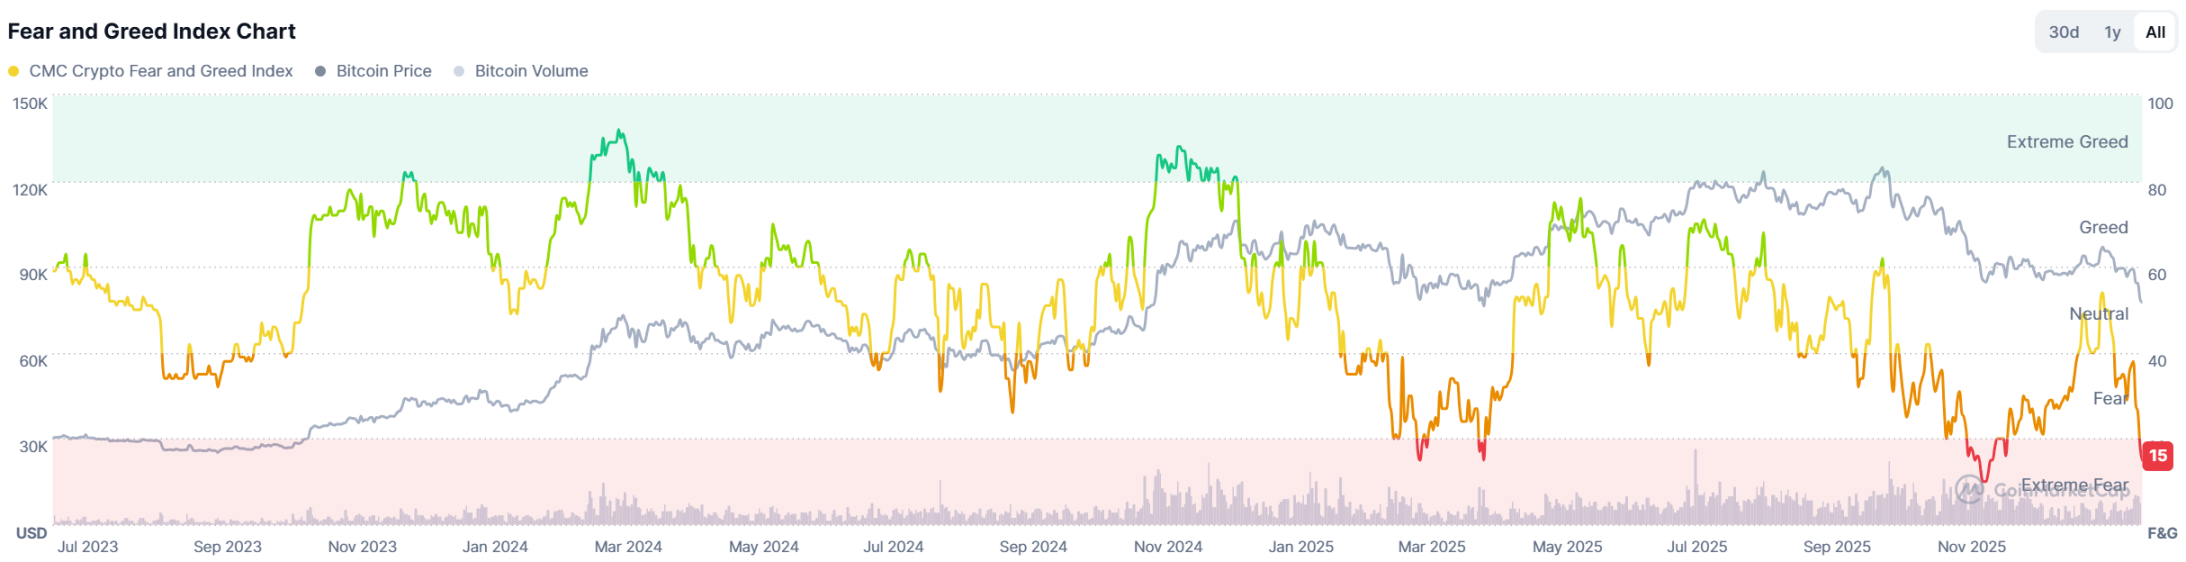
The market fear index is 15, indicating that market sentiment has once again fallen into extreme panic.

After the market turned bearish, where is BTC's bottom range? Five major data indicators reveal the answer.

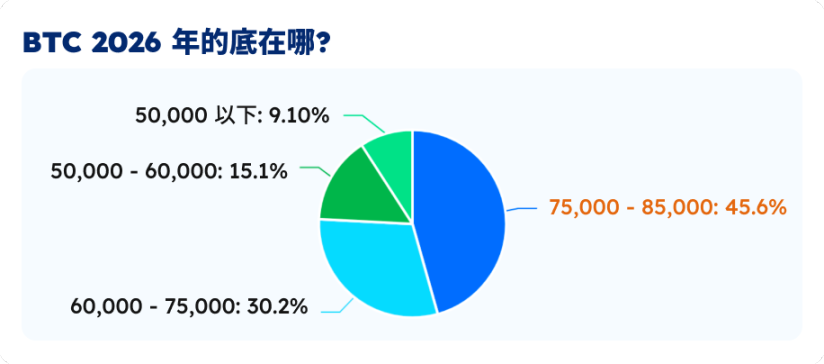
Data Survey: 30% of Users Believe BTC's Bottom Range Is Between $60,000 and $75,000

On January 30, Foresight News conducted an investor market confidence survey. At the time of the survey, BTC was priced at $84,000. It has since fallen significantly over the following days, so the survey results are for reference only.

The poll (with 1,189 participants) showed that most respondents (45.6%) believe BTC's bottom price in 2026 will be between $75,000 and $85,000. Another 30.2% of respondents believe the bottom price will be between $60,000 and $75,000.

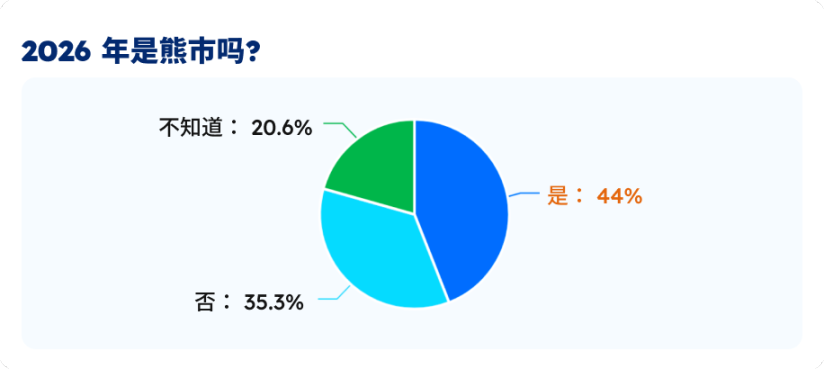
44% of respondents believe 2026 will be a bear market, while 35.3% disagree and do not think it will be a bear market. Another 20.6% of respondents are uncertain.

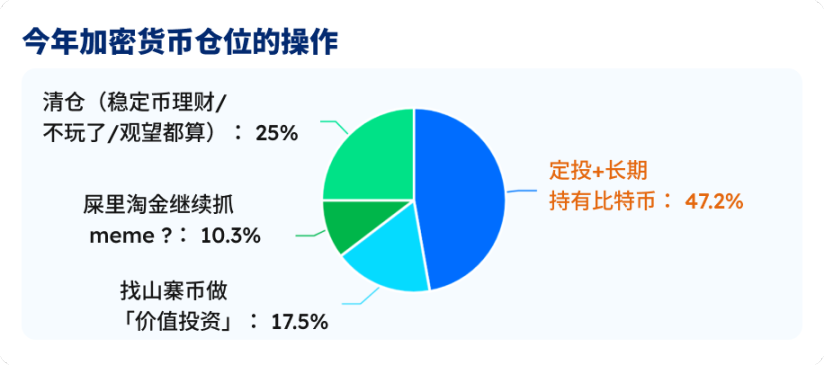
Nearly half of the respondents (47.2%) choose to dollar-cost average and hold Bitcoin long-term. Another 25% of respondents choose to liquidate their positions and switch to stablecoin investments or wait and see. 17.5% of respondents are looking for altcoins for value investing.

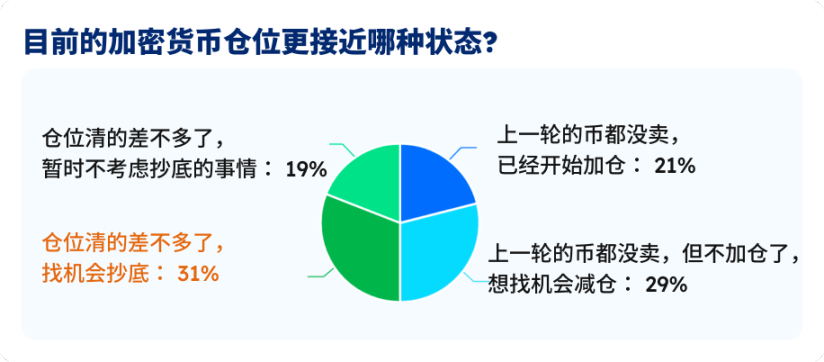
Currently, among the voting respondents, 31% say they have mostly cleared their positions but are still looking for opportunities to buy the dip. 29% say they haven't sold their holdings from the last cycle but are not adding positions for now and are looking for opportunities to reduce them. 21% say they haven't sold their holdings from the last cycle and have already started adding positions.

Glassnode Shows BTC's On-Chain Cost Basis Is $55,900

As Bitcoin falls below $78,000, Glassnode has updated the key on-chain price distribution as follows: The STH (Short-Term Holder) cost basis, reflecting the average holding price of new buyers/traders who entered the market in recent months, is $95,400.

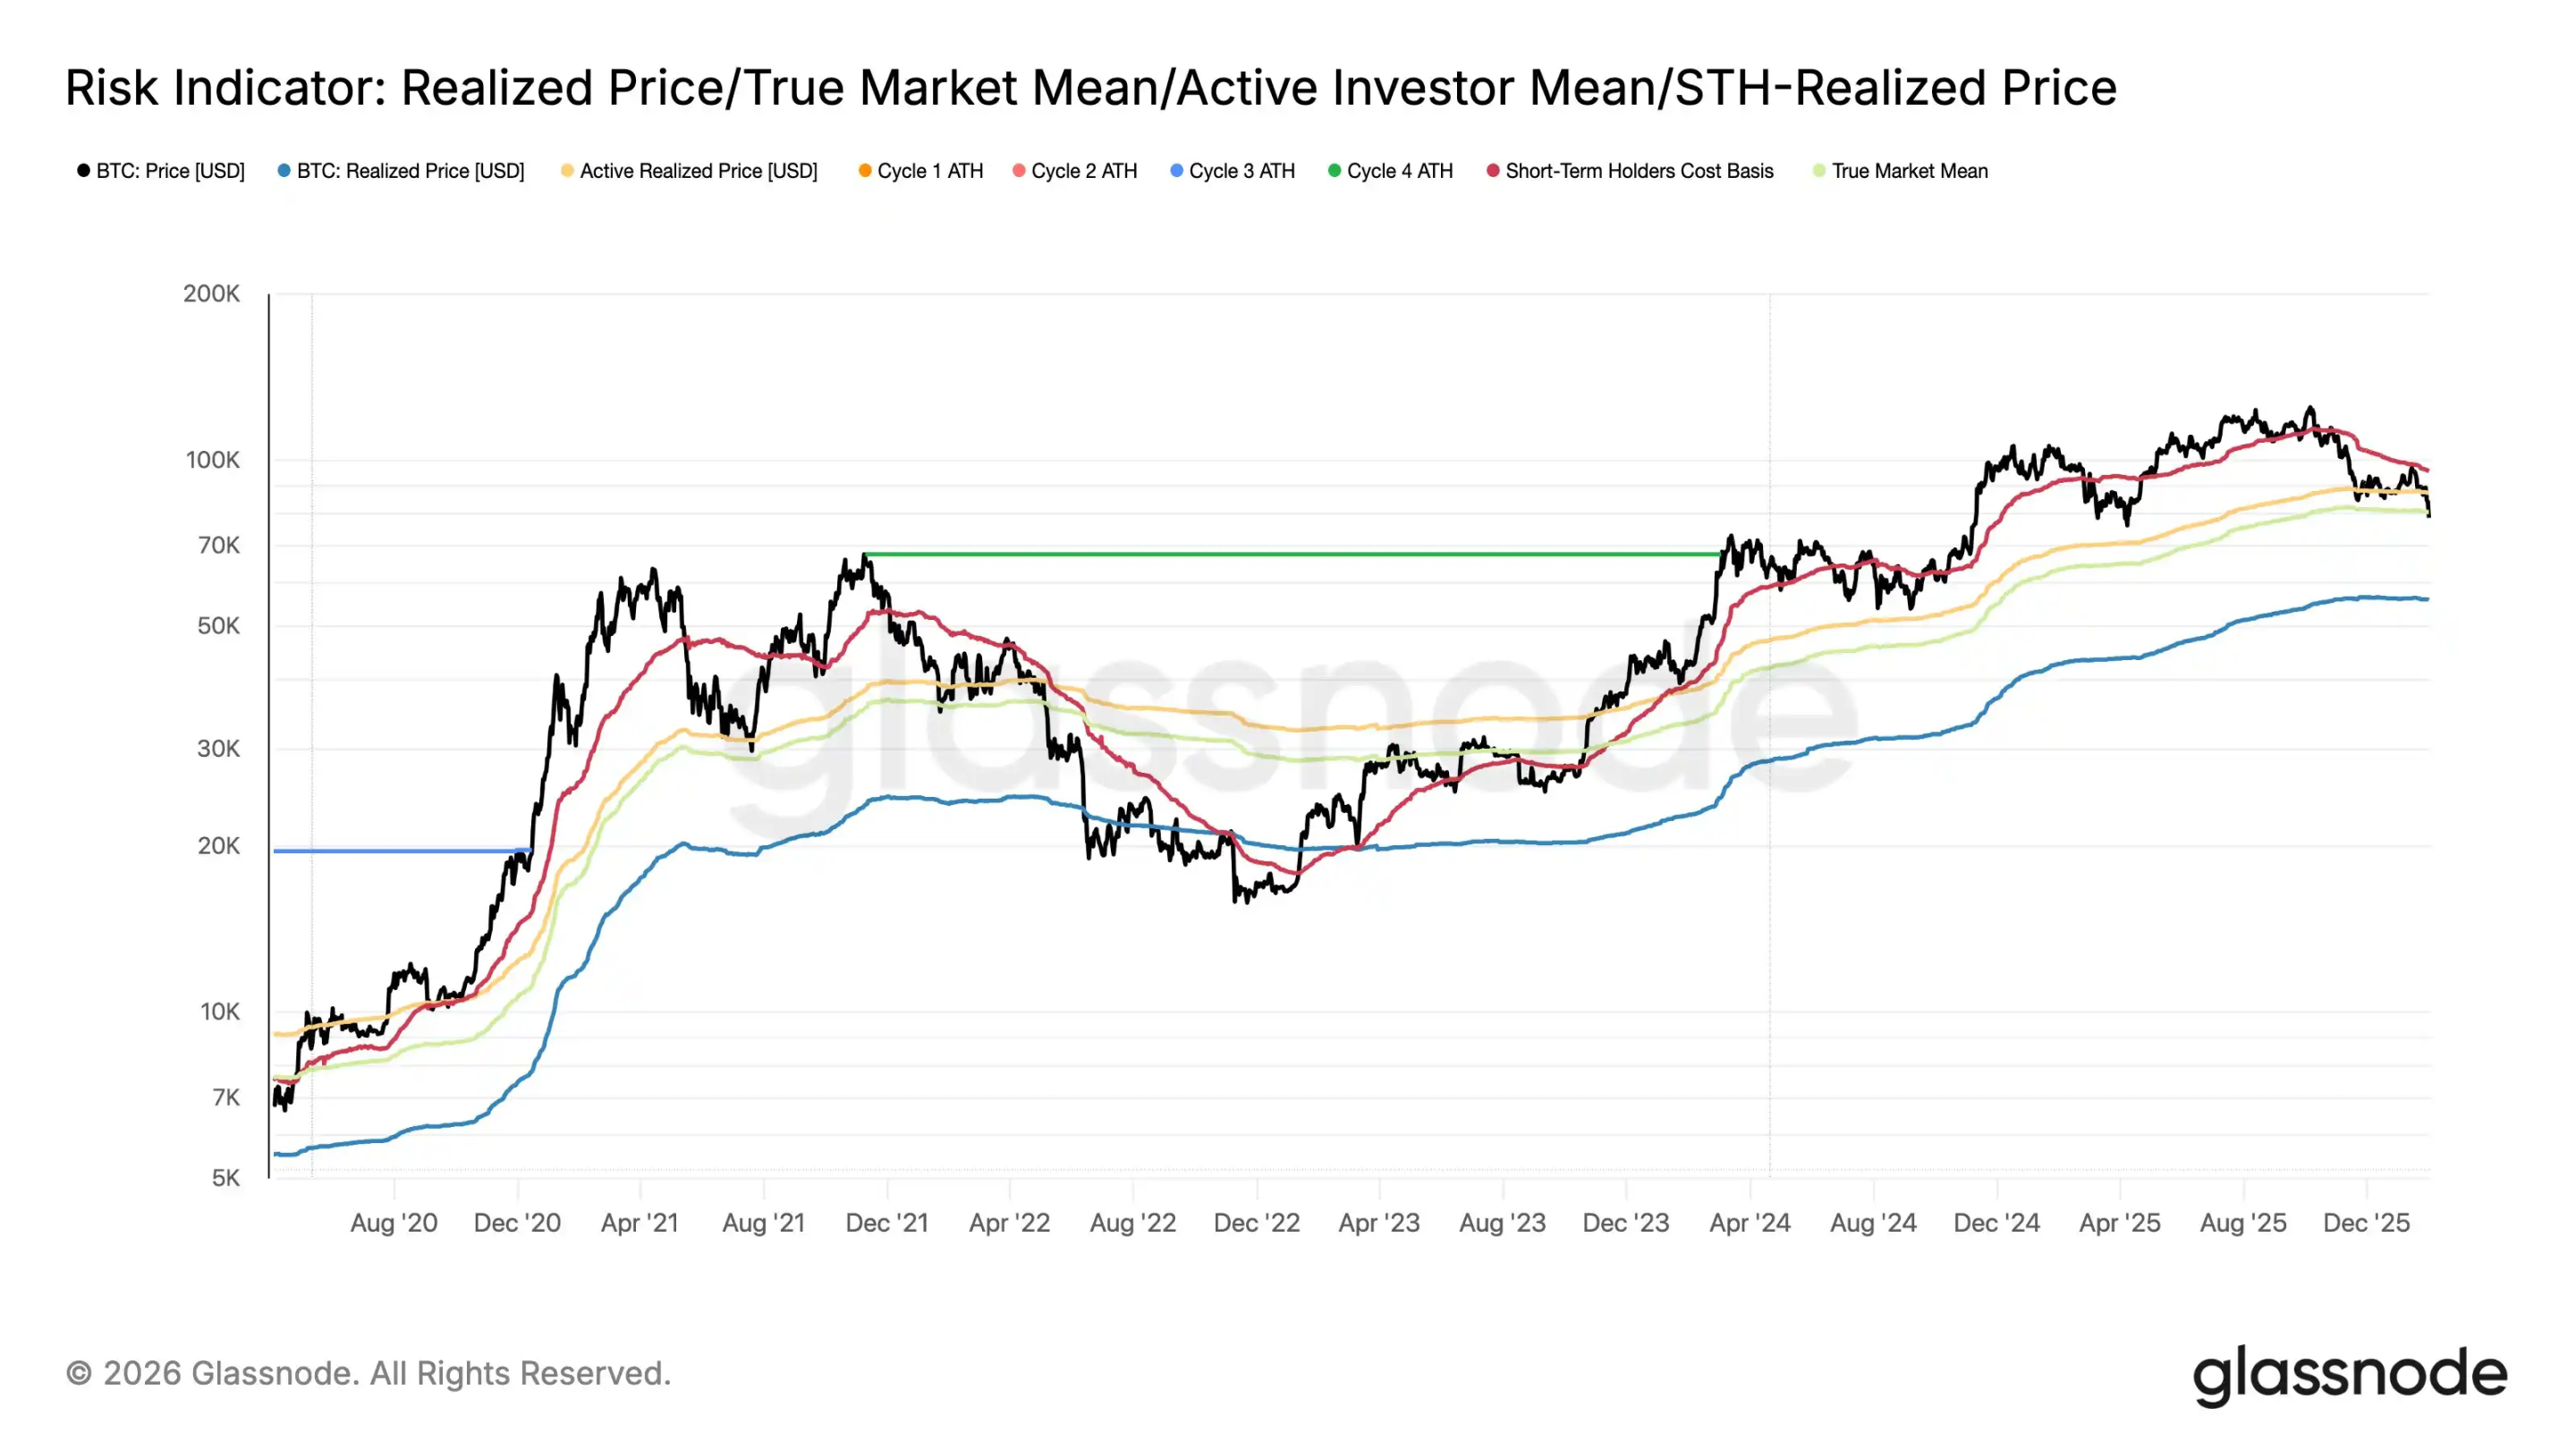
The average investment of active investors, representing the average holding cost of traders currently "on the field," is $87,300; the Realized Price, focusing on the cost basis of actual traders in the secondary market, is $80,500. The Coin Price, representing the average cost basis of all coins across the entire network, is $55,900.

This means that when the BTC price is below $80,500, your purchase price is lower than the cost price of other recent traders. If BTC falls below $55,900, it means your purchase price is already below the average cost of the entire network.

In the 2022 cycle, the BTC price once fell below the entire network's average cost basis. In this cycle, influenced by macro liquidity, spot ETFs, and other factors, whether BTC will fall below $55,900 remains unknown.

Ahr999 Indicator Shows Accumulation Signal

The ahr999 indicator was invented years ago by Weibo user ahr999 to evaluate BTC's short-term returns and price deviations. The calculation formula is (Current Price / 200-day Dollar-Cost Average) × (Current Price / Exponential Growth Valuation), where the exponential growth valuation is based on a fitting curve of historical prices and block height, representing the long-term "fair value." Historical experience shows: ahr999 < 0.45 is the low-price buying zone; 0.45-1.2 is suitable for dollar-cost averaging; >1.2 is the high-price zone.

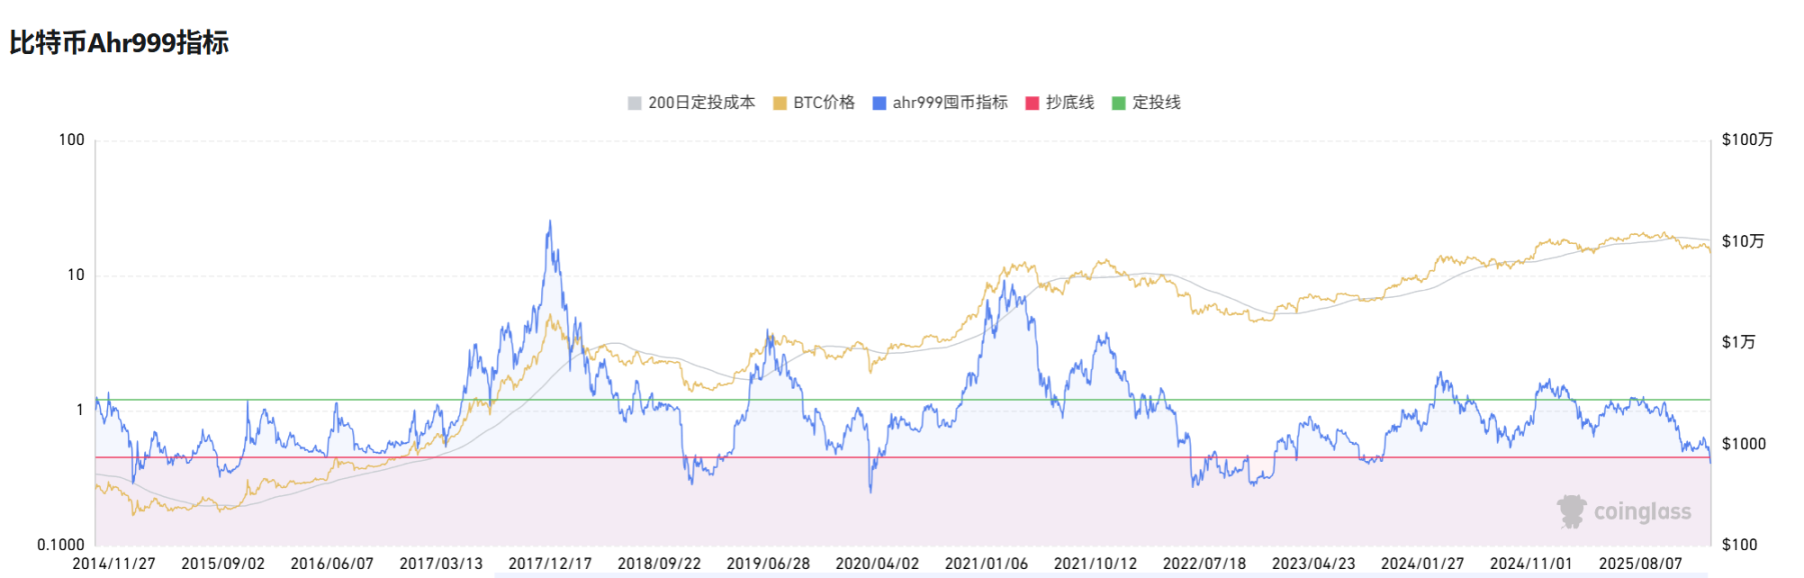
On February 1, 2026, ahr999 fell below 0.45 for the first time, the first occurrence in 839 days since October 16, 2023, marking a potential market bottom. The current break below the threshold suggests the BTC price is significantly below long-term growth expectations, similar to the end of the 2023 bear market. This signal strongly suggests buying the dip, but it needs to be confirmed with trading volume to avoid false breakouts. Buying strategy: If ahr999 stabilizes below 0.45, consider buying in batches below $76,000, and reduce positions when it rebounds above 1.2.

Willy Woo Indicator Shows BTC's Hard Bottom Is $45,000

The indicator developed by renowned analyst Willy Woo is the CVDD model. "When Bitcoin transfers from an old investor who bought at $1 to a new investor who buys at $100,000, the new investor will value these Bitcoins with a higher floor price, which helps raise the perceived floor price of the entire Bitcoin supply globally. Active custodian rotation (i.e., frequent transfers of Bitcoin between different investors or custodians) may also indicate that investors value these Bitcoins highly."

When many whales transfer BTC to new Bitcoin wallet addresses, the market's bottom price is rising.

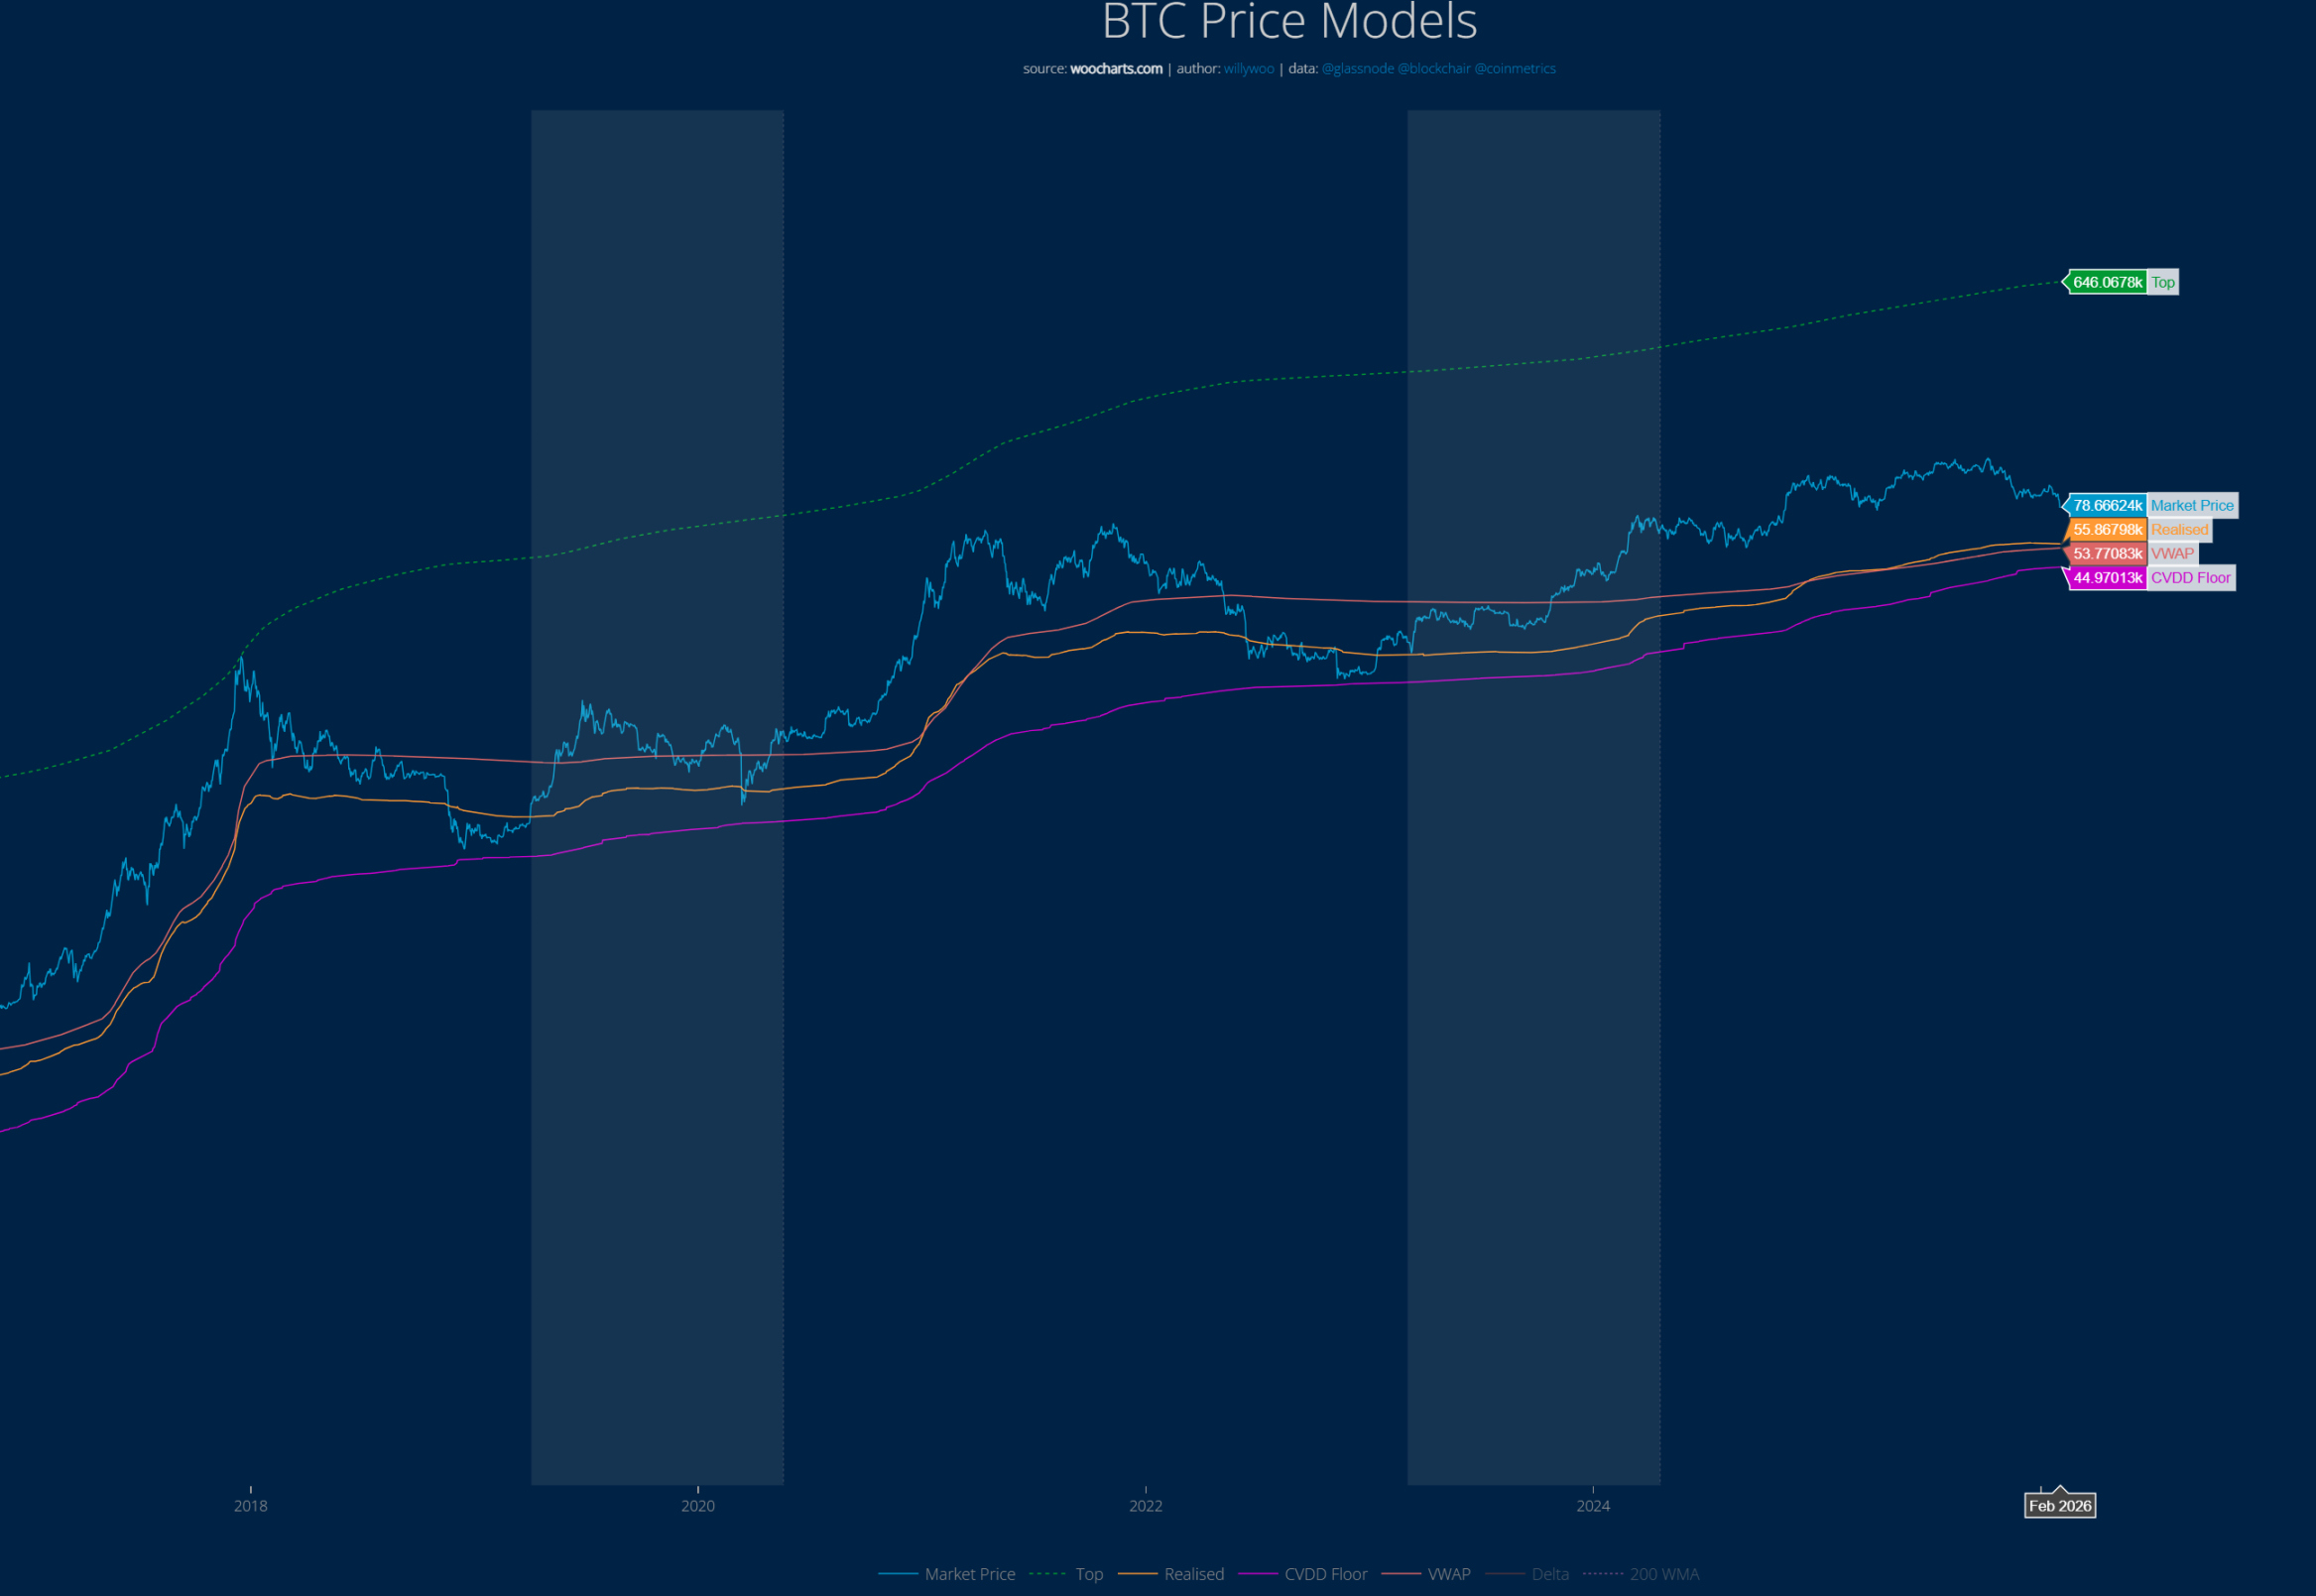
The BTC price has never fallen to the red line (CVDD model). Currently, the CVDD indicator shows a hard bottom of approximately $45,000. In past cycles, BTC once fell below the yellow line in the chart, which currently ranges from $53,000 to $56,000.

Strategy's Bitcoin Cost Price Is $76,040

As of February 2, the well-known Bitcoin accumulation大户 (large holder) Strategy holds a total value of approximately $54.2 billion, with 712,647 BTC. Their average holding cost is about $76,040.

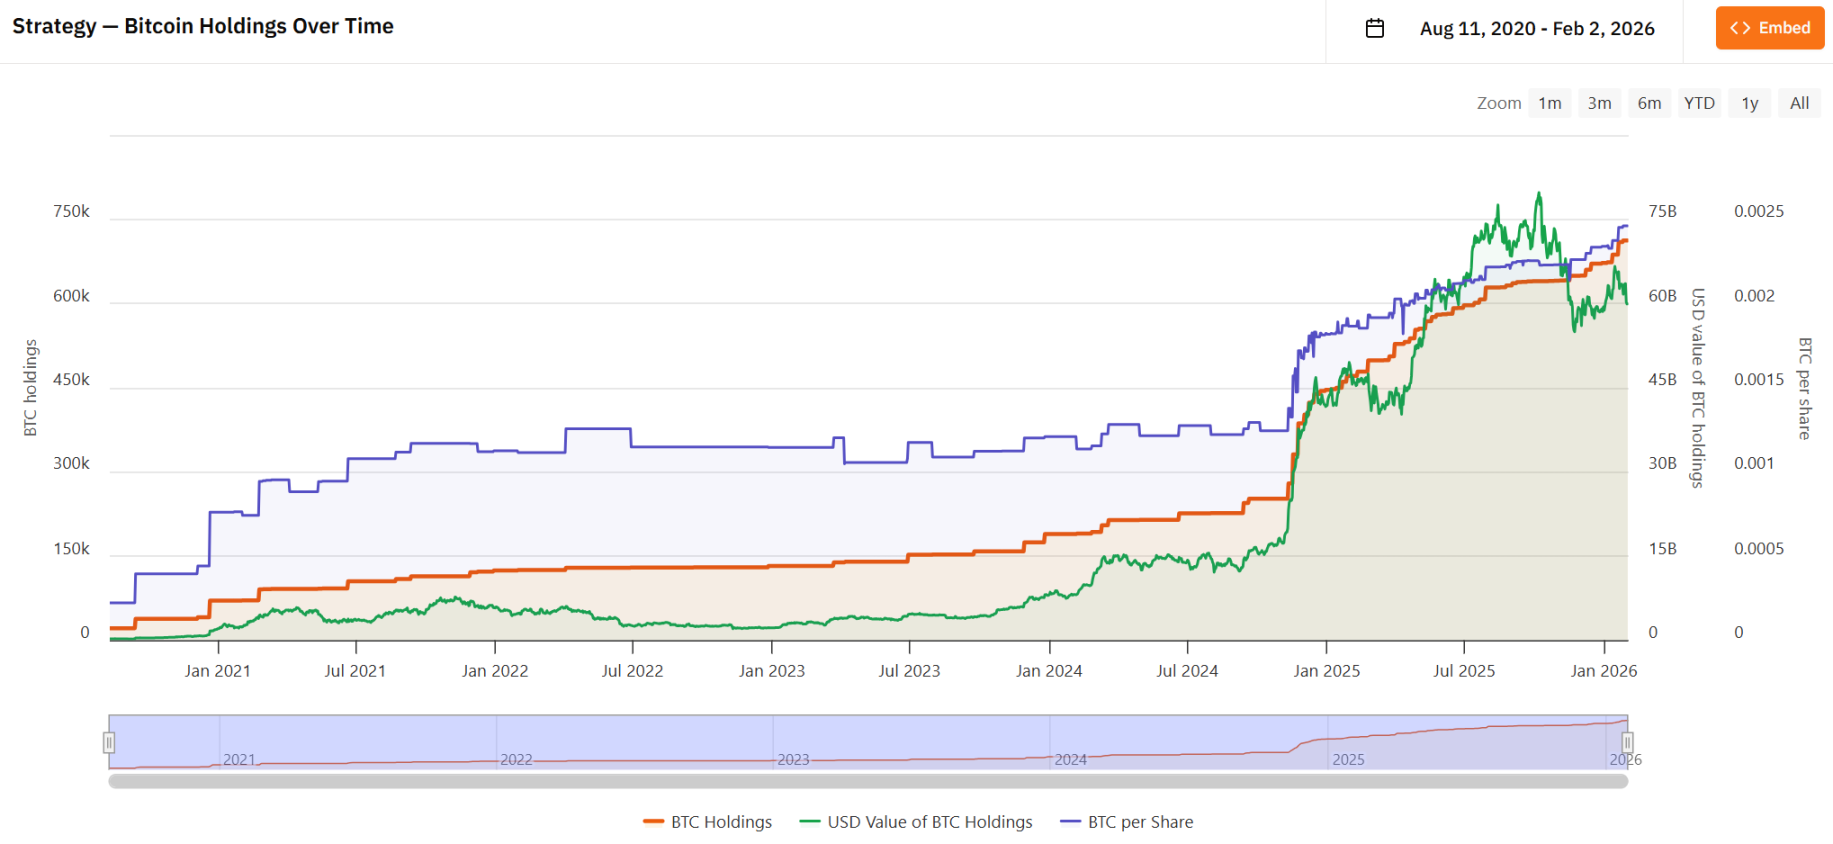
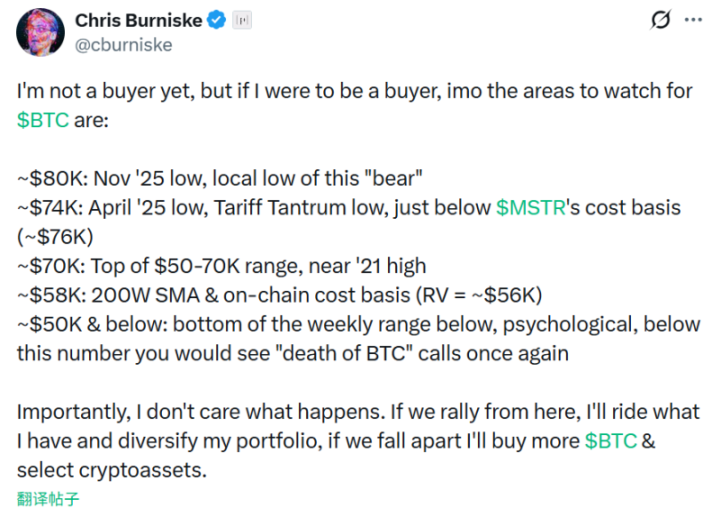
Historically, the area below this average cost has been the bottom range. Placeholder partner Chris previously stated that the $74,000 to $76,000 range is a price line worth paying close attention to.


Twitter:https://twitter.com/BitpushNewsCN

Bitpush TG Discussion Group:https://t.me/BitPushCommunity

Bitpush TG Subscription: https://t.me/bitpush

Original link:https://www.bitpush.news/articles/7608002

Related Questions

QWhat is the current market sentiment according to the Fear & Greed Index mentioned in the article?

AThe market sentiment is at 'Extreme Fear', with a Fear & Greed Index reading of 15.

QAccording to the ahr999 indicator, what is the signal for a potential market bottom and when did it last occur?

AThe ahr999 indicator falling below 0.45 is a signal for a potential market bottom. This last occurred on February 1, 2026, which was the first time in 839 days since October 16, 2023.

QWhat is the 'iron bottom' price for Bitcoin as indicated by Willy Woo's CVDD model?

AWilly Woo's CVDD model indicates an 'iron bottom' price for Bitcoin at approximately $45,000.

QWhat is the average on-chain cost basis for the entire Bitcoin network, as provided by glassnode?

AThe average on-chain cost basis for the entire Bitcoin network is $55,900.

QWhat price range did the majority of respondents in the Foresight News survey believe would be the bottom for BTC in 2026?

AThe majority of respondents (45.6%) believed the bottom price for BTC in 2026 would be in the range of $75,000 to $85,000.

Related Reads

Has the 'Digital Gold' Narrative for BTC Failed?

**Title: Has the "Digital Gold" Narrative for Bitcoin Failed?** The article argues that Bitcoin's "digital gold" narrative remains valid despite a recent sharp price decline (from a peak near $126k in Oct 2025 to briefly under $61k in Feb 2026). It presents a long-term investment framework based on three core points: **1. Viewing Bitcoin as an Asset:** Bitcoin is presented as a superior potential store of value compared to gold. Key arguments are its absolute scarcity (21 million cap), superior portability, and transparent auditability via its public ledger. While acknowledging its current use in early, volatile stages (~3-4% global adoption), the author draws parallels to the early, disruptive phases of the internet and e-commerce. **2. Understanding the Recent Downturn:** The current ~50% correction is framed as a predictable, consensus-driven cycle following its post-halving peak (the 2024 halving preceded the Oct 2025 high). A crucial factor is a historic "changing of hands": the influx of new institutional buyers via ETFs allowed early, low-cost holders (miners, OG believers) to take profits. The author notes that while severe, Bitcoin's historical drawdowns (e.g., 93% in 2011, 77% in 2021-22) have been progressively smaller, suggesting maturing holder structure and decreasing volatility over time. **3. The Long-Term Perspective:** The long-term thesis hinges on Bitcoin capturing a portion of gold's market value. With Bitcoin's market cap at ~$1.4 trillion (at $70k) versus gold's ~$20 trillion, significant upside potential exists if the "digital gold" narrative is partially realized. However, the author strongly cautions that short-term risks remain, the bottom is unpredictable, and high volatility is inherent. The real risk is not Bitcoin failing but poor personal position management (over-leverage, wrong capital) and a lack of deep understanding, which can force investors out during severe downturns. The conclusion uses Amazon's 95% crash post-2000 dot-com bubble and subsequent 42x recovery as an analogy. The ultimate question is not if Bitcoin's price will rise, but if an investor's strategy and conviction can withstand the volatility to see the long-term play out. The recent divergence (gold up, Bitcoin down) is posed not as a narrative failure, but as potential evidence of this ongoing, painful transition from a speculative asset to a mainstream allocation.

marsbit10h ago

Has the 'Digital Gold' Narrative for BTC Failed?

marsbit10h ago

Has BTC's 'Digital Gold' Narrative Failed?

The article discusses Bitcoin's "digital gold" narrative, its recent price drop, and long-term outlook through the perspective of "Jason". It argues the narrative is not a failure but that Bitcoin represents a superior, new asset class due to its fixed supply (21 million), portability, and auditability. The piece compares its current ~3-4% global adoption rate to early internet/e-commerce, suggesting significant growth potential. Regarding the 2025-2026 price decline (from ~$126k to briefly under $61k), the author views it as a predictable, consensus-driven sell-off within Bitcoin's ~4-year cycle post-halving, exacerbated by a major "handover" from early, low-cost holders to new institutional buyers via ETFs. A key observation is that historical peak-to-trough drawdowns have lessened over time (e.g., 93% in 2011 to ~50% in 2026), indicating maturing volatility as holder structure changes. For the long term, the author uses a simple framework: Bitcoin's total market cap (~$1.4T at $70k) is only about 7% of gold's (~$20T). Even capturing 30-50% of gold's value would imply substantial upside. However, the article strongly cautions against viewing this as investment advice, emphasizing extreme volatility and the critical importance of risk management, position sizing, and deep fundamental understanding to survive severe drawdowns. It concludes by drawing a parallel to Amazon's 95% crash in 2000 and subsequent 42x recovery, stressing that the key is surviving market cycles to realize long-term potential.

链捕手10h ago

Has BTC's 'Digital Gold' Narrative Failed?

链捕手10h ago

From Code to Cognition: A Ten-Thousand-Word Guide to the Evolution of the Robot Brain

"From Code to Cognition: The Evolution of Robot Brains" The journey of robotic intelligence has shifted dramatically from manually coded systems to AI-driven brains. For decades, robots relied on layered software stacks—perception, state estimation, planning, control—each handcrafted. While predictable, they lacked adaptability. The 2010s saw deep learning revolutionize perception (e.g., object detection) and control (via reinforcement learning), but learned skills remained narrow. The arrival of Large Language Models (LLMs) marked a turning point. LLMs acted as high-level planners, interpreting natural language instructions and generating sequences of actions for traditional robotic systems to execute. However, true integration came with Visual-Language-Action (VLA) models, which fused vision, language, and motion prediction into a single network. Pioneered by models like RT-2 and open-source projects like OpenVLA, VLAs enable robots to reason and act directly from visual input and commands. The most advanced humanoid robots now employ a "dual-brain" architecture: a slow-thinking, large VLA (System 2) for reasoning and planning, and a fast-reacting, small network (System 1) for high-frequency motion control, sometimes with an even lower-level System 0 for balance. This split balances cognition with the physics of real-time movement. Computation is split between onboard hardware (e.g., NVIDIA Jetson) for safety-critical control loops and cloud/edge servers for non-critical tasks like learning and interfaces. A crucial driver is the open-source ecosystem—models like GR00T and OpenVLA allow startups to build upon pre-trained brains and fine-tune them with their own data, accelerating development. Despite progress, current systems struggle with recovery from errors, sample inefficiency, and long-horizon tasks. This has spurred the rise of **World Models**—neural networks that predict the consequences of actions. By simulating possible futures before acting (like NVIDIA Cosmos or Meta V-JEPA), robots can plan, recover, and generalize better. This represents the next frontier: shifting intelligence from learned reactions to an internal model of physics and cause-and-effect. The field is rapidly evolving. While not yet at its "ChatGPT moment," the convergence of cheaper hardware, scalable simulation, and world models points toward robots that are increasingly capable, adaptive, and useful. The question is shifting from "what can robots do?" to "what *should* they do?"

marsbit10h ago

From Code to Cognition: A Ten-Thousand-Word Guide to the Evolution of the Robot Brain

marsbit10h ago

Trading

Spot
Futures
活动图片