Author: Insightful Commentary on Details
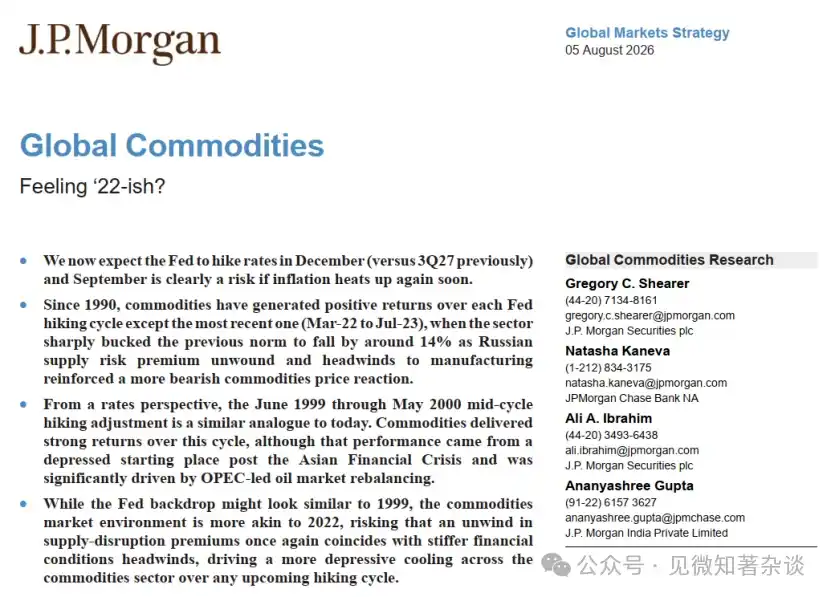
Morgan Stanley now expects the Fed to hike rates in December (previously expected in Q3 2027). If inflation heats up again soon, there is clearly a risk of a hike in September.
Since 1990, commodities have generated positive returns in every Fed hiking cycle, except for the most recent one (March 2022 to July 2023).
In that cycle, the sector dramatically broke from its prior pattern, declining by about 14%, as the Russian supply risk premium faded and intensifying headwinds for manufacturing exacerbated a more bearish reaction in commodity prices.
From an interest rate perspective, the mid-cycle hike adjustment from June 1999 to May 2000 resembles the current situation.
Commodities performed strongly in this cycle, though the performance started from a depressed base following the Asian Financial Crisis and was primarily driven by an OPEC-led rebalancing of the oil market.
While the Fed's backdrop may look like 1999, the commodity market environment is more similar to 2022, and the risk is:
A renewed fading of supply disruption premiums could again coincide with tougher financial environment headwinds, driving a more subdued cooling in the commodity sector during any upcoming hiking cycle.
An Interesting FOMC Meeting.
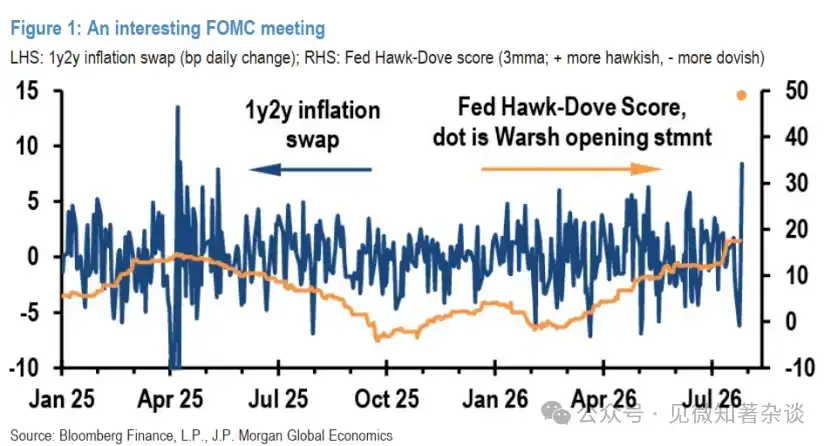
Last Wednesday, the FOMC held rates steady, in line with our economists' expectations, though hawkish dissent was one person greater than expected with three dissenting members, with Kashkari joining the dissent being a modest surprise.
While in our Natural Language Processing (NLP), Chairman Warsh's prepared remarks were hawkish, his failure to endorse a clear target undermined his inflation-fighting credibility (Chart 1).
This, along with comments about the effectiveness of the Fed's tools against inflation, accelerated a twist steepening of the US Treasury curve, with mid-term inflation breakevens rising sharply—an extremely unusual post-FOMC scenario.
Chart 1: An Interesting FOMC Meeting
The first Fed hike is currently priced for 2026. Overall, with the committee leaning more hawkish, the FOMC may now face market pressure, reflecting doubts about whether Warsh's tough inflation talk will translate into action.
This increases the urgency for other committee members to act to fulfill their mandate and reinforces our economists' view that the Fed is moving towards rate hikes, with the risk of earlier action also rising.
Consequently, they brought forward their expectation for the next hike from the second half of 2027 to December this year and emphasized that there is clearly a risk in September if inflation heats up again soon. This revision reflects less a market "pressure" on the Fed and more another challenge prompting the Fed to act to maintain its credibility.
Commodities Have Delivered Strong Returns in Past Hiking Cycles... Until 2022
Since 1990, the Fed has initiated five hiking cycles (Feb 1994, Jun 1999, Jun 2004, Dec 2015, and Mar 2022), each lasting roughly one to three years (Chart 2).
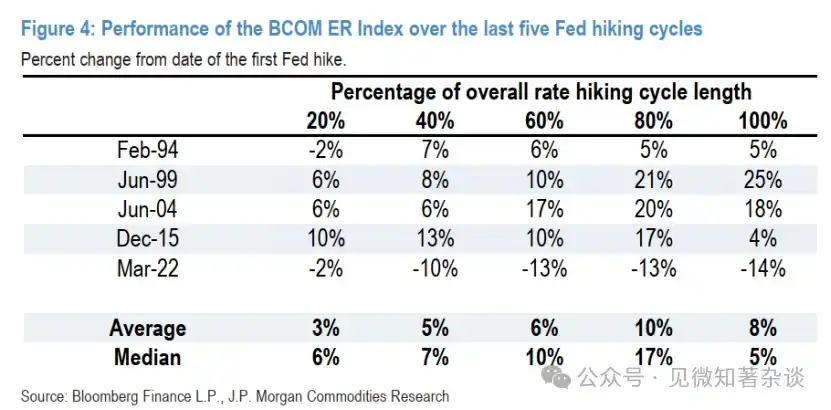
Commodities generated positive returns in all these Fed hiking cycles, except for the most recent one (Mar 2022 to Jul 2023), where the sector dramatically broke from its prior pattern, declining by about 14% over the duration of the hiking cycle (Charts 3 and 4).
Nonetheless, even in the last hiking cycle, the BCOM ER index initially followed the previous pattern of rising relatively early in the cycle before performance deviated significantly from history.
Chart 2: Bloomberg Commodity (BCOM) ER Index vs US Federal Funds Target Rate (Upper Bound)
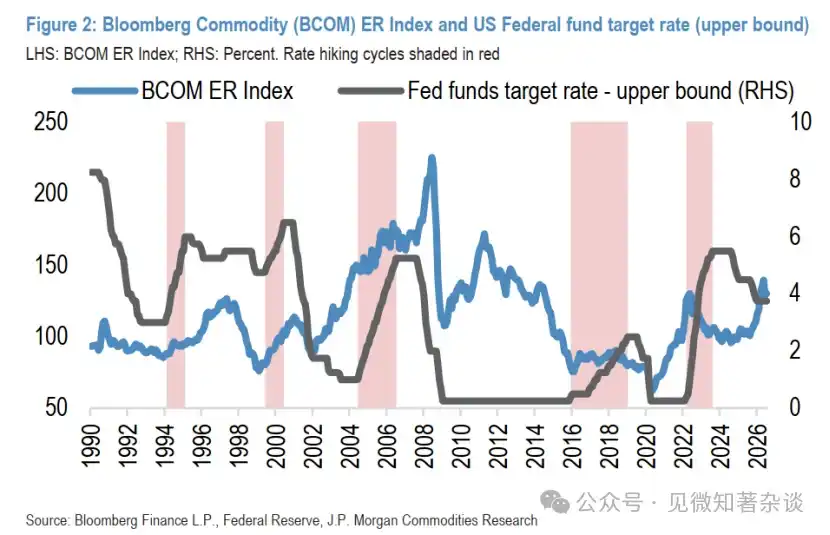
Chart 3: Performance of BCOM ER Index in the Past Five Fed Hiking Cycles
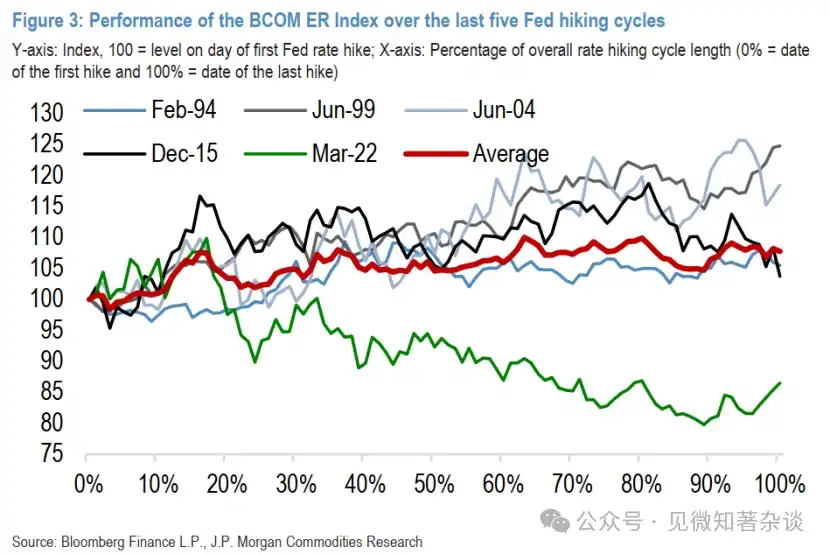
Chart 4: Performance of BCOM ER Index in the Past Five Fed Hiking Cycles
How to Explain the Divergence in 2022/23 Performance?
In past analysis, we inferred that the consistently strong returns of commodities during Fed hiking cycles could be driven by supportive macroeconomic fundamentals that simultaneously influence Fed rate policy.
In other words, the Fed typically begins hiking cycles during periods of sustained, strong economic growth, which leads to a resurgence of inflationary pressures and falling unemployment—macro factors that also coincide with robust commodity demand, depleting inventories to low levels as supply struggles to keep pace.
However, the 2022/23 hiking cycle was different.
Coming relatively soon after the COVID-induced recession, the Fed found itself far behind the curve as initial inflation pressures from pandemic-related supply chain disruptions and crisis-driven fiscal and monetary stimulus were further fueled by surging energy, fertilizer, and food prices following Russia's invasion of Ukraine in early 2022.
Thus, supply-side pressures played an outsized role in prompting the Fed to hike rates by over five percentage points relatively quickly.
This also meant the commodity sector entered this most recent hiking cycle from exceptionally elevated levels.
Concerns over supply disruptions for sanctioned Russian commodity seaborne shipments pushed the BCOM ER index up 25% in Q1 2022.
Overall, however, supply chains proved more resilient than initially feared, and by mid-2022 (or even earlier for some commodities), this supply risk premium began to erode significantly.
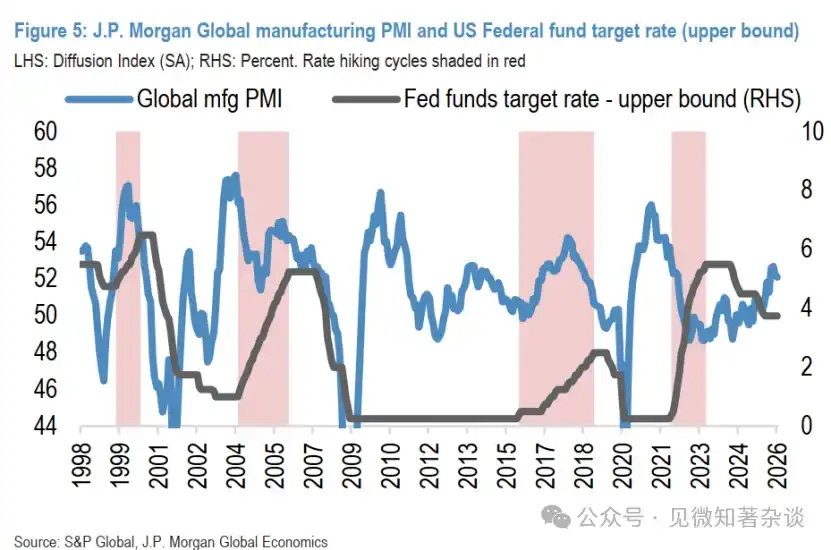
From then on, while recession fears—signaled by the inverted Treasury curve—never materialized, the Global Manufacturing PMI did fall below 50 in September 2022 (and remained in contraction territory throughout 2023 as well), dragging down broader industrial demand and exacerbating the more bearish commodity price move during the 2022/23 hiking cycle (Chart 5).
Chart 5: J.P. Morgan Global Manufacturing PMI vs US Federal Funds Target Rate (Upper Bound)
The Hiking Cycle May Look Like 1999, but Commodity Reaction Risk Is a Replay of the 2022 Script
As reflected in last week's hawkish dissent, Fed members question the restrictiveness of the current policy stance given the tightening labor market and persistent inflation.
According to our US Rates Strategists, various measures of the real neutral rate indicate a need for a 50-100 bps policy rate tightening for a mid-cycle adjustment to re-establish a restrictive stance without inflation subsiding.
In their view, this makes the mid-cycle hike adjustment from June 1999 to May 2000 (specifically the tightening phase from November 1999 to May 2000) a comparable analogy to the present.
Commodity Returns Were Strong in 1999/2000, but Commodity Market Setups Looked Very Different.
The 1999/2000 hiking cycle delivered the strongest cumulative commodity returns in our admittedly small sample, with BCOM ER rising 25% during the cycle, driven by a remarkable gain of over 70% in the BCOM Energy sub-index.
However, context is crucial.
First, the broad commodity sector was deeply depressed entering this hiking cycle.
In the first half of 1999, following the Asian Financial Crisis / Russian financial crisis / LTCM collapse which hit demand and risk sentiment, BCOM stabilized at levels about 35-40% below its 1997 peak.
Second, and importantly, oversupply and low prices prompted OPEC and participating non-OPEC countries to commit to significant production cuts in 1998 and early 1999.
Thus, the significant outperformance of commodities (primarily driven by the rebound in energy prices) largely boiled down to a material rebalancing of the oil market under stronger supply discipline.
With this historical context, while the Fed's backdrop may look like 1999, the commodity market environment is more similar to 2022.
The current renewed inflationary pressure is coinciding with significant supply chain disruptions, as shipping through the Strait of Hormuz remains blocked.
Consequently, with rising energy prices and production costs across the sector, the BCOM index overall remains near its all-time highs from Q1 2022, rather than entering this hiking cycle from a depressed base.
Therefore, while the magnitude of any upcoming hiking cycle may be far smaller than 2022/23 (when rates moved 5 percentage points from the lower bound initially), the risk remains:
A renewed fading of supply disruption premiums could again coincide with tougher financial environment headwinds, driving a more subdued cooling in the commodity sector during any upcoming hiking cycle.
Against this backdrop, micro fundamentals and sector-specific sensitivities to rates will be paramount for the remainder of 2026:
· Energy:
Flows through the Strait of Hormuz and Chinese oil import demand could outweigh the impact of rates.
We hold a fundamentally bearish base case forecast for oil over the next 12 months, though significant near-term tail risk remains to the upside should inventory buffers become strained again due to longer disruptions through the Strait of Hormuz.
Our base case assumes a gradual recovery in Middle East supply for the remainder of 2026, with Brent crude prices averaging $80/bbl in Q4 2026 before declining to average $63/bbl in 2027 as oversupply returns.
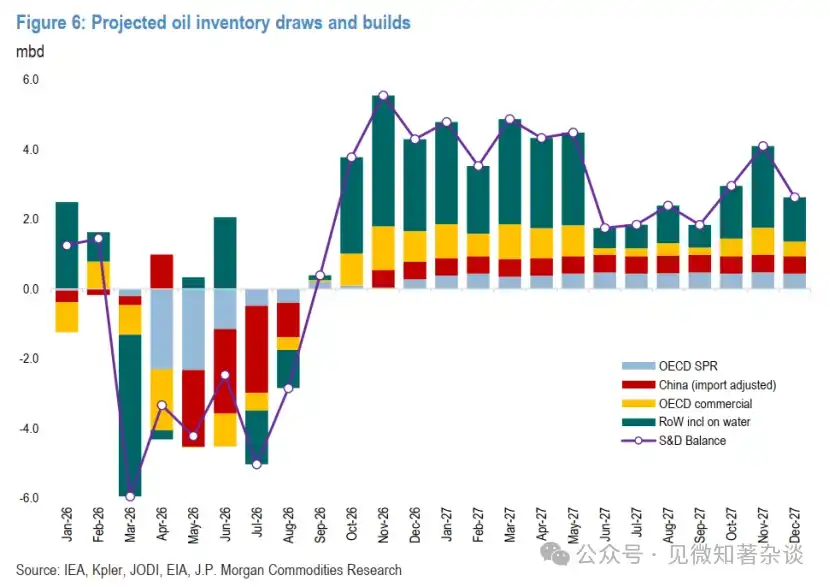
That said, this forecast is highly dependent on the rate of recovery in Strait of Hormuz flows and the eventual normalization of inventories (Chart 6).
Even with sluggish Chinese imports, each additional month of conflict and lower-than-expected Strait flows adds roughly $7-8/bbl to the Brent fair value, pushing monthly average prices to around $114/bbl if disruptions extend to three months.
Chart 6: Projected Oil Inventory Drawdown and Build
· Precious Metals:
Most bearishly exposed to further Fed action.
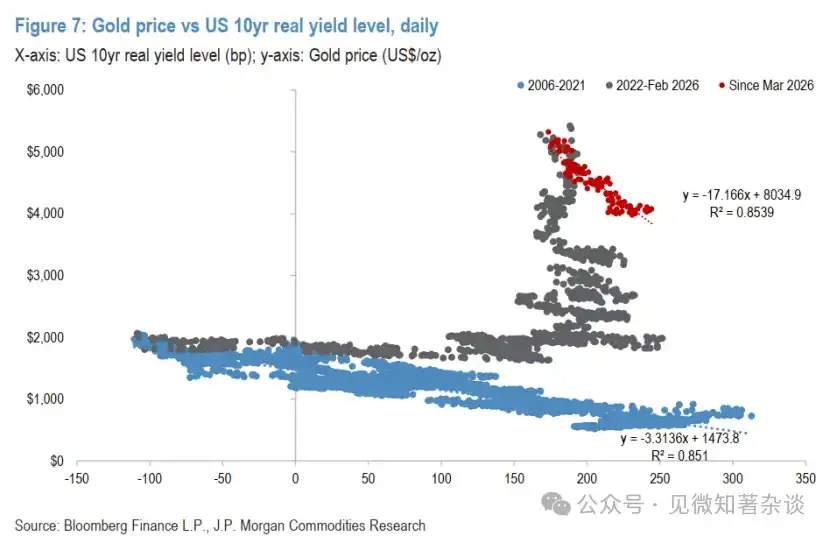
Gold prices, currently trading between $4000-4200/oz and down about 25% from the January 2026 peak, have already felt significant pressure from higher real yields and a pivot towards Fed hike expectations.
While the sector performed poorly during the 2022/23 hiking cycle, the eventual damage was surprisingly mild given the aggressiveness of hikes.
However, prices were then underpinned by significant emerging-market-driven central bank gold buying, which offset rate-sensitive ETF outflows and caused a decoupling of the gold price correlation with real yields.
The issue now is that a broader freeze in other demand segments (central bank buying breadth sharply narrowed, retail interest concentrated elsewhere, private bank and Asian physical demand subdued) has put rate-sensitive ETF demand back in the driver's seat for gold prices.
Thus, a sharper market pivot to price in nearly two more hikes than currently factored into OIS forwards could drive gold well below $4000/oz, triggering further technical breaks pointing towards a potential move to $3500-3600/oz.
Chart 7: Gold Price vs US 10-Year Real Yield Level, Daily
· Base Metals:
Appear robust for now, but watch PMIs. While still below the war-induced highs reached earlier this year, industrial metals are entering the upcoming hiking cycle near their highest levels since 2022.
This currently feels justified.
The Global Manufacturing PMI pushed above 52 in March, and although it moderated slightly in June and July, it still indicates a strong pace of global manufacturing expansion for now.
Micro-wise, LME-registered copper inventories are now below 100kt amidst the ongoing US-China battle for refined units, and our analysis shows historically asymmetric bullish price behavior below this level.
Our base case forecast for industrial metals remains bullish for H2 2026, with the highest conviction on copper. Tight mine supply, low inventories outside the US, and this bipolar competition for copper units skew fundamental risks to the upside, pointing towards $15,000/t.
That said, overall, the risk of a more aggressive Fed hiking cycle could ultimately echo 2022 for the sector early next year, particularly if we see supportive manufacturing trends fading as a result, coupled with ongoing headwinds from a potentially strong US dollar.