Author: Heretic Research, an independent research institution focusing on the intersection of Crypto and AI.
From settlement friction to cross-platform infrastructure, searching for the next wave of industry Alpha.
This is the full version of Heretic Research's 03rd research report. The study covers 282,191 settled prediction markets as of July 15, 2026, addressing the question: with platform competition already focused on traffic, licenses, and liquidity, where will the next wave of industry growth emerge?
The conclusion points to the outcome layer—a second profit pool formed after the standardization and cross-platform reuse of four capabilities: rule comparison, evidence verification, outcome confirmation, and payment triggering. All data in this report are point-in-time data, with sources and calculation methods noted accordingly.
TL;DR
- The front-end of prediction markets is becoming crowded; the next wave of growth may come from back-end infrastructure. Platform competition has already concentrated on traffic, licenses, and liquidity; but each new market still requires rule explanation, evidence verification, outcome confirmation, and payment completion. These repetitively built capabilities are now ready to be standardized and serve multiple platforms.
- Uncertainty in rules and settlement is creating Alpha. HR's regression model shows that 0.487% of disputed markets bear 8.64% of trading volume, and persistent price spreads exist across platforms for similar contracts; however, shallow order books and execution costs limit the capital that can be deployed. A more scalable opportunity is to productize rule comparison, evidence verification, outcome confirmation, and payment triggering into reusable, callable products.
- The outcome layer has entered commercialization. The current observable annual revenue is approximately $15–37 million; covering all existing markets would correspond to about $64–161 million; when the monetization rate reaches the level of mature projects, the industry's annual revenue ceiling is about $456 million.
- Industry opportunities are forming, and the outcome layer remains in the best stage for early research and positioning. Platform equity already prices in high front-end growth expectations, and HYPE and ICE have limited value capture for the outcome layer; what's truly worth tracking are which early-stage projects start gaining cross-platform adoption and convert that adoption into attributable, recurring revenue. The ideal targets are not yet fully formed, meaning this part of the industry's value hasn't been fully priced in.
Those who trade on rule differences make modest profits; those who define the outcome share the future.
Preface | The Overlooked Second Probability in Prediction Markets: Whoever Judges the Outcome Rewrites the Price
Prediction markets typically read the price of a Yes contract directly as the probability of an event occurring. This reading misses the most valuable variable in prediction markets: after a fact occurs, whether the rules acknowledge it ultimately determines whether the contract pays out.
Thus, a single contract contains two probabilities:
- The probability of the fact occurring
- The probability that the fact is recognized as Yes under the rules
When rules are clear and evidence is consistent, the two probabilities are close; when there are disagreements over cut-off times, information sources, evidence standards, or final adjudication, they diverge. This difference is not a technical bug; rather, it changes cash flow and can itself be considered an asset.
Therefore, this article focuses on this 'invisible hand' of prediction markets not yet seen by consensus, using three definitions for a deep breakdown: interpretation power determines whether facts are acknowledged by the rules, the rule differential is the trading Alpha that emerges when this acknowledgment bias enters prices, and the outcome layer encapsulates rule comparison, evidence verification, outcome confirmation, and payment triggering as cross-platform interfaces.

The three form a causal chain: interpretation power is the cause, the rule differential is the result, and the outcome layer is the commercialized form of interpretation power.
Thus, whoever determines whether a fact is acknowledged by the rules of a prediction market is the overlooked second probability, manifesting as the rule differential in trading and driving the encapsulation of rule comparison, evidence verification, outcome confirmation, and payment triggering into shared interfaces in the industry.
The same rule differential thus splits profits into two areas of attribution. The portion attributable to the outcome layer is the second profit pool mentioned in this report's title—it's a profit distribution measured at the industry level, currently not disclosed separately by any entity.
Based on data evidence and industry research, this report identifies a growth opportunity not yet fully priced by the market: The outcome layer, capable of cross-platform replication and generating recurring revenue, will become the primary driver of industry growth in the next phase of prediction markets.
01 | 0.487% of Markets Enter Dispute, Accounting for 8.64% of Volume: Large Capital Behind Small Probabilities
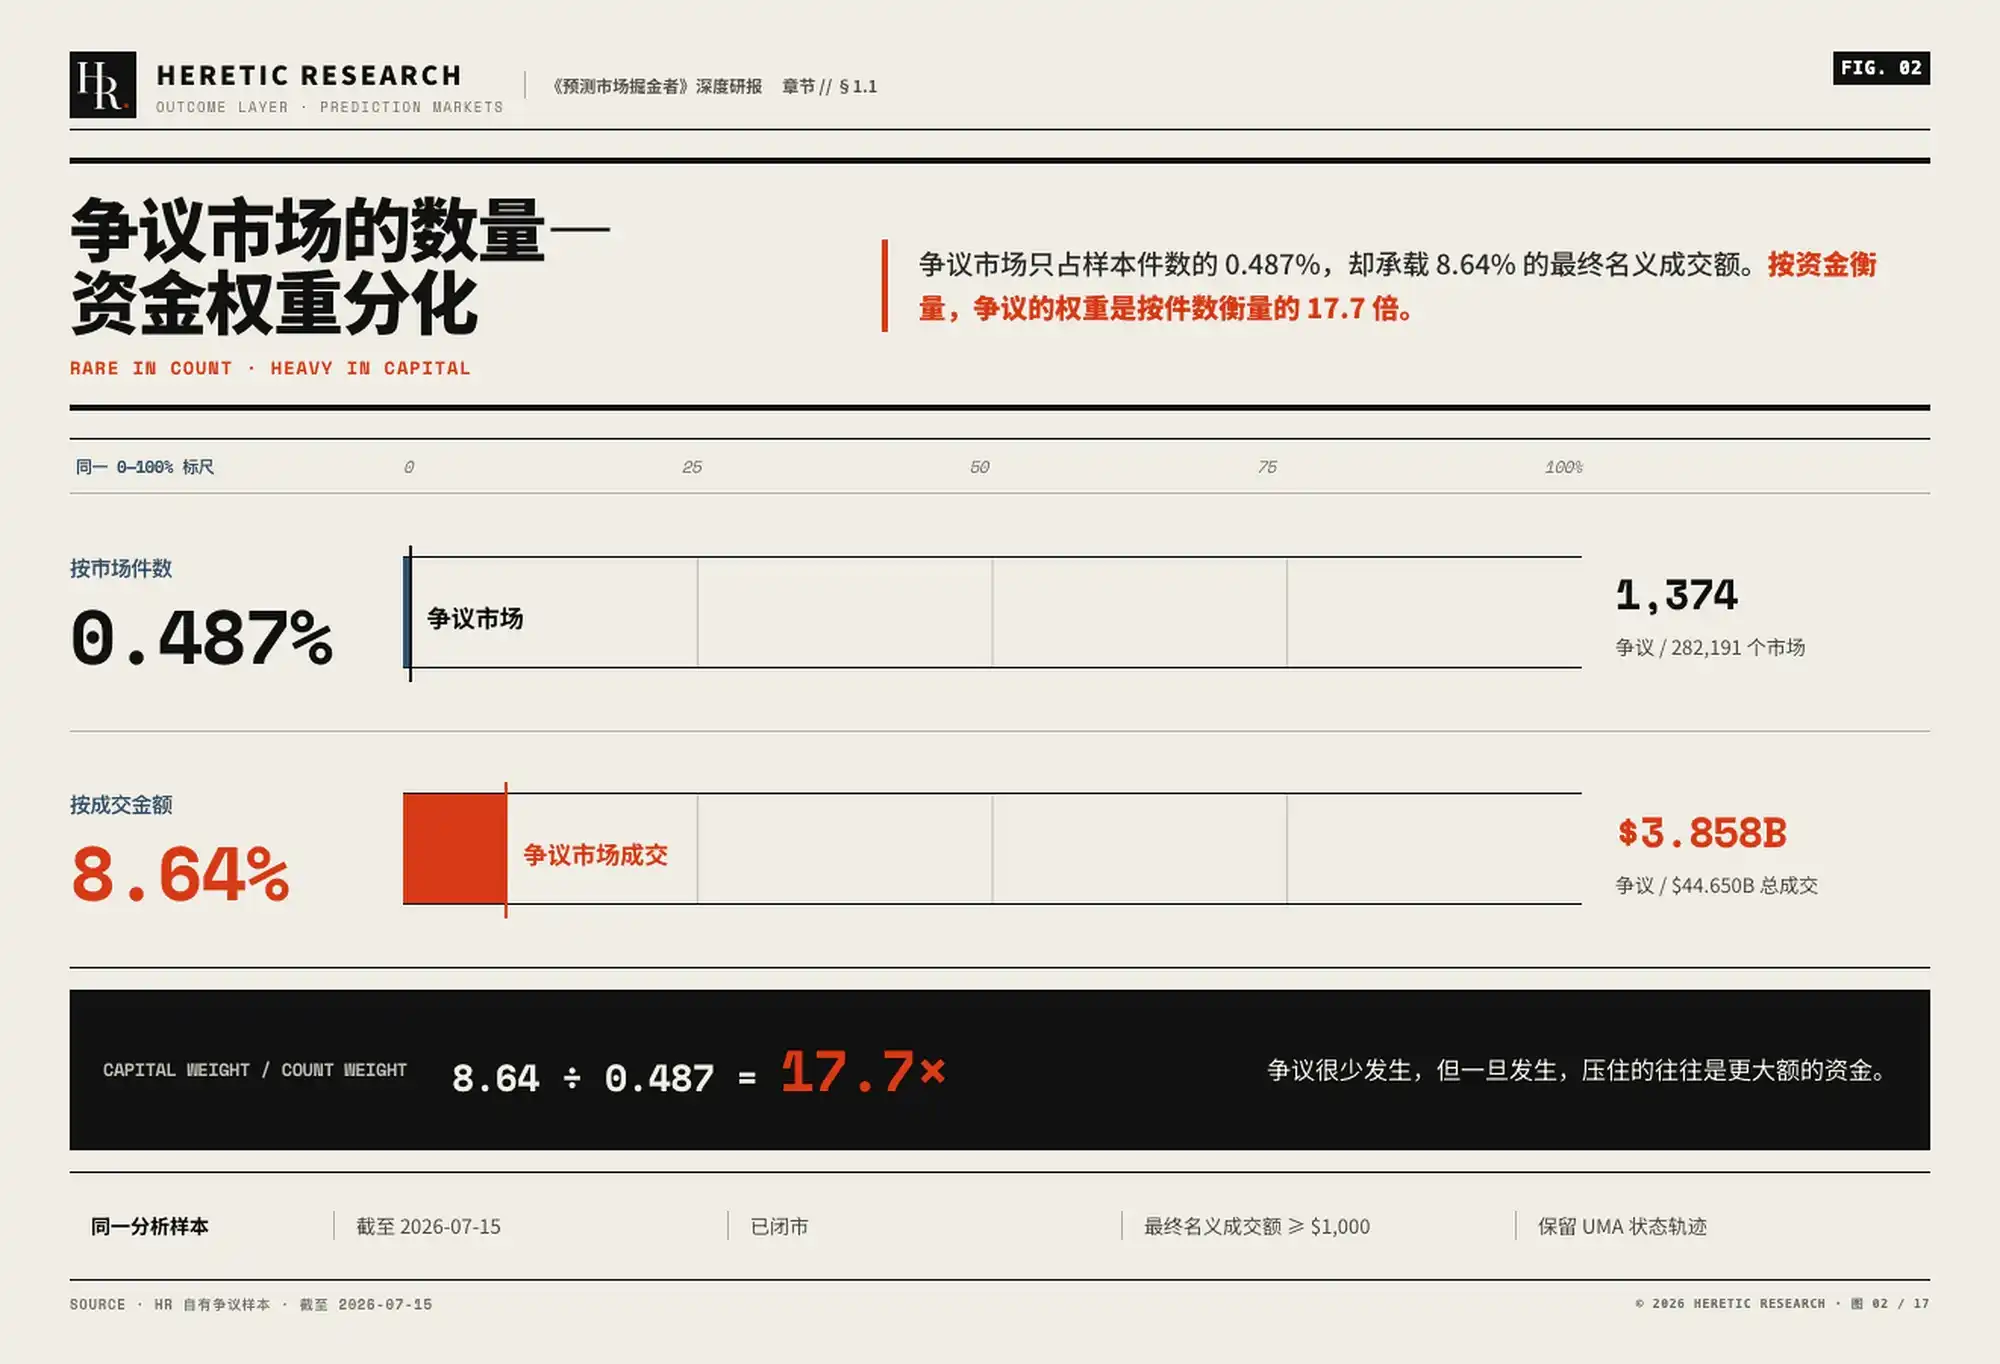
Measured by the number of prediction markets, disputes are a low-frequency operational issue. Therefore, this metric systematically underestimates the economic value of the rule differential: while the proportion is small, the economic value of the 'rule differential' is determined by the amount of capital exposed to disputes.
As of July 15, 2026, this report sampled 282,191 markets from closed markets with final notional volume not less than $1,000 and preserved UMA status trajectories for dispute rate and regression analysis. UMA is the on-chain dispute arbitration mechanism used by Polymarket. In this sample, markets that entered dispute account for only 0.487%, yet they bear 8.64% of the final notional trading volume.
The rule differential concentrates in the most expensive markets.
1.1 Higher Trading Volume Concentrates Dispute Risk
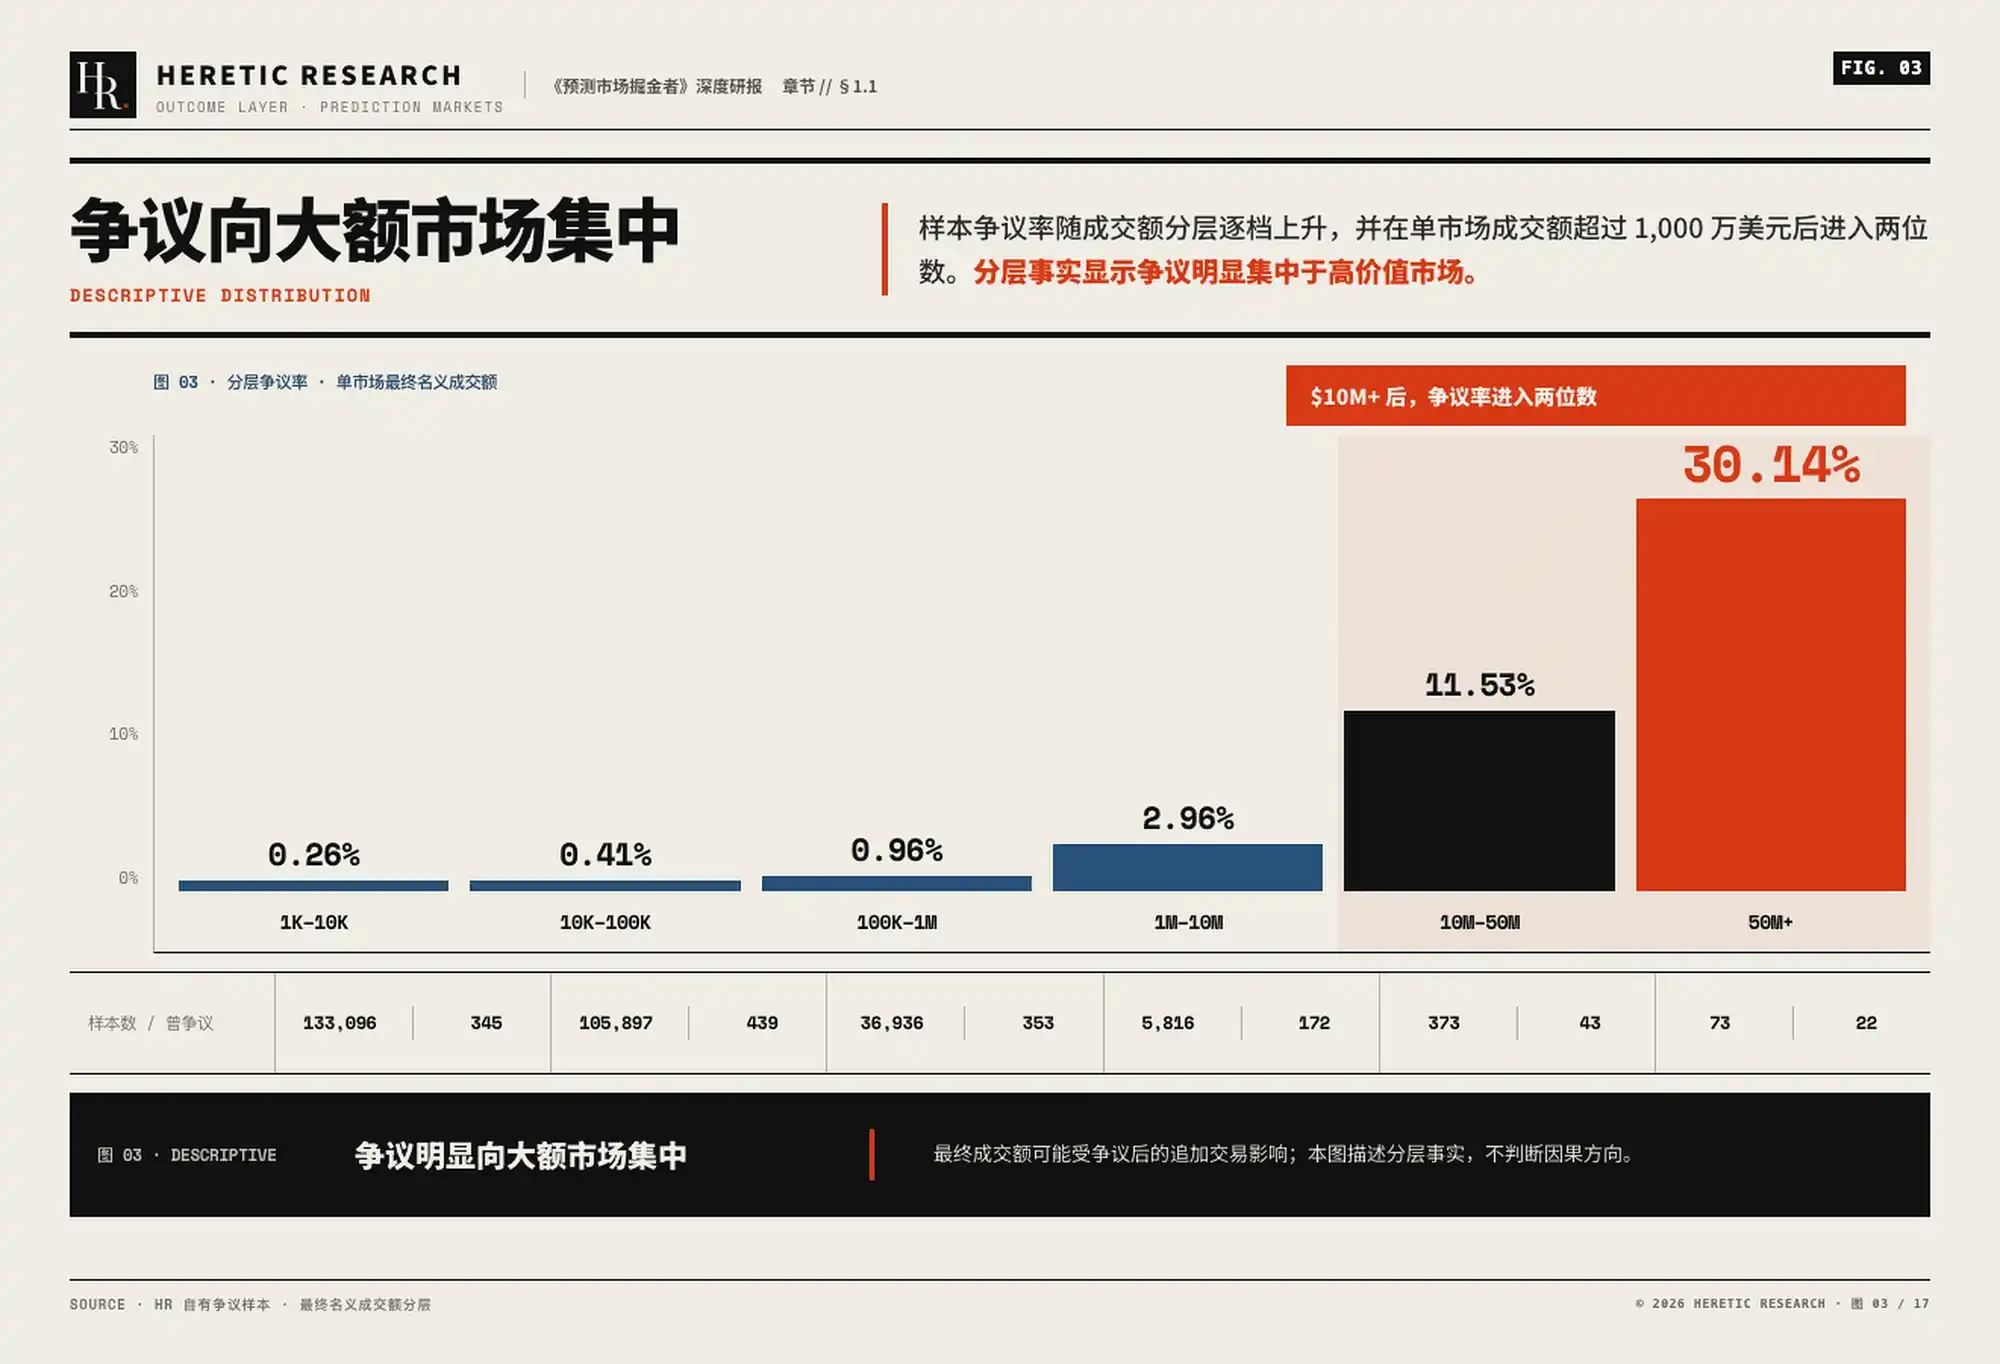
Stratified by final notional trading volume, the sample dispute rate monotonically increases from 0.26% in the lowest tier to 30.14% in the highest.
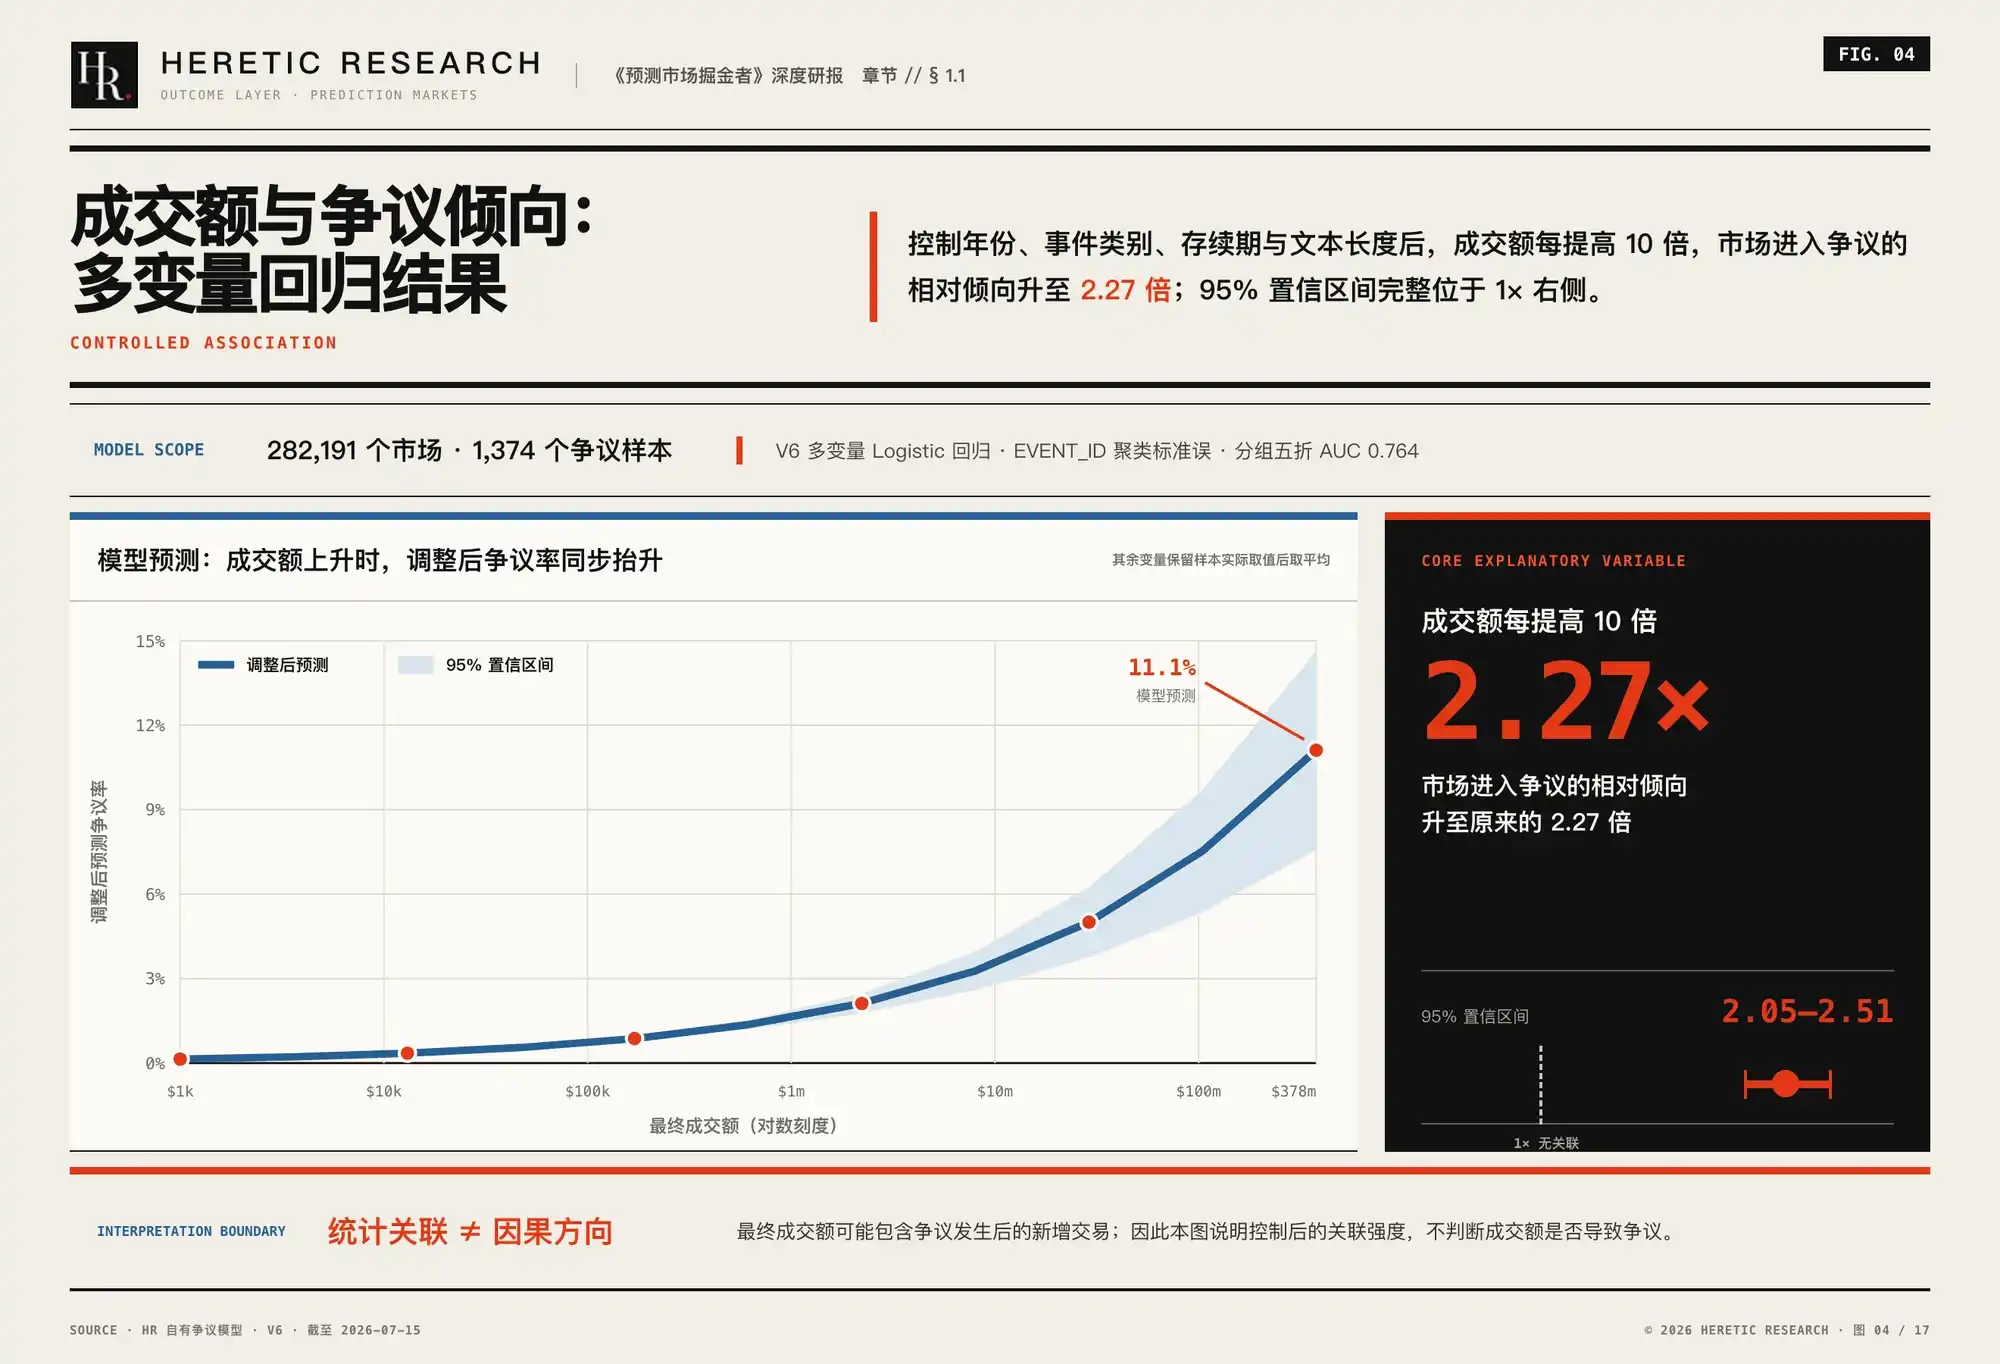
Based on this, regression modeling was employed. The regression results show that, after controlling for factors such as market year, category, and duration, trading volume remains significantly positively correlated with disputes: for every 10x increase in single-market volume, the relative tendency for the market to enter dispute increases by approximately 2.27 times. This indicates disputes are clearly concentrated in high-value markets. However, since trading volume may include post-dispute transactions, this result can only prove correlation, not whether high volume causes disputes or disputes lead to more volume. But either way, it has become a recurring cost for large capital.
1.2 High-Value Trading Demands Interpretation Power Move from Backstage to Center Stage
When a single event determines only a few thousand dollars, ambiguous rules can be handled ad hoc by operations staff; when a single event determines tens of millions of dollars, rule ambiguity simultaneously alters fund payouts, market maker positions, and platform credibility.
High-value trading therefore requires four things to be visible before placing an order: whether rules can be compared, evidence can be verified, outcomes can be confirmed, and payments can be triggered. The absence of any of these will lead market makers to charge for the uncertainty through wider spreads, smaller positions, or higher capital requirements. These costs are ultimately passed on to traders, manifesting as higher trading costs, lower executable size, and poorer capital efficiency.
Thus, the significance of the 0.487% dispute rate lies precisely in the capital it holds back, far exceeding its proportion in terms of number of markets. When the rule differential concentrates in the most expensive markets, the real question becomes who holds the power to change payout outcomes.
02 | The Concentration of Interpretation Power: A Few Wallets Hold Final Voting Rights in Disputes
Original prediction market terms cannot cover all eventualities. Where terms fall short, outcome confirmation shifts from rule execution to interpretation power: whoever holds final adjudication can rewrite cash flow. This is the first source of the rule differential: ownership of interpretation power, i.e., who has the final say within a platform; the more concentrated the ownership, the harder it is to predict the probability of rule acknowledgment.
2.1 The Strategy Case: Fact Occurrence ≠ Contract Acknowledgment
Polymarket's relevant contract stipulated that the market should settle as Yes if Strategy sold Bitcoin before 11:59 PM ET on May 31, 2026. Strategy later disclosed selling 32 BTC between May 26 and 31.
The market ultimately settled as No. The key to the dispute was not 'whether sold,' but 'whether the sale had to occur before the deadline or had to be publicly confirmed before the deadline.' The original rule was written based on the occurrence time; supplementary clarifications after June 1st incorporated the public confirmation time into the judgment. Galaxy Research's review of the rule text and supplementary clarifications showed traders faced two different rule acknowledgment standards.
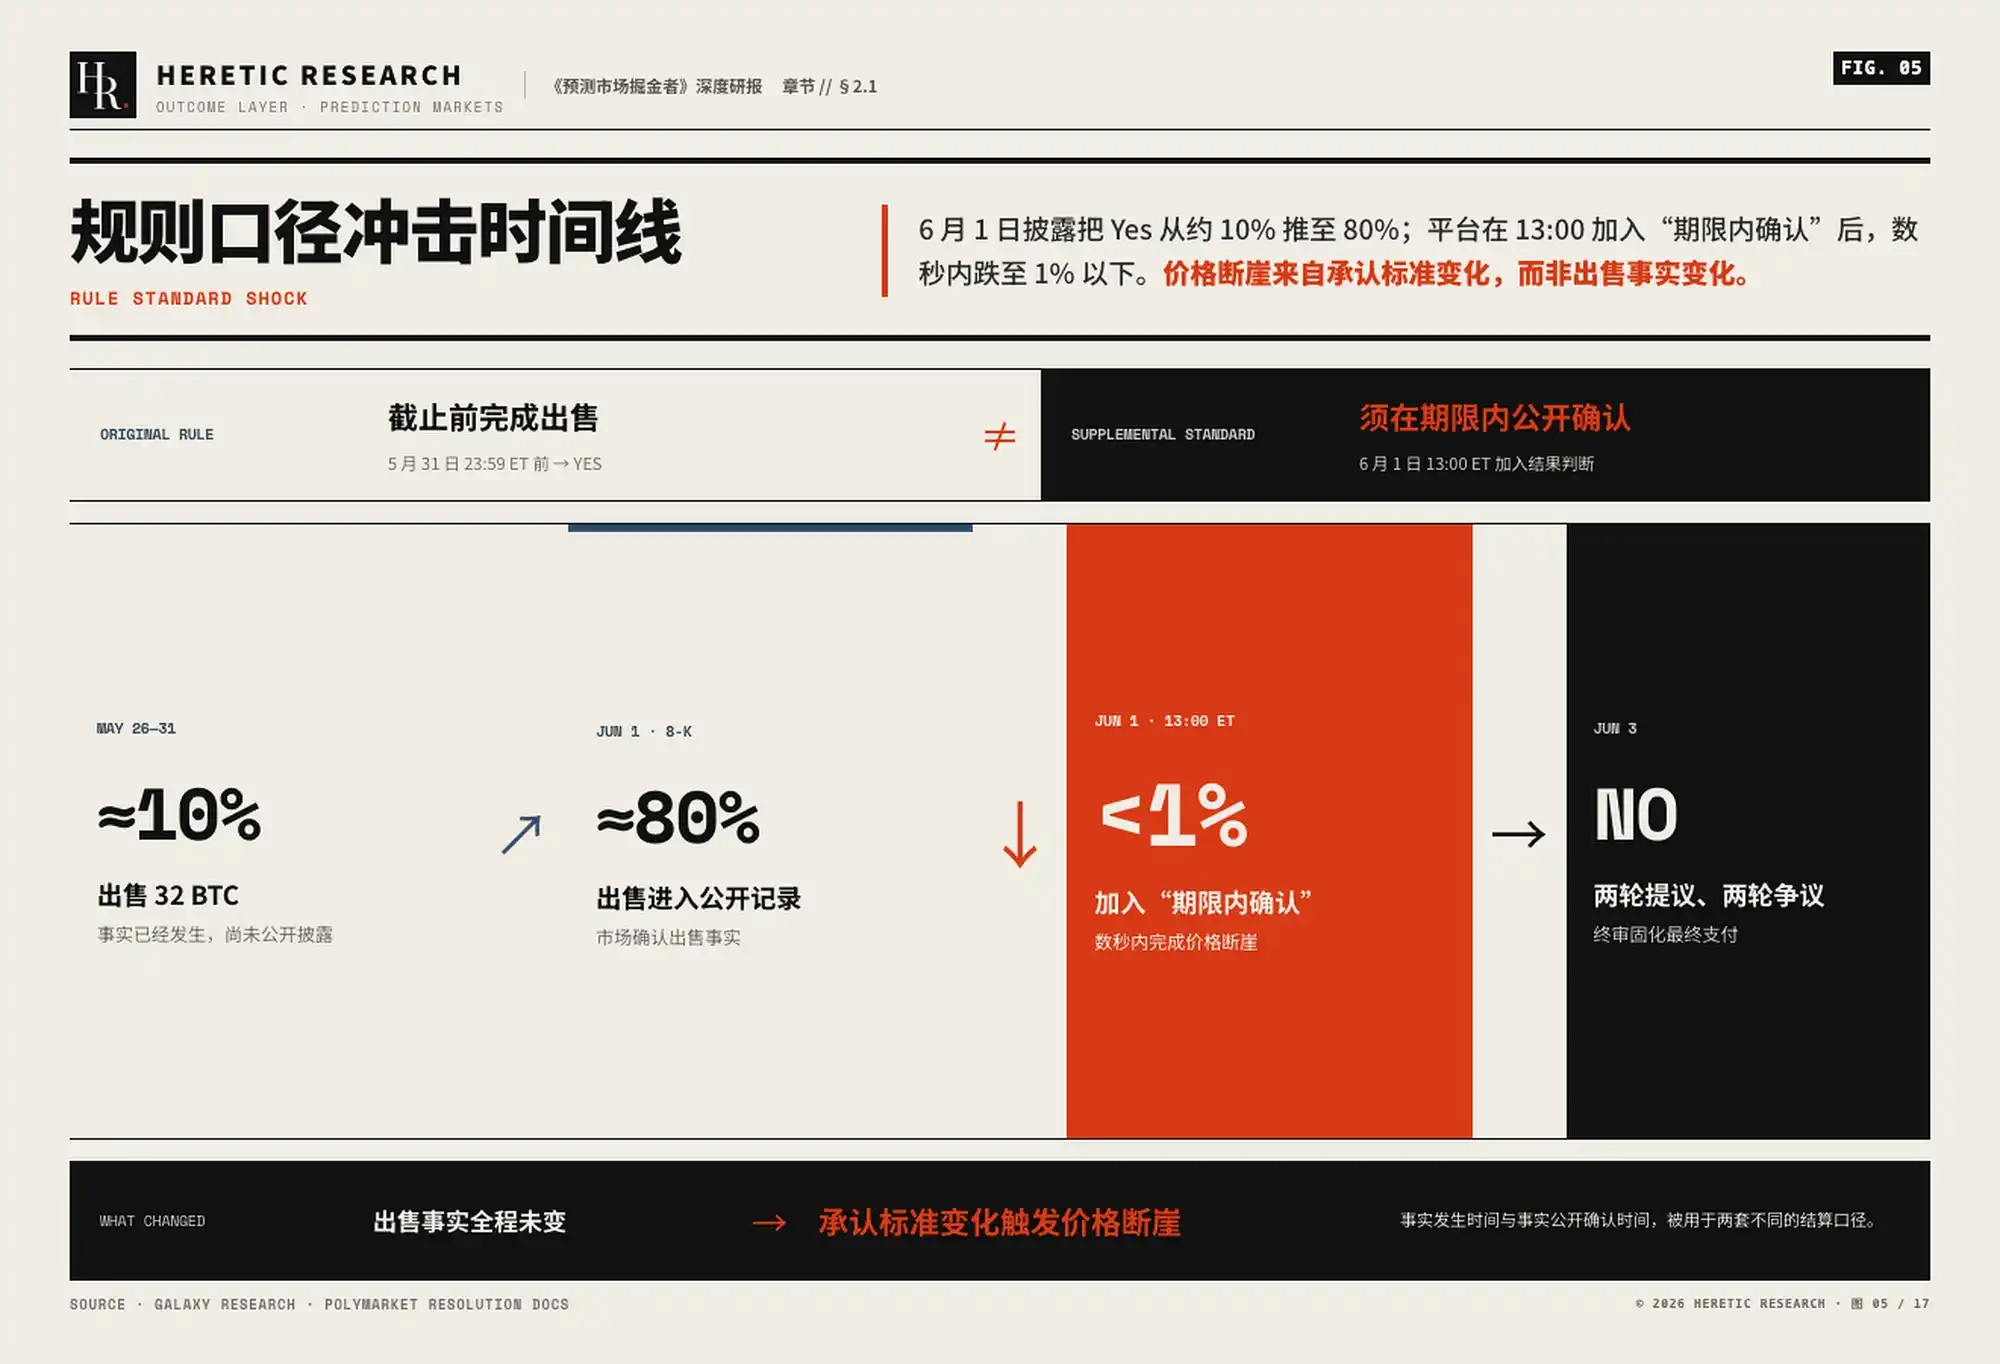
This was not 'price volatility due to a dispute' but an identifiable rule-caliber shock: fact disclosure pushed Yes up, and a supplementary note pushed it back down. The fact didn't change; what changed was the probability of the fact being acknowledged by the rules. Interpretation power directly determines cash flow. In this case, cash flow was rewritten by that supplementary note and the subsequent voting process.
2.2 Open Participation Has Not Eliminated Power Concentration
This voting process is open to all. Polymarket disputes enter UMA voting, where theoretically any token holder can participate, but actual decision-making power is allocated based on token holdings.
Bloomberg's investigation of on-chain voting revealed that among over 6,400 addresses that participated in dispute voting over three years, just 9 wallets contributed about half the voting power. Another investigation cited by media, attributed to The Wall Street Journal, found that in over 300 disputes, at least one voter simultaneously held positions in the relevant market.

There's no need to prove manipulation here; the conflict of interest itself constitutes a risk: a few wallets may both hold positions in the relevant market and be able to participate in determining the final settlement outcome. Once trading interests and outcome adjudication concentrate in the same set of participants, the market must price in this potential influence. To gauge the size of this influence, one must first look at the cost and barrier to entering the dispute process.
2.3 Large Positions Increase Economic Incentive to Intervene in the Dispute Process
The barrier to entering the dispute process is not high. Polymarket's dispute explanation shows disputants typically only need to match the proposer's bond, commonly $750. For those holding large positions, this cost may be far less than the capital affected by the dispute outcome.
Suppose a trader holds a $100,000 Yes position. If the market is proposed to settle as No, this position could be nearly wiped out. At this point, even if the trader believes the probability of a successful dispute is only 10%, spending $750 to send the case into dispute may still be a rational choice.
Ignoring additional costs like research and Gas for now. If the dispute succeeds, the trader recovers the $100,000 position and receives half of the loser's bond, i.e., $375; if it fails, they lose their own $750 bond. Their expected profit is approximately:
10% × (100,000 + 375) − 90% × 750 = $9,362.5
In this example, even with a low success probability, the gap between the potential recovery amount and the bond is enough to create a strong incentive to dispute. The larger the position, the lower the minimum success probability a trader requires to initiate a dispute.
Therefore, the expected profit formula for a dispute is:
Expected Dispute Profit = q × (V + 0.5B) − (1−q) × B − C
Where V is the cash flow of the position recoverable if the dispute succeeds, B is the dispute bond, C represents research, Gas, and opportunity costs, and q is the estimated probability that the favorable interpretation is ultimately accepted.
Thus, the break-even condition for initiating a dispute is:
q > (B + C) ÷ (V + 1.5B)
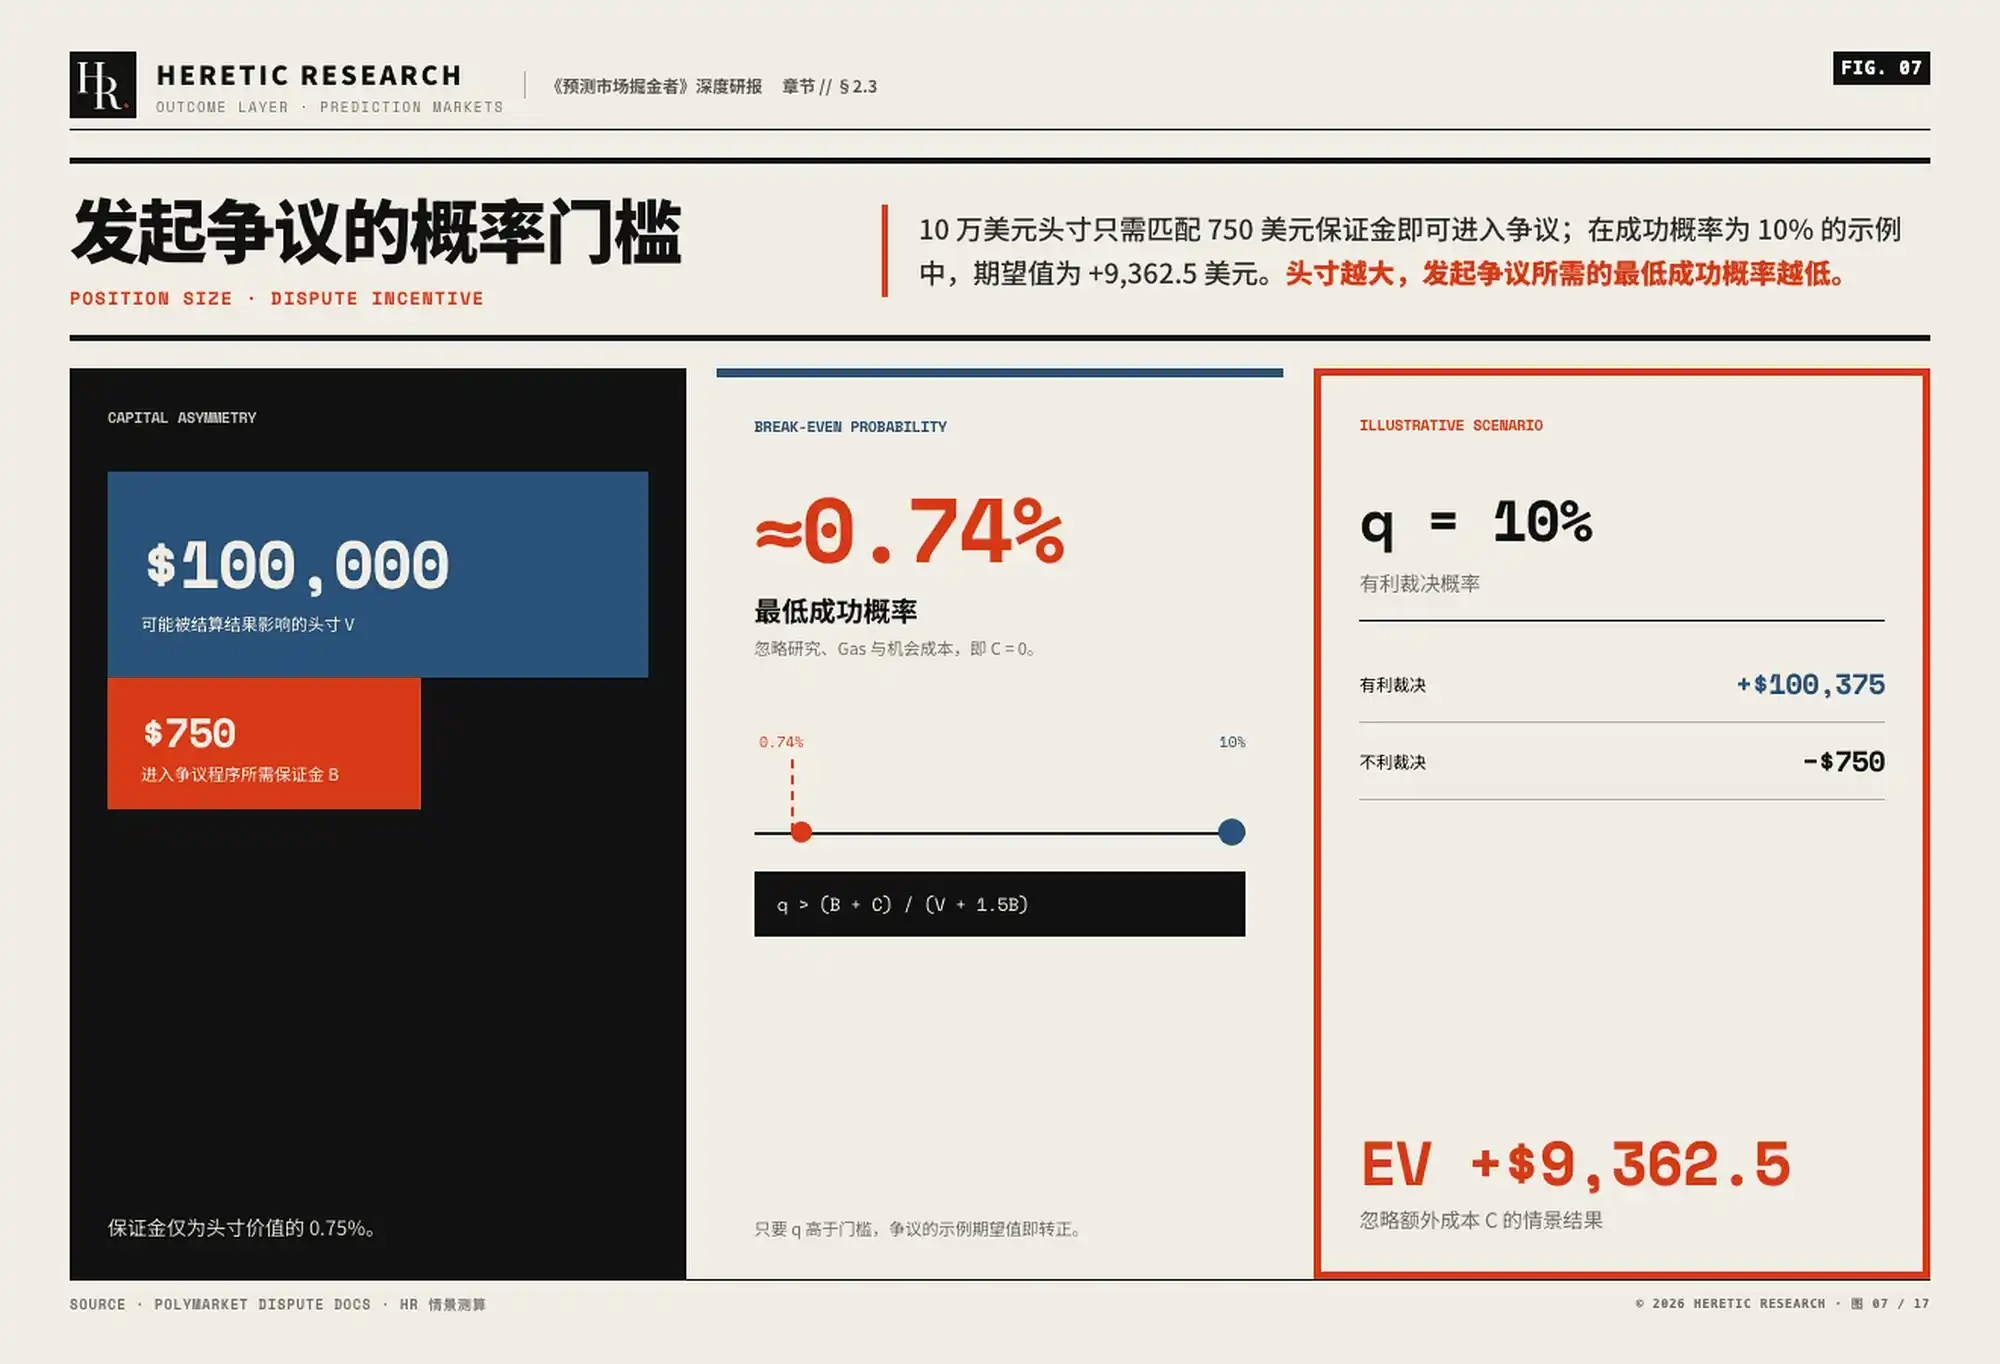
This means that the larger the position value, the lower the minimum success probability required to initiate a dispute. $750 cannot determine the final vote, but it is enough to bring a favorable interpretation into the process that decides cash flow.
03 | The Rule Differential Has Entered Prices, But Strategy Capacity Hits a Wall at Order Book Depth
The previous section revealed who holds interpretation power. Next, we'll see that interpretation standards also differ across platforms. This is the second source of the rule differential: differences in interpretation standards. The same second probability, the former makes it unpredictable, the latter makes it unequal across platforms.
The rule differential has become a tradable price deviation. Prediction market traders, besides judging whether an event will occur, must first confirm whether two seemingly identical contracts use the same cut-off time, information source, and settlement criteria, and whether they will pay out under the same conditions. Only if settlement conditions are completely identical is the price difference potentially arbitrage; if the rules differ, traders are actually betting on whether the market has mispriced these rule differences.
3.1 Cross-Platform Pricing Evidence: Semantically Equivalent, Prices Still Differ
A 2026 cross-platform study covering ten major platforms and over 100,000 events, with manual verification of natural language descriptions, outcome confirmation semantics, and timeframes, found that some events were listed on multiple platforms simultaneously, and that semantically equivalent markets still exhibited average 2%–4% persistent, executable price discrepancies. The study defined this phenomenon as 'semantic non-fungibility': lacking unified event identifiers and outcome confirmation standards prevents full price convergence.
An observation closer to current order books points in the same direction. From July 1 to 7, 2026, in the 'BTC to $120k by year-end' contract traded on both sides, Kalshi's Yes price was consistently about 2.08 percentage points higher than Polymarket's for the entire week. The Polymarket–Kalshi same-topic matching observation turned the concept that 'rules and platform structure enter prices' into a visible spread.
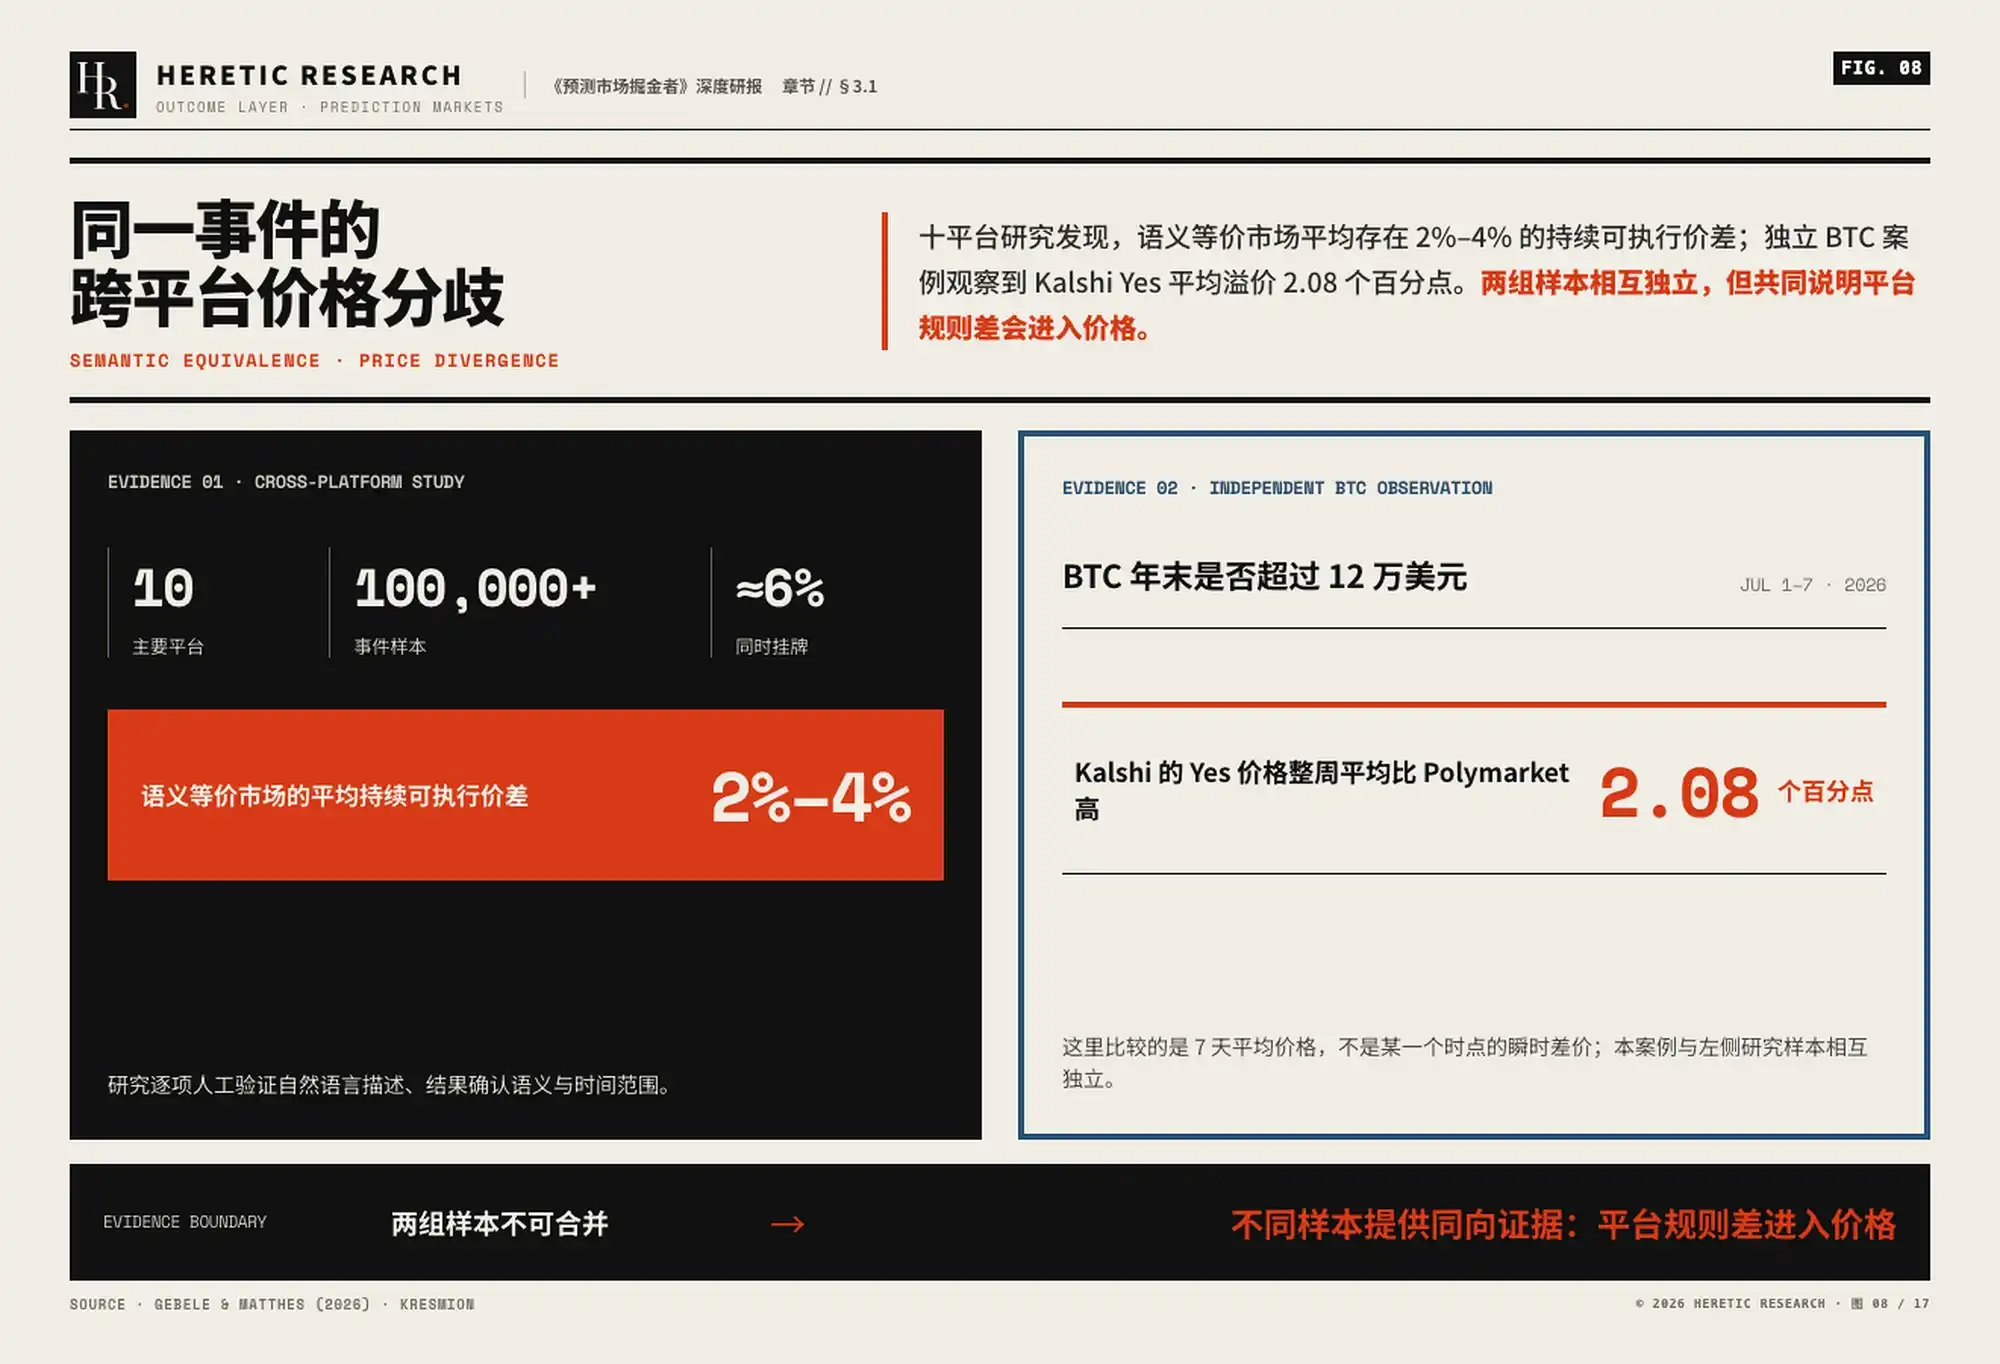
The market isn't failing to price the second probability; it just hasn't formed a unified pricing language. For traders, this is precisely the source of Alpha.
3.2 Same Settlement Conditions Profit from Spreads; Different Settlement Conditions Profit from Judgment Differences
There's a classic arbitrage trade in prediction markets: cross-platform arbitrage. But cross-platform trading first requires judging whether two seemingly identical contracts will actually pay out under the same conditions.
Assume Platform A and Platform B both have a market for 'Will Bitcoin exceed $120k by year-end?'. The Yes price on Platform A is $0.54, the No price on Platform B is $0.43, totaling only $0.97 to buy both sides.
If both contracts use exactly the same cut-off time, price source, and settlement criteria, then regardless of the final outcome, one side will pay $1. After deducting fees, slippage, and funding costs, as long as the total cost remains below $1, the trader can lock in the spread.
But if Platform A uses an index price at 23:59 UTC on Dec 31, and Platform B uses the US Eastern time closing price, the two contracts could yield different settlement results. In this case, buying both sides for $0.97 is not a risk-free arbitrage; the trader is actually judging whether the market underestimates the likelihood of the two rule sets producing different results.
Therefore, cross-platform trading can be divided into two types:
- Exactly Identical Settlement Conditions: The trader profits from price dislocation; as long as total costs are less than the final payout, profit is locked in.
- Different Settlement Conditions Exist: The trader profits from rule judgment; the gain depends on whether their understanding of cut-off times, information sources, and settlement standards is more accurate than the market's.
For the second type of trade, what truly needs estimation is not whether the event itself will occur, but the probability that the contract will ultimately be recognized as Yes under the rules.
For example, a Yes contract price is $0.54, with total fees, slippage, and funding costs of $0.015. For the trade to have positive expected value, the trader must believe it has at least a 55.5% probability of ultimately settling as Yes.
Break-even Rule Acknowledgment Probability = Market Price + Total Cost per Contract
If a trader estimates the final Yes settlement probability is 60%, above the 55.5% break-even line, the expected profit per contract is about $0.045. If the estimate is only 53%, even if the trader believes the event itself is likely to occur, the trade is not worthwhile.
So, the same predicted event doesn't mean two contracts can be directly arbitraged. Traders must first judge if they share identical settlement conditions; if yes, profit from the spread; if not, profit from the understanding gap about the rules.

3.3 Spreads Are Real and Arbitrageable, But Strategy Capacity Is Limited by Order Book Depth
The previous section explained how to identify and construct a rule differential trade. But whether a strategy can accommodate large capital requires answering two more practical questions: whether these spreads can actually be realized, and how much capital can be deployed per opportunity.
First, spreads are not just theoretical paper opportunities; they have already formed a strategy market. On-chain research of settled markets from April 2024 to April 2025 shows that intra-market rebalancing and cross-market combination trades generated approximately $40 million in realized arbitrage profits. This indicates mispricings in prediction markets can be systematically identified and ultimately converted into actual gains.
Second, while spreads exist, the practically executable size is very limited. A study covering 173 NBA games reconstructed over 75 million order book snapshots, identifying 290 combinatorial arbitrage opportunities. The median gross yield per opportunity based on order book depth was only about 1.01%; moreover, 76.9% of these were limited by order book depth, with restricted opportunities averaging only 14.8 contracts executable. Another type of single-market anomaly offered even fewer executable opportunities, with a median duration of just 3.6 seconds.
This means if the gross yield of an arbitrage is about 1%, theoretically $100 invested could earn about $1; but if only about 15 contracts can be filled on the order book, each costing nearly $1, then only about $15 can actually be deployed for this opportunity, with a gross profit of perhaps $0.15. The yield looks attractive, but the deployable capital is extremely limited, and the opportunity may vanish within seconds.
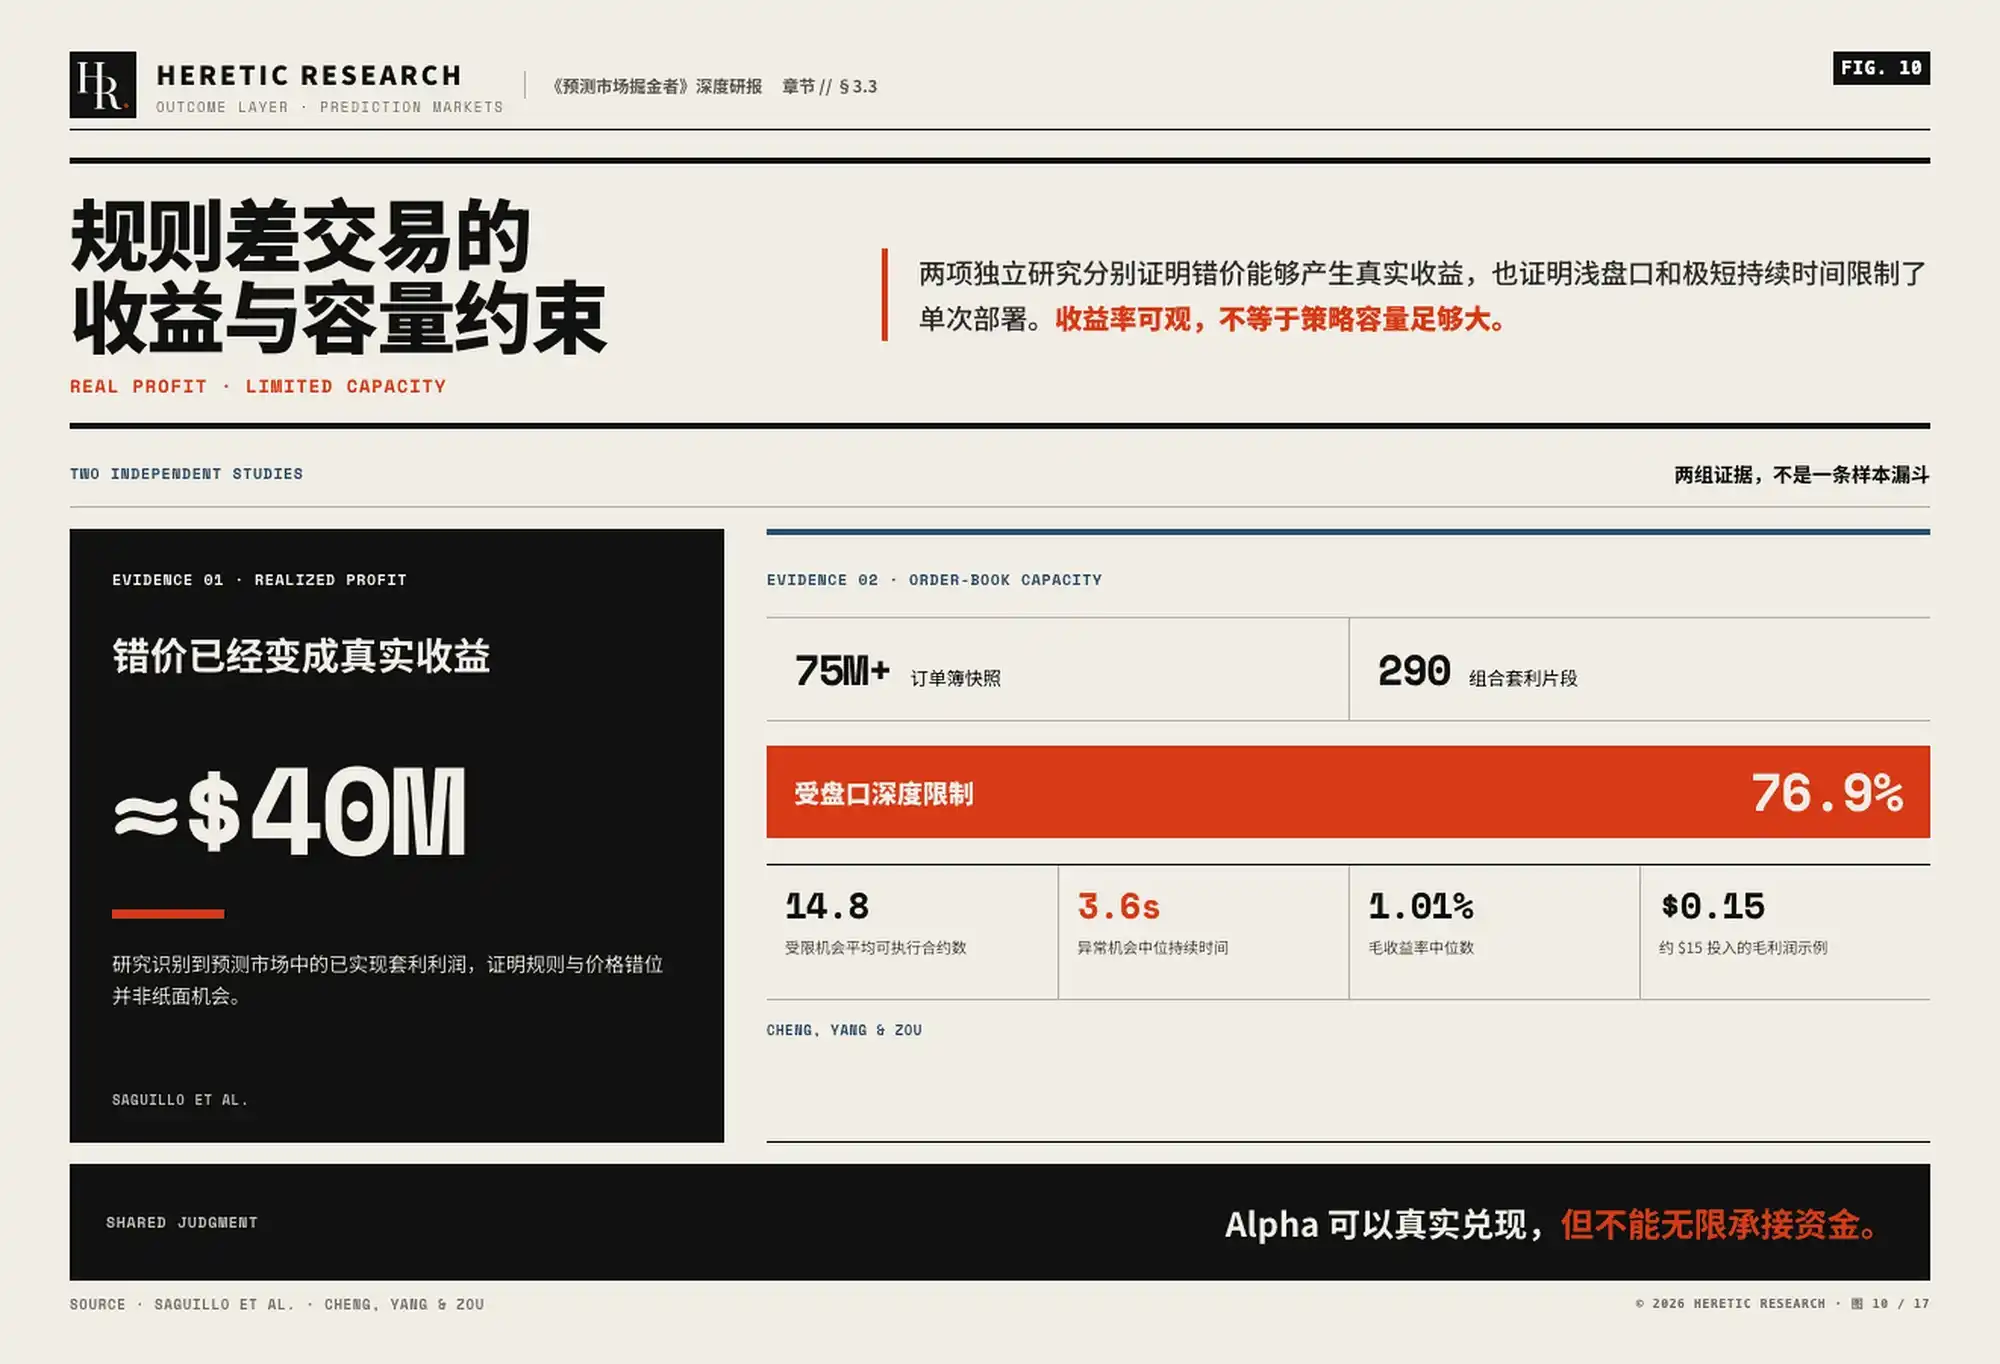
Therefore, rule differential trading is a business dependent on research and execution capabilities, not an infinitely scalable market windfall. Contract research, semantic matching, real order book identification, and multi-leg execution determine if traders can capture opportunities; order book depth and opportunity duration determine how much capital the strategy can ultimately accommodate.
Traders capture one-off mispricings, requiring fresh search and execution each time. What can truly scale with the overall growth of prediction market volume might not be trading these frictions directly, but infrastructure that charges continuously for reducing rule uncertainty, improving outcome confirmation, and minimizing human discretion.
04 | The Bigger Alpha Isn't on the Order Book: Productizing Interpretation Power
Readers reaching this point might wonder why prediction market order books are generally shallow. A key reason is uncertainty in settlement rules. Market makers cannot accurately judge how a fact will ultimately be acknowledged by the platform, so they widen bid-ask spreads and reduce quote sizes to compensate for potential risk.
This uncertainty spawns two different businesses. Traders seek and exploit mispricings caused by rule differentials, but their gains are limited by individual market depth and opportunity duration. The outcome layer, however, aims to reduce rule and settlement uncertainty, productizing rule comparison, evidence verification, outcome confirmation, and payment triggering into reusable services, charging multiple markets and platforms.
Both stem from the same market friction: traders profit from the friction's existence; the outcome layer profits from reducing the friction.
For the outcome layer to achieve this, it must first dissect 'how outcomes are confirmed.' The difficulty of confirmation varies: facts like prices, times, and on-chain states can be read directly by machines; events with dispersed evidence but relatively clear rules can be assisted by AI for retrieval and organization; events with ambiguous rules, large amounts, or conflicting evidence still require human final judgment.
The productization of the outcome layer begins precisely with this division of labor. Each type of confirmation work, once standardized, becomes a capability that platforms can purchase and call upon.
4.1 Deterministic Outcomes Are Being Standardized
The outcome layer first productizes the most clear-cut, easily verifiable events, such as Bitcoin's price at a specific time, whether an on-chain address completed a transfer, or whether a certain state appeared before a deadline. The common feature of these outcomes: as long as the data source, read time, and judgment conditions are specified in advance, the system can directly read the data, determine Yes or No, and trigger payment.
Take 'Will Bitcoin be above a certain price at a specified time?' The market only needs to determine in advance which price source to use, at which moment to read, and what condition constitutes Yes. After the deadline, the system automatically reads the data and completes settlement, with no need for ad-hoc rule interpretation.
Hyperliquid's HIP-4 is precisely turning this process into a standardized product. It connects binary outcome contracts to a unified trading system, allowing rule setting, trading, outcome confirmation, and payment to be completed within the same infrastructure, enabling the entire template to be reused for subsequent events. This standard product has already been validated by demand; Polymarket's short-cycle crypto markets powered by Chainlink have accumulated over $3.4 billion in volume.
Regulated platforms are adopting a similar approach. Some of Kalshi's gold, crude oil, and agricultural commodity markets use external price data provided by Pyth as the outcome basis, indicating outcome confirmation can shift from an internal platform process to a service provided by professional data suppliers and reused by multiple markets.
Deterministic outcomes matter not just because they're easier to automate, but because they are the first to prove outcome confirmation can be broken down into standard interfaces and become a foundational product of the outcome layer.
4.2 AI's Value Lies in Compressing Evidence Costs
Deterministic outcomes can read data directly, but more prediction markets face another type of problem: rules are written, but relevant evidence is scattered across announcements, news, regulatory filings, or different information sources, sometimes conflicting. Here, the true time-consumer is often not the final judgment, but finding materials, filtering valid evidence, and organizing the rationale for judgment.
AI is best suited for precisely this part of the work. It can accelerate information retrieval, synthesize different sources, identify evidence conflicts, and generate an evidence package for final judgment. But whether it can directly replace outcome adjudication depends on actual test performance.
A study on UMA dispute markets showed AI achieved 89.58% consistency in post-dispute review, but its recall rate for pre-dispute identification was only 33.88%. The former indicates that with complete data, AI can often replicate the final judgment, but doesn't mean it found the 'true answer' independent of the original ruling; the latter shows AI cannot yet identify most high-risk markets in advance.
Therefore, AI is currently better placed in the middle of the judgment process, not the final step. What AI truly reduces is the evidence processing cost *before* reaching judgment.
Thus, a more feasible division of labor is: machines handle reading clear data, AI handles evidence retrieval, filtering, and organization, and humans make final judgments on markets with ambiguous rules, large amounts, or conflicting evidence.

Once this division of labor is standardized, outcome confirmation is no longer just an internal operational process within a single platform. Rule comparison, evidence verification, outcome confirmation, and payment triggering can be broken into independent interfaces, offered for repeated calls by multiple platforms, market makers, institutions, and Agents.
This is precisely the starting point of the outcome layer: turning rules, evidence, and settlement capabilities originally dispersed within individual platforms into infrastructure that can be purchased cross-platform. The next chapter addresses how these capabilities form revenue once they start being called upon repeatedly.
05 | The Path to Monetizing Interpretation Power Has Emerged: The Outcome Layer Is Forming a Second Profit Pool
When rule comparison, evidence verification, outcome confirmation, and payment triggering become interfaces reusable across platforms, their revenue no longer comes solely from final settlement, but also from the repeated invocation of these four capabilities throughout the trading chain. At this stage, interpretation power ceases to be merely governance authority and begins generating a second profit pool.
But for the outcome layer to form independent revenue, two conditions must be met: the same set of capabilities must be reusable across different markets, not rebuilt for each event; and platforms, institutions, or developers must be willing to pay continuously for these calls.
HIP-4 first proved the first condition—outcome confirmation can not only be automated but can also be replicated across different types of markets.
5.1 HIP-4 Validates the Product Cycle for Outcome Assets, But Volume Remains Unstable
As previously shown, HIP-4 proves deterministic outcomes like prices can be read by machines and settled automatically. Its further commercial significance is that the same trading and confirmation process need not serve only one event.
When a new outcome market launches, the platform doesn't need to rebuild the entire system from scratch. Market creation, rule encoding, order distribution, liquidity integration, outcome confirmation, and fund payment can all follow the already established flow:
Event written as rules → Rules generate outcome assets → Market trades continuously → Machine confirms outcome → Funds auto-pay → Template reused for next batch of events
This reusability has been validated in real trading volume. Within less than three months of HIP-4's launch, cumulative volume reached approximately $277 million, with nearly 30-day volume around $182 million. This shows users are indeed willing to trade outcome assets confirmed and auto-settled by machines, not just accepting the product conceptually.
The volume structure also shows the same infrastructure can serve different types of demand. Sports markets contributed about 82% of this volume, but after the peak from major events subsided, trading activity primarily returned to crypto asset markets. Sports markets provide event-driven volume peaks; crypto assets provide higher-frequency, more stable daily demand.
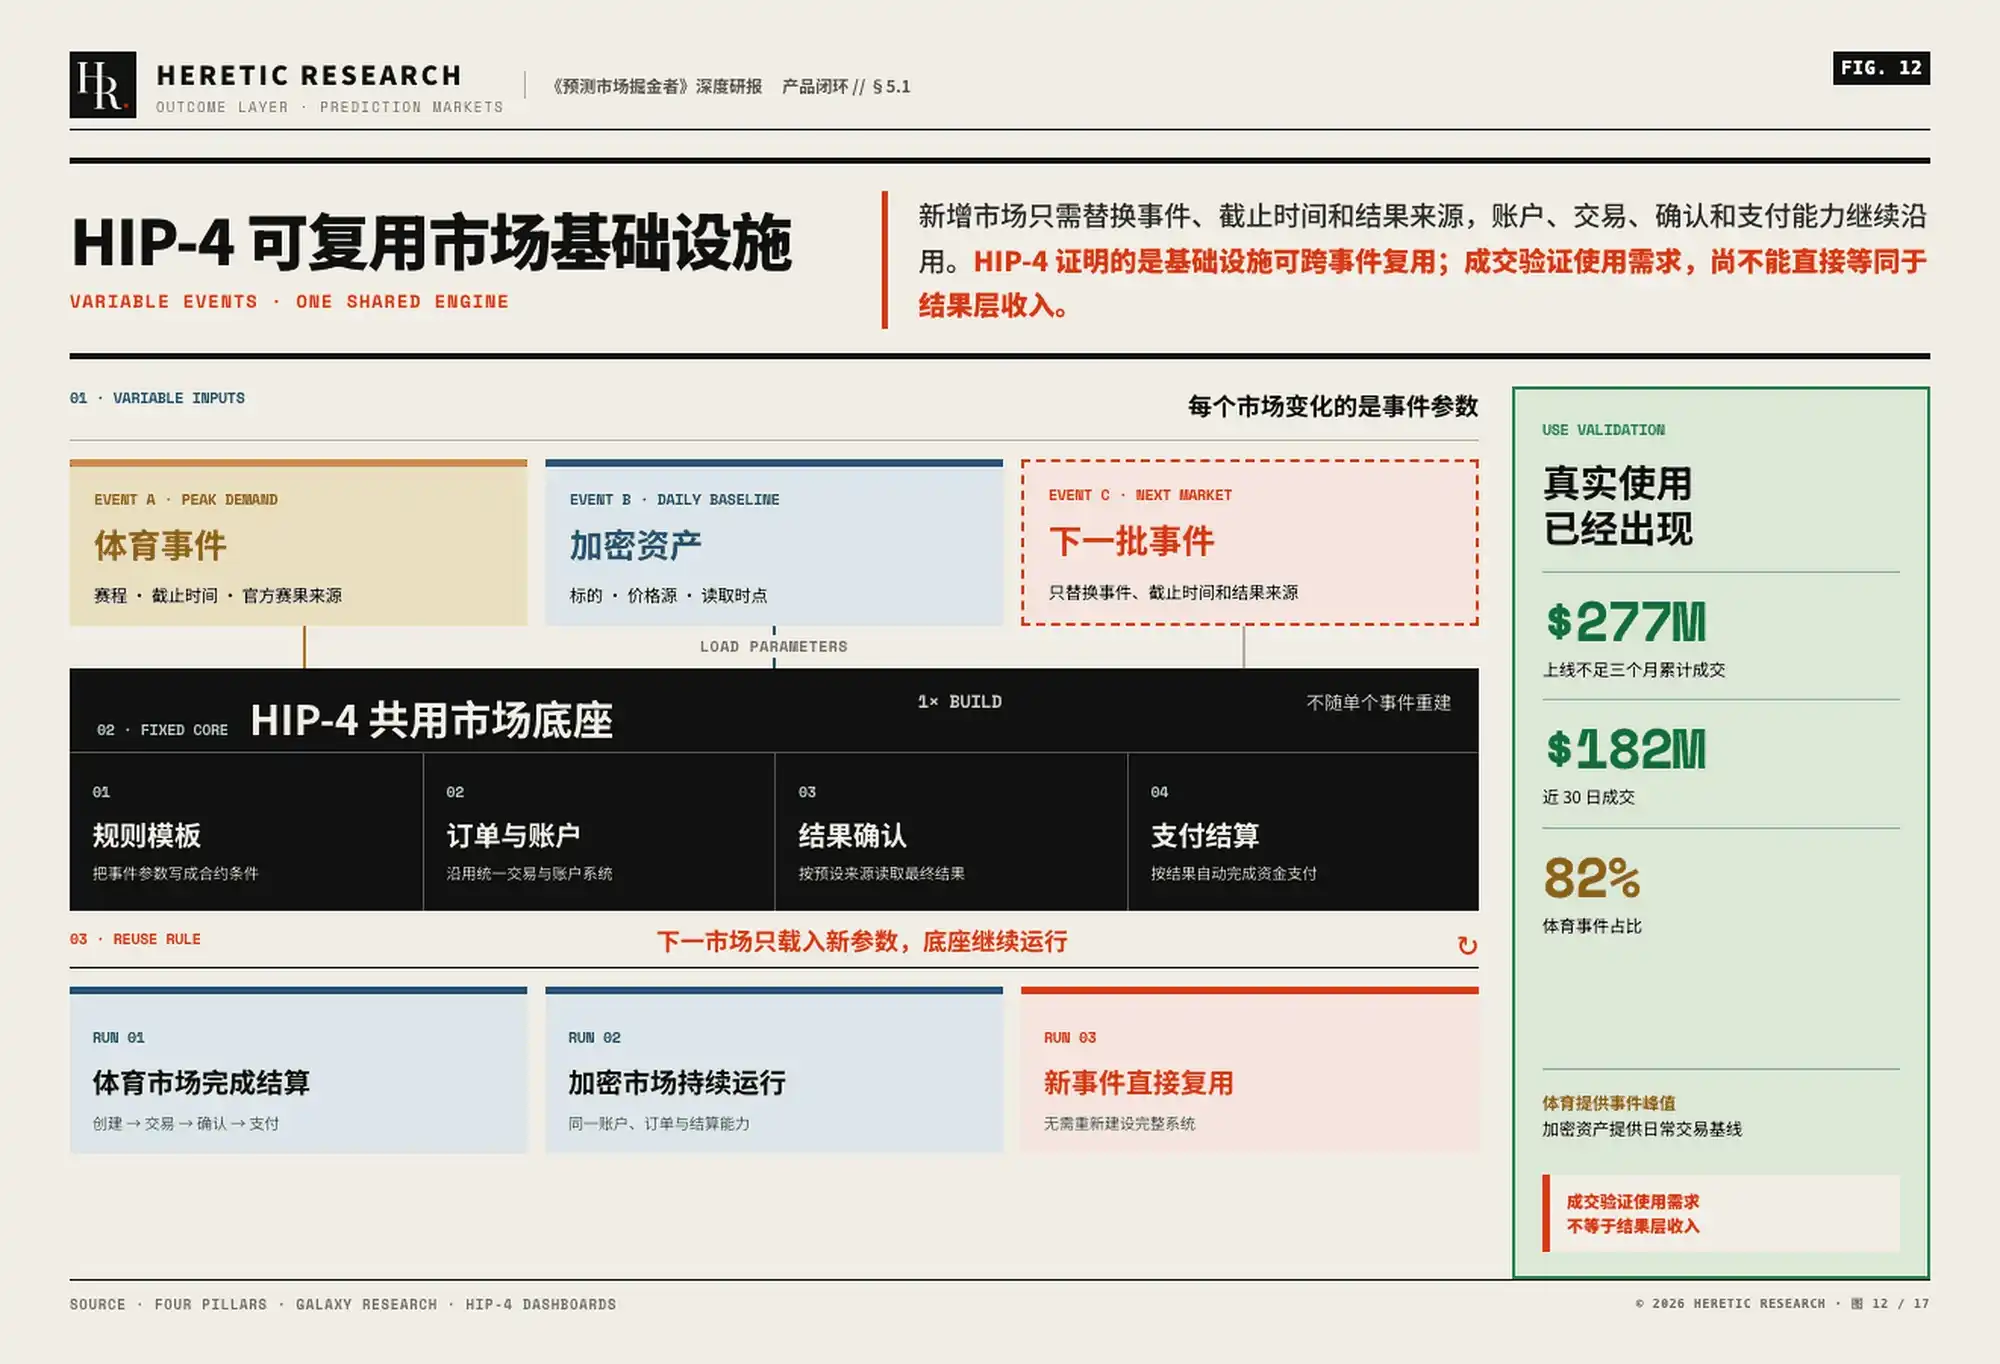
This gives the outcome layer growth characteristics akin to software and data infrastructure: new markets no longer build settlement processes from zero; the four outcome layer capabilities, once built, can be replicated across events. More trading categories mean more calls, increasing the marginal value of the standard interface. But whether call demand translates into independent revenue depends on who is willing to pay and under what pricing model.
5.2 Calls, Workflows, and Data Licensing: Three Revenue Paths and the Migration of Payers
The outcome layer can generate revenue along three paths: outcome calls & payment triggering, institutional data & audit workflows, and outcome data licensing & distribution. The three paths correspond to different buyers, purchasing reasons, and billing units.

The three revenue types are not equally important: institutional contracts can improve revenue stability; data subscriptions and licensing can increase recurring revenue share and improve valuation quality; but scale expansion still primarily relies on outcome calls and settlement fees.
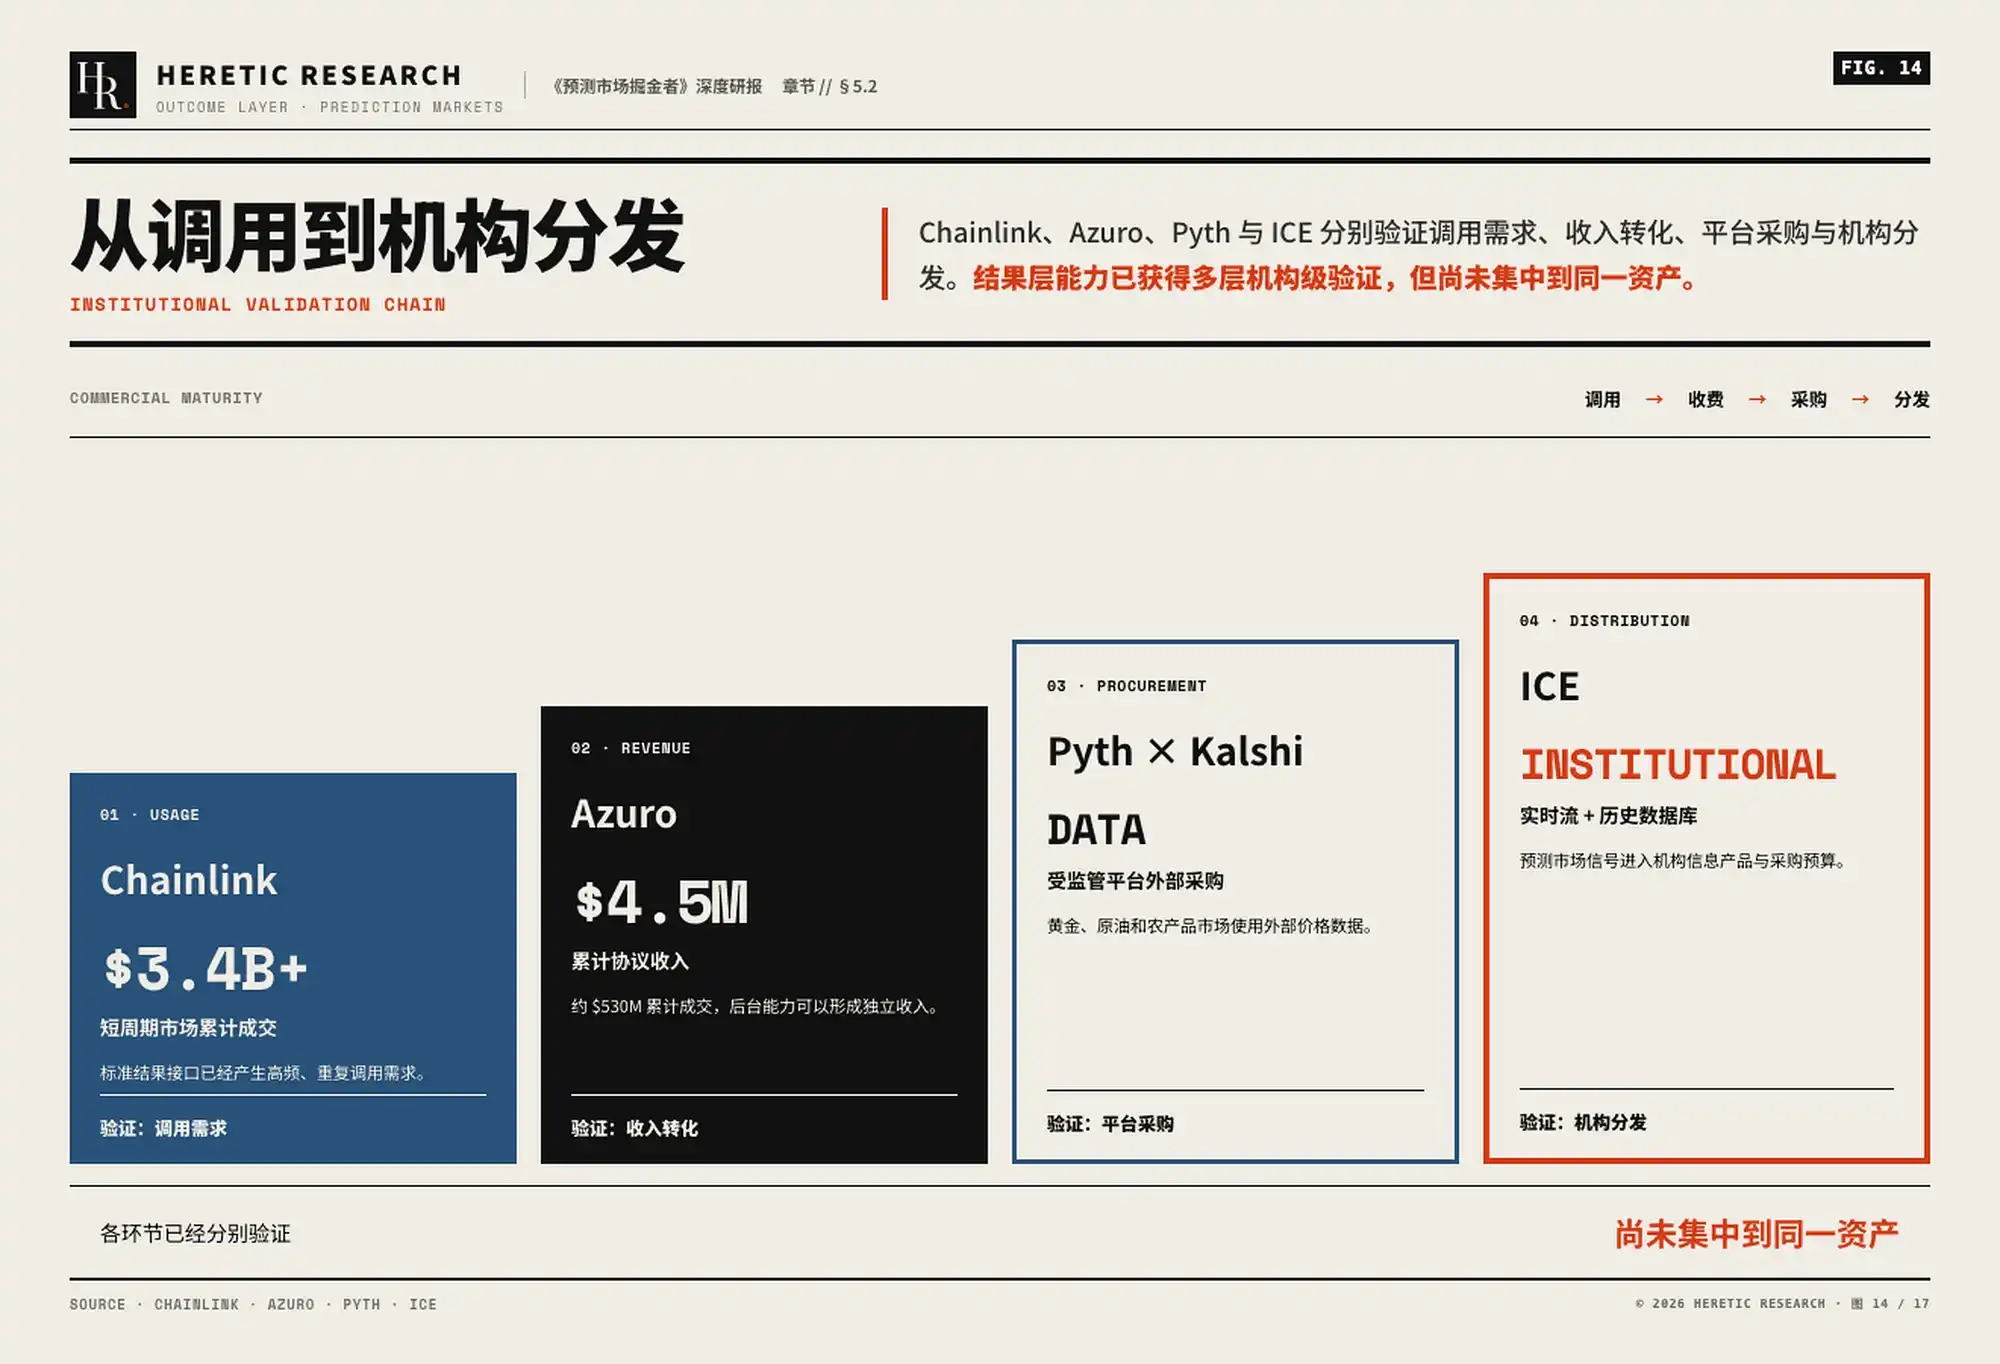
Looking at four existing suppliers, payers are gradually expanding from on-chain protocols to regulated platforms and institutional budgets:
- Chainlink: Proves high-frequency demand exists for outcome interfaces.
Polymarket's short-cycle crypto markets powered by Chainlink have accumulated over $3.4 billion in volume. This data proves that when outcomes can be automatically confirmed by standardized data, the same interface can be called repeatedly by numerous markets.
- Azuro: Proves infrastructure calls can translate into actual revenue.
Azuro generated approximately $4.5 million in cumulative protocol revenue from about $530 million in cumulative volume. It provides not just final outcomes, but also infrastructure like market creation, data provision, and settlement. This shows the back-end capabilities of prediction markets aren't just internal platform costs; they can also form independent revenue through protocol fees and revenue sharing.
- Pyth: Proves regulated platforms also procure external outcome data.
Kalshi uses data provided by Pyth for some of its gold, crude oil, and agricultural commodity markets. Unlike on-chain protocols charging per call, this cooperation is closer to an exchange procuring external market data and settlement inputs, with the payment logic shifting from on-chain traffic to compliance, reliability, and division of responsibility.
- ICE: Proves prediction market data can enter institutional information products.
ICE integrates Polymarket's probability and sentiment data into real-time data feeds and historical databases, distributing it to institutional clients. At this stage, what's being sold is no longer just the final outcome of a specific market, but the data itself continuously generated by prediction markets. The billing method also shifts towards data subscriptions, licensing, and revenue sharing.
These four cases prove, at different points, that the outcome layer can generate revenue: Chainlink proves call demand, Azuro proves protocol fees, Pyth proves regulated platforms are willing to procure external inputs, and ICE proves outcome data can enter institutional distribution systems.
Combined with HIP-4 from the previous section, a relatively complete chain of outcome layer commercialization has emerged:
Outcome products are traded → Interfaces are called repeatedly → Platforms procure external capabilities → Outcome data enters institutional workflows
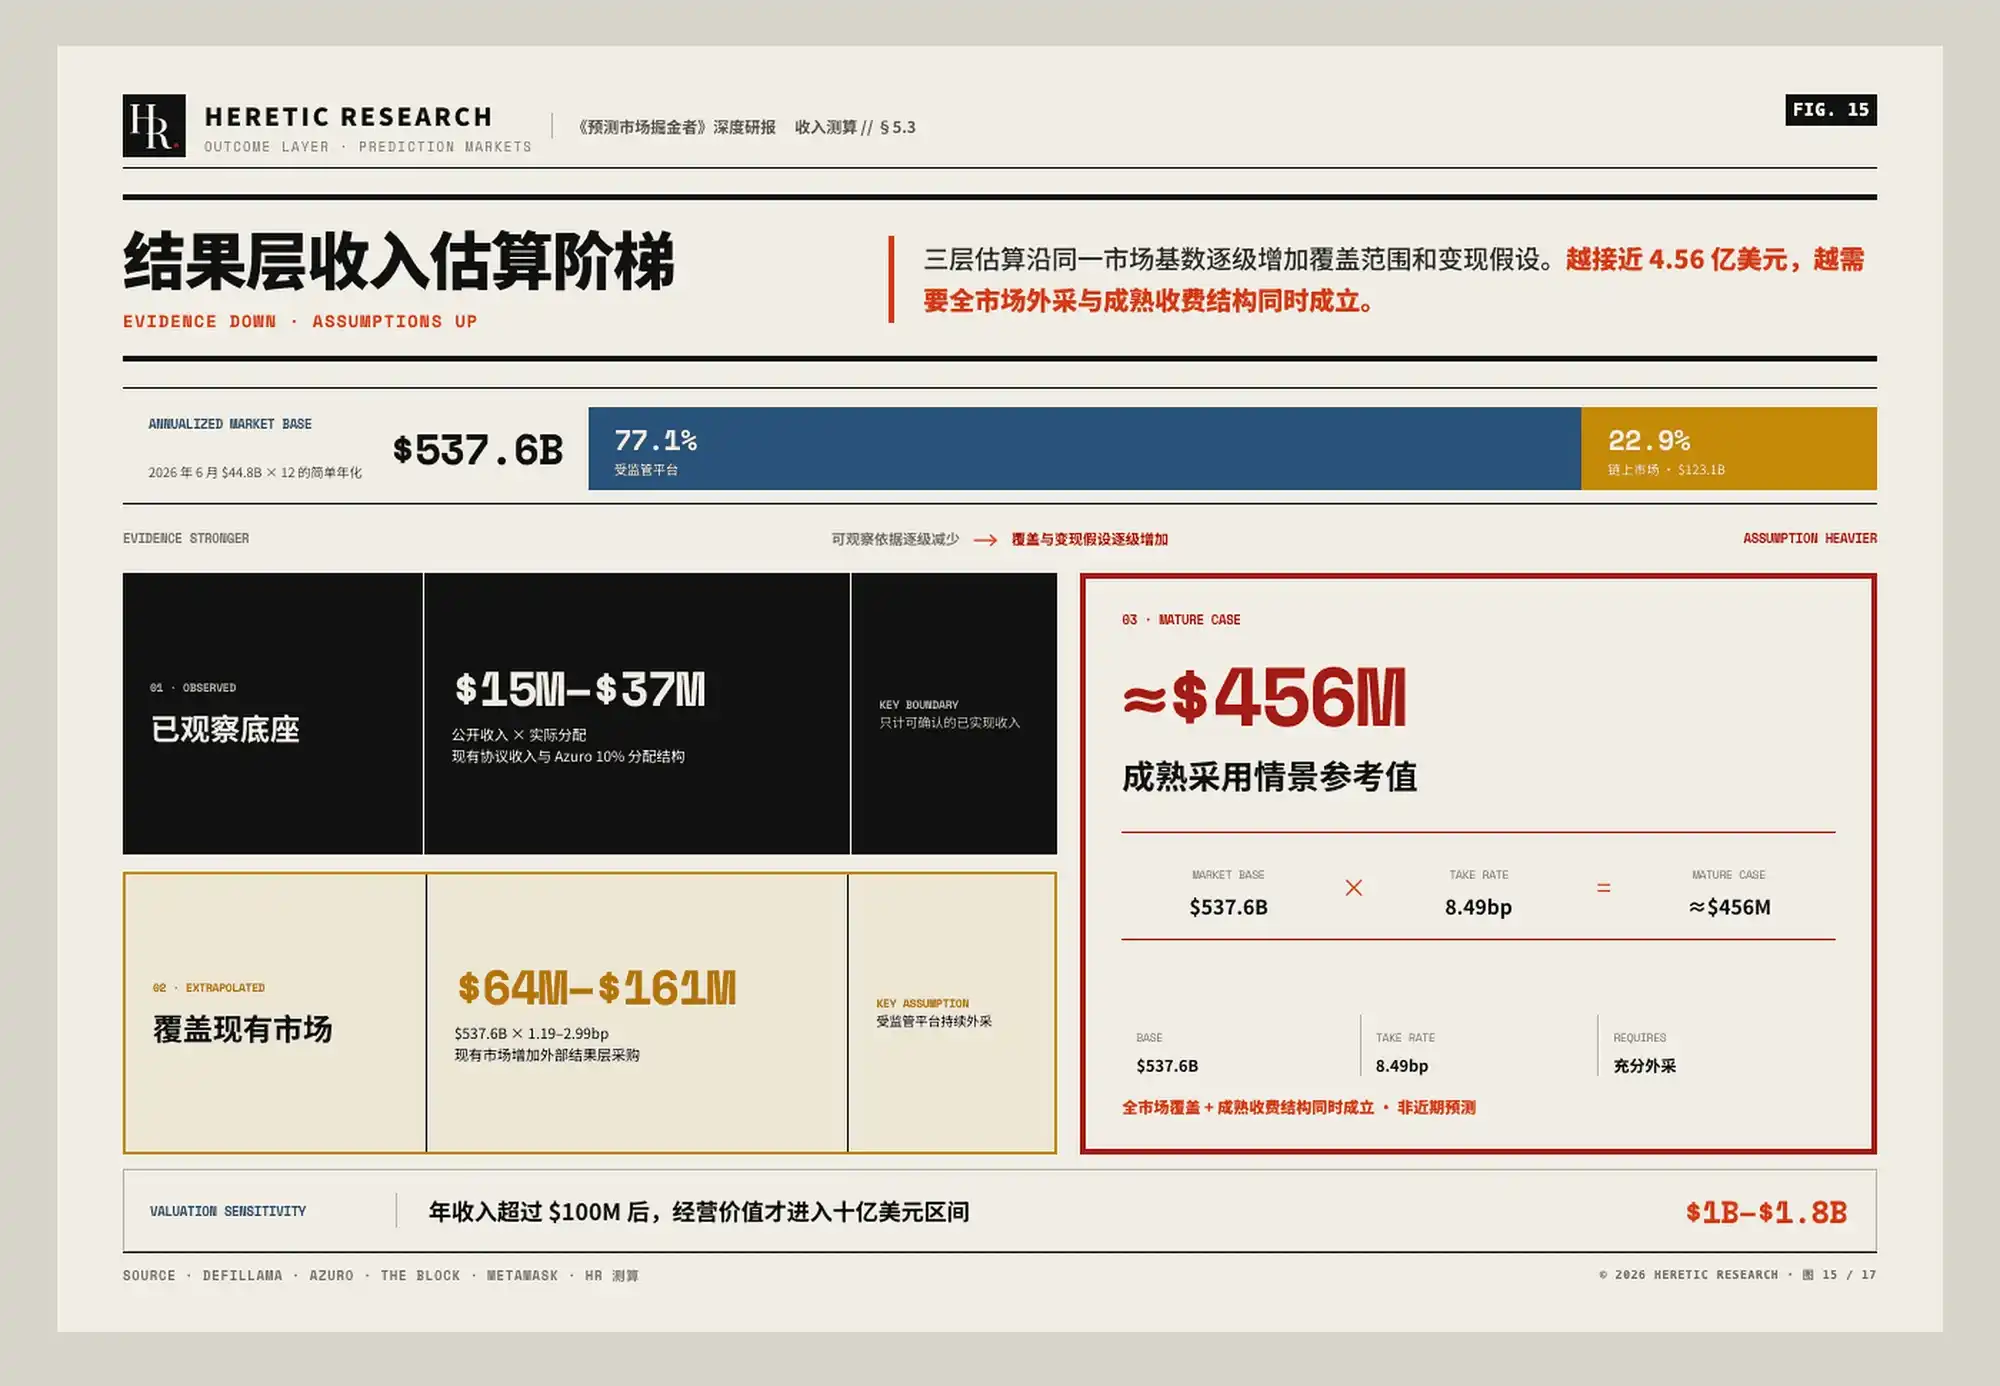
Market structure also dictates the importance of different revenue paths. In June 2026, Kalshi, Polymarket US, and Polymarket International combined for $44.8 billion in volume, corresponding to a simple annualized run rate of $537.6 billion. Regulated markets accounted for 77.1%, while on-chain markets accounted for 22.9%.
The two market types have different needs for the outcome layer. On-chain markets typically split outcome confirmation to oracles, dispute mechanisms, and smart contract payments, making them more suitable for fees based on call volume, settlement count, or protocol share. Regulated platforms retain final settlement responsibility but may still procure external data, audit tools, and institutional distribution services, making them more suitable for annual contracts, API subscriptions, and data licensing.
Since regulated markets already constitute the majority of volume, future larger revenue increments for the outcome layer may come from compliant data, audit tools, and institutional workflows, rather than simply replicating the on-chain dispute fee model. However, this judgment has an important premise: the relevant capabilities must be offered by independent suppliers externally. If exchanges choose to build and use them internally long-term, these capabilities remain internal platform costs and cannot be extrapolated as external outcome layer revenue based on total market volume.
5.3 From a Tens-of-Millions Foundation to a Hundreds-of-Millions Second Profit Pool
The previous section proved the outcome layer has real demand, with fee models like protocol sharing, external data procurement, and institutional licensing already appearing. But the industry does not separately disclose 'outcome layer revenue,' so a complete market size cannot be derived directly.
Therefore, this section employs a three-step estimation:
- Start from already generated protocol revenue to estimate currently observable outcome layer revenue.
- Assume the same monetization capability covers existing prediction markets to estimate expandable revenue space.
- Reference projects with proven business models to estimate the revenue ceiling under more mature conditions.
These three tiers are not three independent forecasts but three stages on the same commercialization path. Later stages imply higher potential revenue but rely on stronger assumptions.
Current Observable Commercialization Base: $15–37 million
As of July 28, 2026, DefiLlama tracked 33 on-chain prediction market protocols with combined annual revenue of approximately $146 million, and 30-day revenue of approximately $30.26 million.
However, this revenue does not all belong to the outcome layer; it includes platform, liquidity, and other protocol segment revenue. To estimate the portion attributable to the outcome layer, we can refer to Azuro's actual revenue distribution rule: 10% of pool profits are allocated to Data Providers.
Applying this ratio:
- Annual revenue corresponds to outcome layer revenue of approximately $14.61 million.
- Simple annualization of 30-day revenue corresponds to approximately $36.82 million.
Rounded, the currently observable outcome layer revenue supported by public data and actual distribution rules is approximately $15–37 million.
This range is not the industry's complete revenue, only the portion confirmable from public data. It represents commercialization revenue that has already begun, not a future prediction.
Covering Existing Markets: $64–161 million
Using the June volume figures, on-chain markets correspond to an annualized volume of approximately $123.1 billion. Dividing the observable outcome layer revenue estimate by on-chain volume yields the currently observable outcome layer monetization rate:
$15–37 million ÷ $123.1 billion = 1.19–2.99 basis points (bp)
Here, 1.19–2.99 bp means that for every $10,000 in prediction market volume, approximately $1.19–$2.99 of outcome layer revenue is currently generated.
If this monetization rate applies not just to on-chain markets but to the entire current prediction market, the corresponding industry annual revenue would be approximately $64–161 million.
This tier does not assume further high growth for prediction markets, only that existing volume increasingly utilizes external outcome layer services. However, it still depends on two conditions: outcome confirmation, data provision, and payment triggering cover existing trading volume; regulated platforms consistently outsource data, audit, and outcome workflows to external suppliers, forming observable contracts, invoices, and renewals.
Mature Productization Ceiling: Approximately $456 million
The second tier used the industry's current low monetization rate. To estimate revenue levels under a more mature business model, we can refer to the fee structure already proven by Azuro.
Azuro's cumulative protocol revenue constitutes approximately 84.9 bp of its cumulative volume. About 10% is allocated to Data Providers, so the corresponding outcome layer monetization rate is approximately:
84.9 bp × 10% = 8.49 bp
This means for every $10,000 in volume, approximately $8.49 of outcome layer revenue is generated. This is not a theoretical rate but one achieved by a project actually operating. If the entire prediction market reached this monetization rate, the corresponding outcome layer industry annual revenue would be approximately $456 million.
It requires the outcome layer not only to cover more markets but also to secure a higher revenue share in rule comparison, evidence verification, outcome confirmation, and payment triggering. Therefore, $456 million is better considered a reference ceiling under a mature business model, not a near-term forecast.
The 10–18x figure is derived from transactions involving data and financial infrastructure companies like IHS Markit, Black Knight, and Adenza, used to value industries with recurring and highly visible revenue.
Once the outcome layer's full-scale annual revenue surpasses $100 million, it corresponds to an enterprise value of $1–1.8 billion, and the industry transitions from early product validation to an institutionally investable stage.
Demand, fees, and distribution have all emerged, yet they remain scattered across different platforms and suppliers: HIP-4 generates calls, Azuro forms revenue shares, Pyth, Chainlink, and ICE occupy data and distribution interfaces. The industry value of the outcome layer is already measurable; investment returns will next depend on who can solidify these calls into sustained, attributable revenue.
06 | How Industry Trends Map to Investable Assets
The previous five chapters derived why the market needs an outcome layer, how it forms products, and its potential revenue size. The next natural question is: even if the outcome layer possesses industry value, can investors gain exposure through existing assets?
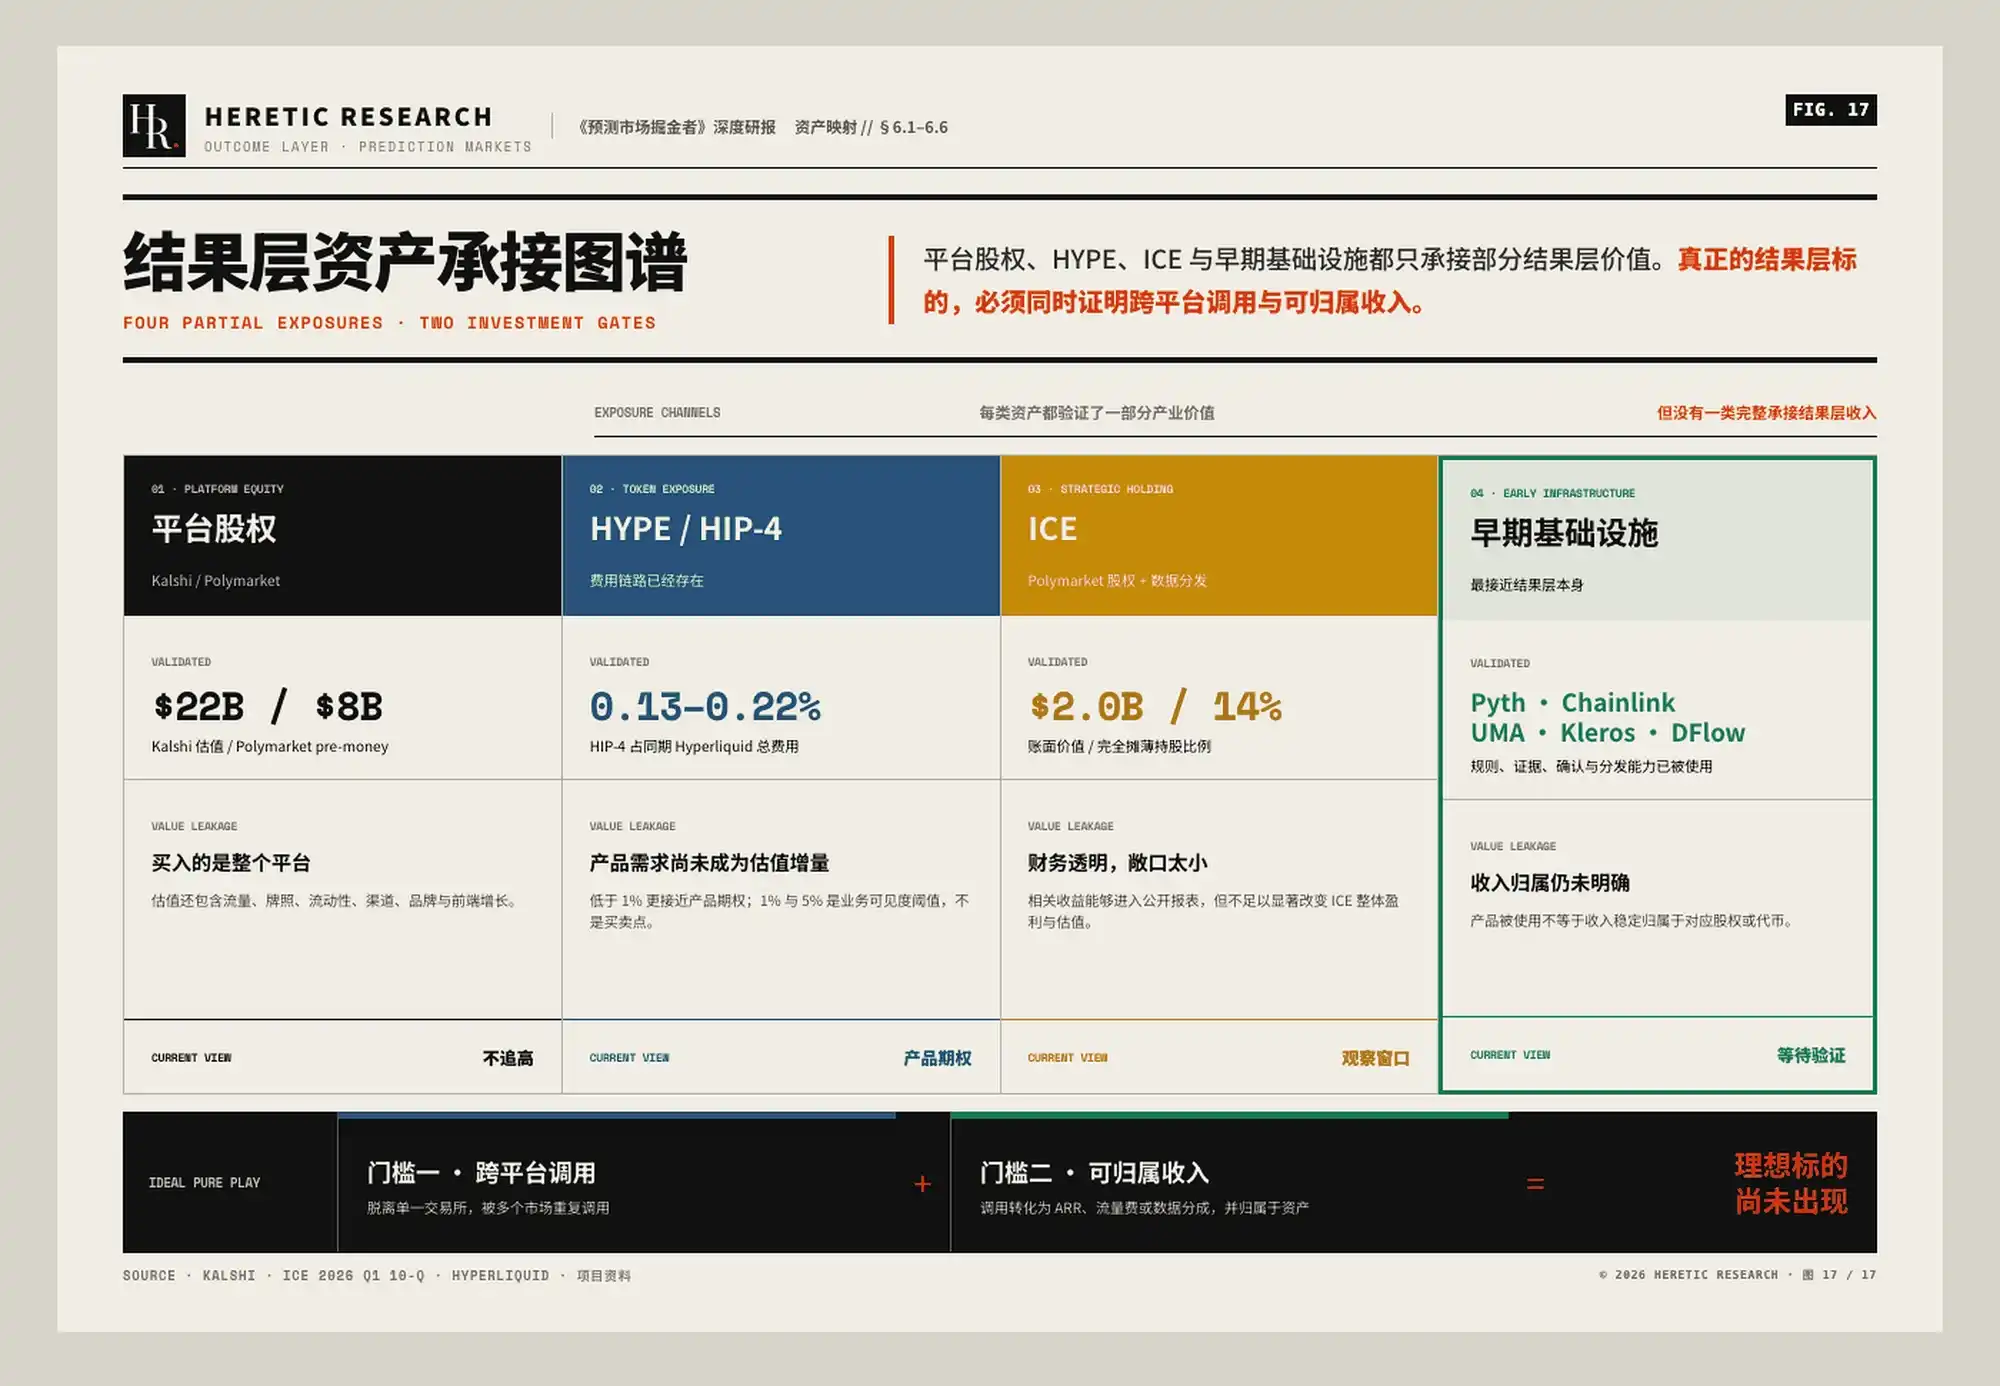
6.1 Prediction Platform Equity Includes Outcome Layer Capabilities But Isn't the Most Direct Investment Vehicle
The most intuitive investment is holding equity in prediction market platforms. However, platform valuations incorporate not just the outcome layer, but also trading flow, licenses, liquidity, user channels, brand, and prediction market growth expectations.
Currently, two major valuation anchors can be observed: Kalshi completed a new funding round in May 2026 with a $22 billion valuation. Polymarket's valuation at the time of ICE's investment in October 2025 was approximately $8 billion pre-money. ICE subsequently made a direct investment of $600 million in March 2026.
This means that while platform equity provides exposure to prediction market growth, it is not the purest investment vehicle for the outcome layer. Buying platform equity at current valuations means investors primarily pay for trading growth, licenses, and network effects, not a separately validated outcome layer asset.
Therefore, our judgment is clear: Currently not chasing platform equity highs.
6.2 Investment Threshold: Cross-Platform Adoption & Attributable Revenue
Four industry positions have emerged around the outcome layer. Their weighting differs, ranked from highest to lowest direct revenue attribution:
- Deterministic Data & Machine Confirmation – Pyth and Chainlink;
- Subjective Outcomes & Dispute Processing – Dispute arbitration mechanisms like UMA, Kleros;
- Application Distribution & Workflow Entry Points – Distribution interfaces like DFlow, Agent interfaces, and professional rule tools, termed Builder applications in this report;
- Institutional Data Standardization & Distribution – ICE, discussed separately in 6.4.
The first two directly hold revenue attribution for the outcome layer, the third depends on growth realization, and the fourth is already embedded in a public company's financials.
Primary markets should prioritize researching two types of projects: those capable of cross-platform adoption, not reliant on a single exchange; and those that can convert adoption into ARR, flow fees, or data shares. The final step for asset validation is revenue attribution. The easiest place to test this criterion is HIP-4, which already has volume, fees, and a token.
6.3 HYPE: Can Access Platform Growth, But HIP-4 Hasn't Yet Contributed Significant Fees
HYPE is currently one of the easiest-to-trade related assets, but it represents Hyperliquid's overall platform growth, not pure outcome layer revenue. To judge if HIP-4 already impacts HYPE, the key isn't the volume itself, but the proportion of fees it generates relative to Hyperliquid's total fees.
HIP-4 Fee Contribution = HIP-4 Fees ÷ Total Hyperliquid Fees
Based on the recent 30-day volume of $182 million and an estimated fee rate of 4–7 bp, HIP-4's monthly fees are approximately $72.8k–$127.4k. During the same period, Hyperliquid's total fees were approximately $57.5 million, making HIP-4's fee contribution only 0.13%–0.22%.
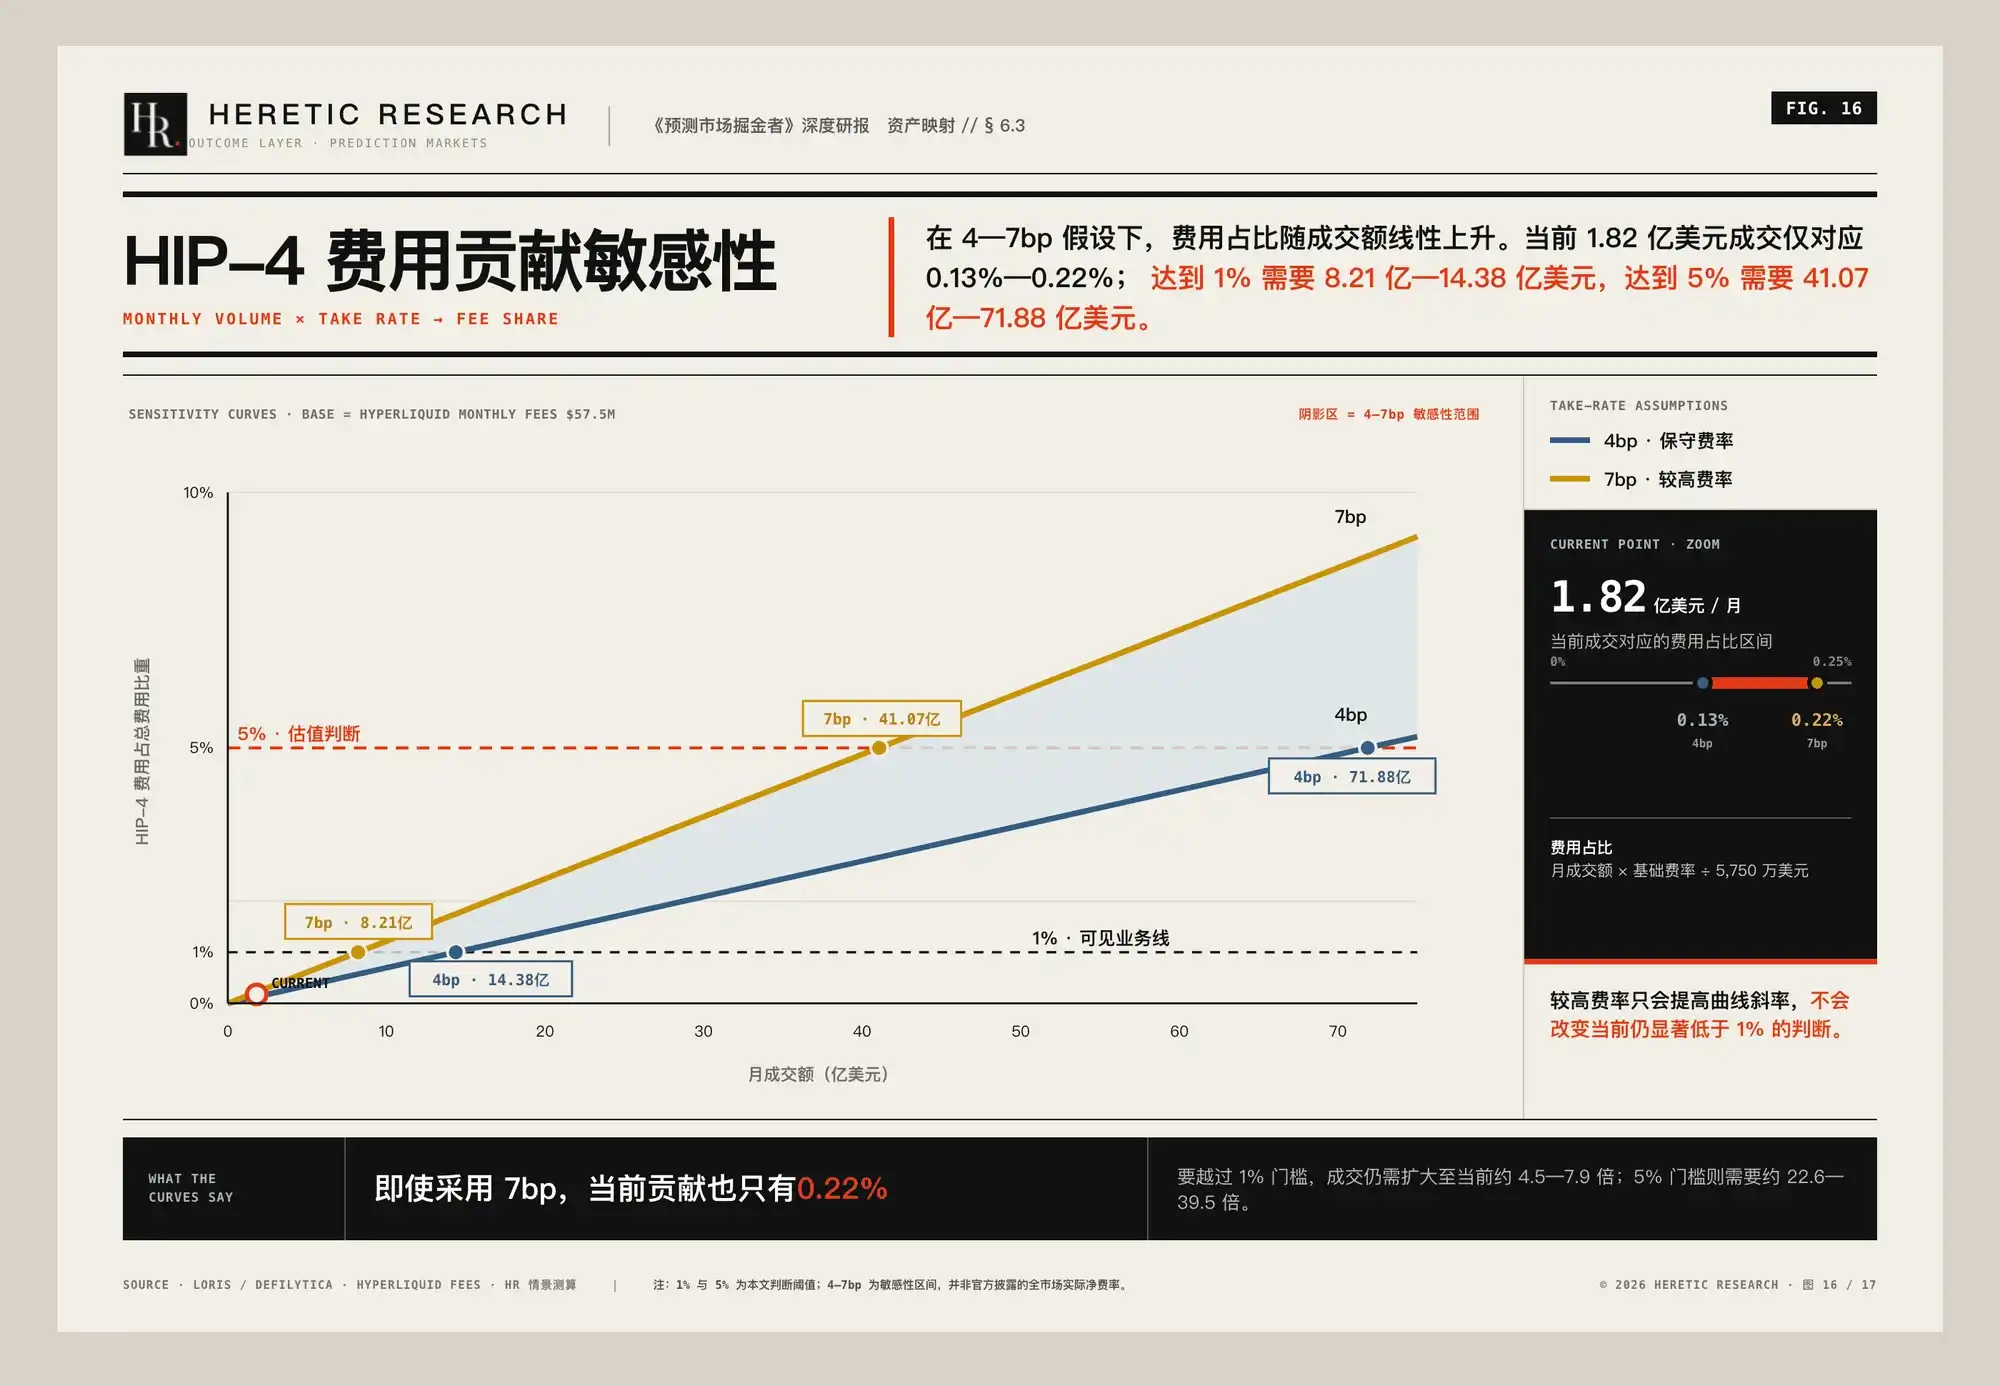
The current share indicates HIP-4 has validated product demand but isn't yet a significant independent valuation driver for HYPE. When the fee share is below 1%, it's more akin to a product option; stable exceedance of 1% starts making it a visible business line; exceeding 5% could materially impact HYPE's valuation assessment.
HIP-4's significance lies in the existence of this fee pathway. As outcome markets increase and trading shifts from event peaks to more stable daily demand, its revenue may gradually enter protocol fees.
6.4 ICE: Financially Transparent, But Outcome Layer Exposure Too Small
ICE is currently the most verifiable public asset related to prediction markets. It holds Polymarket equity and has integrated Polymarket data into institutional feeds and historical databases. Therefore, both equity value from prediction markets and data distribution value have the potential to enter public financial statements.
As of March 31, 2026, the carrying value of ICE's Polymarket Series D/E preferred shares was approximately $2 billion, corresponding to about 23% of issued shares and roughly 14% of fully diluted ownership. In Q1 2026, ICE recognized approximately $389 million in non-cash fair value gains due to observable price changes.
ICE's advantage is clear verification, but relative to ICE's overall business scale, this exposure remains too small to significantly alter company earnings and valuation. Thus, ICE is better suited as an observation window for whether outcome layer commercialization is entering institutional budgets and public filings, not a high-elasticity investment target.
6.5 Early-Stage Projects & Infrastructure Protocols: Closest to the Outcome Layer, But Revenue Attribution Not Yet Clear
Compared to HYPE and ICE, oracles, dispute arbitrators, distribution interfaces, and professional Builders are closer to the outcome layer itself. Pyth and Chainlink provide deterministic data and machine confirmation; UMA and Kleros handle subjective outcomes and disputes; projects like DFlow connect platforms, Agents, and application workflows.
The advantage of such projects is greater business focus and a higher likelihood of directly capturing cross-platform calls. However, most currently share the same issue: product usage does not equal revenue stably attributable to equity or token holders. Metrics like partner platform count, supported markets, and call volume can prove demand but cannot alone prove investment value.
Therefore, judging the viability of such assets requires continued observation of two indicators: first, the ability to detach from a single platform and be called repeatedly by multiple markets; second, the ability to convert these calls into ARR, flow fees, or data shares clearly attributable to the corresponding asset.
The closest opportunities to the outcome layer currently remain concentrated in these early-stage projects, just that the complete revenue loop hasn't yet materialized. Whoever first solidifies cross-platform calls into attributable, recurring revenue may become one of the first true outcome layer assets.
6.6 Current Conclusion: Opportunity Is Forming, But Ideal Targets Haven't Emerged
The industry logic for the outcome layer is gradually solidifying, but investable targets remain early-stage. Platform equity is overvalued, HYPE hasn't yet gained significant fee contribution, ICE's related exposure is insufficient for high elasticity; and early-stage projects truly close to the outcome layer are still awaiting validation of cross-platform adoption and revenue attribution.
This means the most important task now isn't forcefully picking a 'outcome layer target,' but tracking who first meets two conditions: first, offering rule, evidence, and outcome confirmation capabilities to multiple platforms; second, converting these calls into sustained revenue attributable to equity or tokens.
07 | Conclusion: The Earliest Alpha Often Appears Before the Asset Takes Shape
The rapid growth of prediction markets has historically occurred on the front end: more platforms entering, more categories launching, with traffic, licenses, and liquidity becoming the competitive core.
But as market scale expands, costs arising from rule interpretation, evidence verification, and outcome confirmation rise simultaneously. Each platform independently building its own process not only leads to duplicated investment but also creates incompatible standards. These capabilities, originally dispersed within platforms, thus begin to meet the conditions for standardization and shared use by multiple markets.
Different platforms need to read the same facts, process similar evidence, interpret analogous rules, and bear the same erroneous settlement risks. Today, these capabilities remain scattered among oracles, dispute mechanisms, data suppliers, and platform operations teams. Once standardized, they could become infrastructure commonly procured by multiple markets, much like market data, clearing, and payments.
This is where the outcome layer truly warrants attention. It doesn't need to compete anew for every trader but grows alongside the increase in market count, trading categories, and settlement events, servicing already existing trading demand. Front-end competition determines where traffic flows; the outcome layer will become a layer that traffic must call upon regardless of which platform it passes through.
Currently, this market hasn't formed a clear leader, nor has revenue stabilized under a specific asset class. But the most valuable stage of an industry opportunity is often not after the landscape is set, but when cross-platform demand begins to appear, product boundaries gradually clarify, and revenue attribution remains inadequately priced.
Therefore, what truly needs tracking next is who starts serving multiple platforms simultaneously, who turns rules, evidence, and outcome confirmation into standard products, and who first solidifies these calls into recurring revenue.
The first phase of prediction markets belonged to the expansion of trading entrances. In the next phase, value will increasingly flow to infrastructure that doesn't directly own users but determines how markets complete final payments.
Heretic Research will continue tracking the process of rule, evidence, and outcome confirmation capabilities evolving from internal platform functions to industry-wide infrastructure, focusing on changes in cross-platform adoption, fee models, and revenue attribution. When a clearer industry landscape and investable assets begin to emerge, this research will be updated accordingly.