After a significant year-end correction, Bitcoin has entered 2026 with a clearer market structure. Current profit-taking pressure has eased, and market risk appetite is gradually recovering. However, establishing a sustained upward trend still crucially depends on stabilizing and reclaiming key cost-based support levels.
Summary
· Bitcoin has officially entered 2026 after experiencing a deep correction and months of consolidation. On-chain data shows that profit-taking pressure has significantly eased, with the market structure showing initial signs of stabilization near the lower end of the trading range.
· Although selling pressure has diminished, a substantial amount of overhead supply from previously trapped buyers remains concentrated in the upper half of the current range. This will continue to cap upside potential, highlighting the importance of breaking through key resistance levels to resume the upward trend.
· Demand from digital asset treasury companies continues to provide underlying support for Bitcoin's price, but this demand is characterized by sporadic pulses, lacking sustainability and structural consistency.
· After net outflows in late 2025, U.S. spot Bitcoin ETF flows have recently shown signs of returning to net inflows. Concurrently, futures market open interest has stopped declining and begun to recover, indicating that institutional investors are re-engaging and derivatives activity is rebuilding.
· A record volume of options positions concentrated and expired at year-end, with over 45% of open interest being cleared. This removed structural hedging constraints from the market, allowing genuine risk appetite to be more clearly reflected in prices.
· Implied volatility has likely reached a cyclical bottom. Early-year buyer demand is gently pushing the volatility curve higher, though it remains in the lower part of its three-month range.
· As put option premiums narrow and call option trading volume increases, market skew is steadily normalizing. Since the new year, options trading has clearly tilted bullish, indicating investors are shifting from defensive hedging to actively positioning for upside opportunities.
· Market maker positions have turned net short in the $95,000 to $104,000 range. This means their hedging activity will passively amplify any price moves upward into this zone. Additionally, the premium behavior around the $95,000 strike call options shows that long position holders are inclined to hold rather than rush to take profits.
Overall, the market is gradually transitioning from a defensive deleveraging phase to selectively increasing risk exposure, entering 2026 with a clearer structure and greater resilience.
On-Chain Insights
Significant Easing of Profit-Taking Pressure
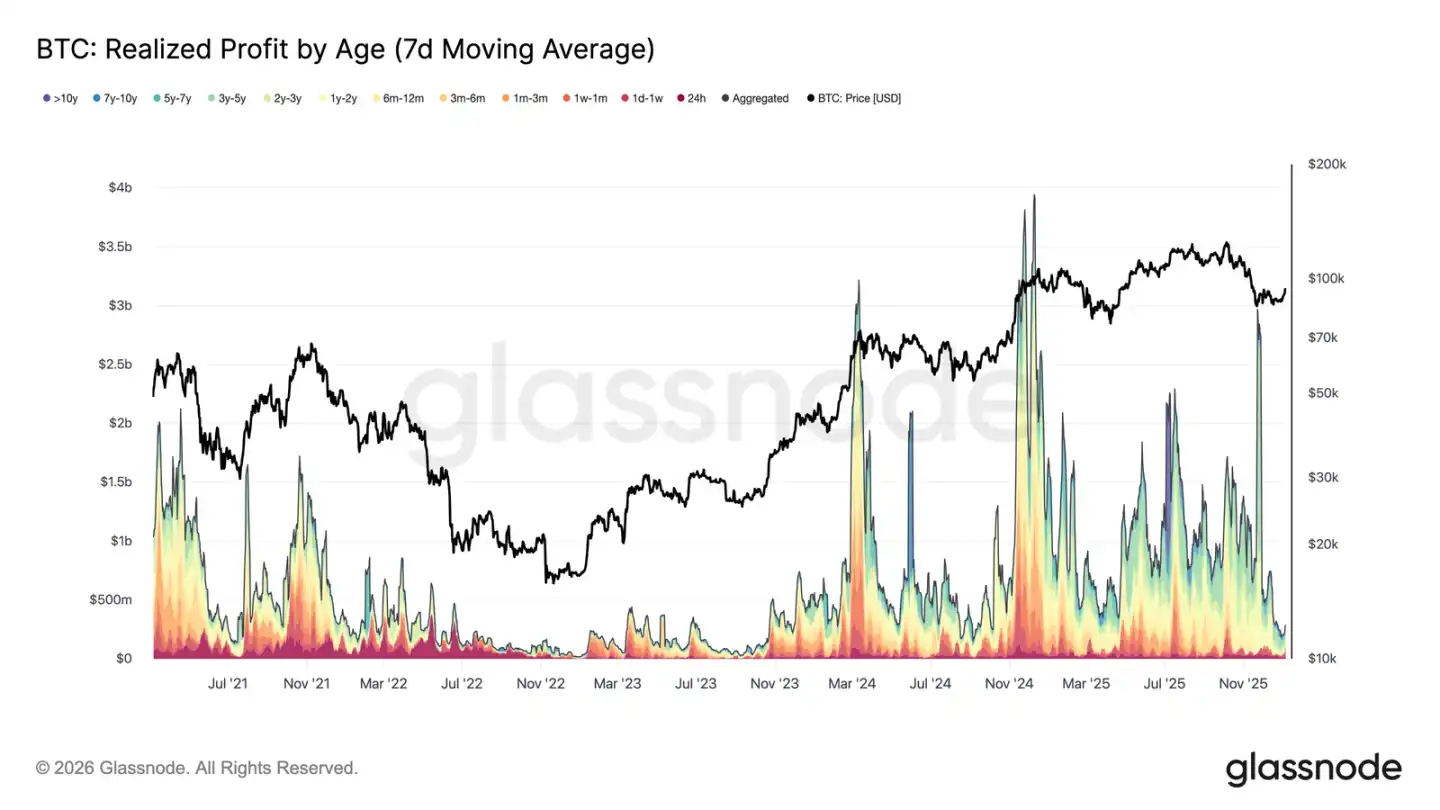
In the first week of 2026, Bitcoin broke out of a multi-week consolidation range around $87,000, rising approximately 8.5% to a high of $94,400. This rally is built on a foundation of significantly cooled overall profit-taking pressure. In late December 2025, the 7-day average realized profit fell sharply from levels often above $1 billion per day for much of Q4 to $183.8 million.
The decline in realized profit, particularly the reduced selling pressure from long-term holders, indicates that the main selling force previously suppressing prices has been released for now. As selling pressure weakened, the market stabilized and regained confidence, paving the way for the recent price increase. Therefore, the年初的突破标志着市场已有效消化获利抛压,为价格上涨打开空间.
Confronting Overhead Supply Resistance
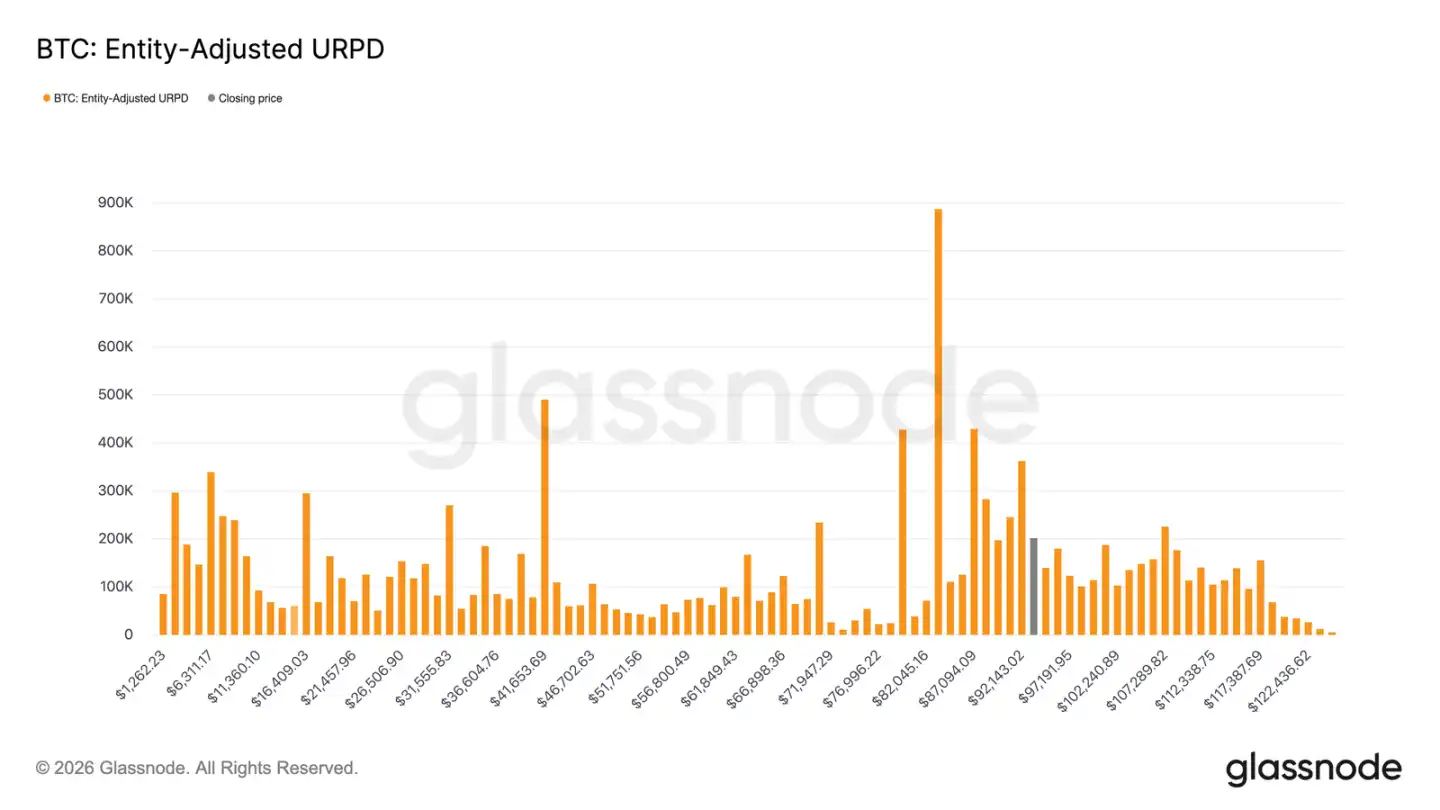
As profit-taking pressure eases, prices can move higher, but the current rebound is entering a supply zone composed of various cost bases. The market has now entered a range largely controlled by "recent top buyers," whose cost bases are densely distributed between $92,100 and $117,400. These investors bought heavily near previous highs and held through the decline from the all-time high to around $80,000, persisting until the current rebound phase.
Therefore, as prices recover towards their cost basis, these investors may look to break even or exit with minimal profits, creating natural overhead resistance. A true resumption of the bull market will require time and resilience to absorb this overhead supply and push prices effectively through this zone.
Key Recovery Levels
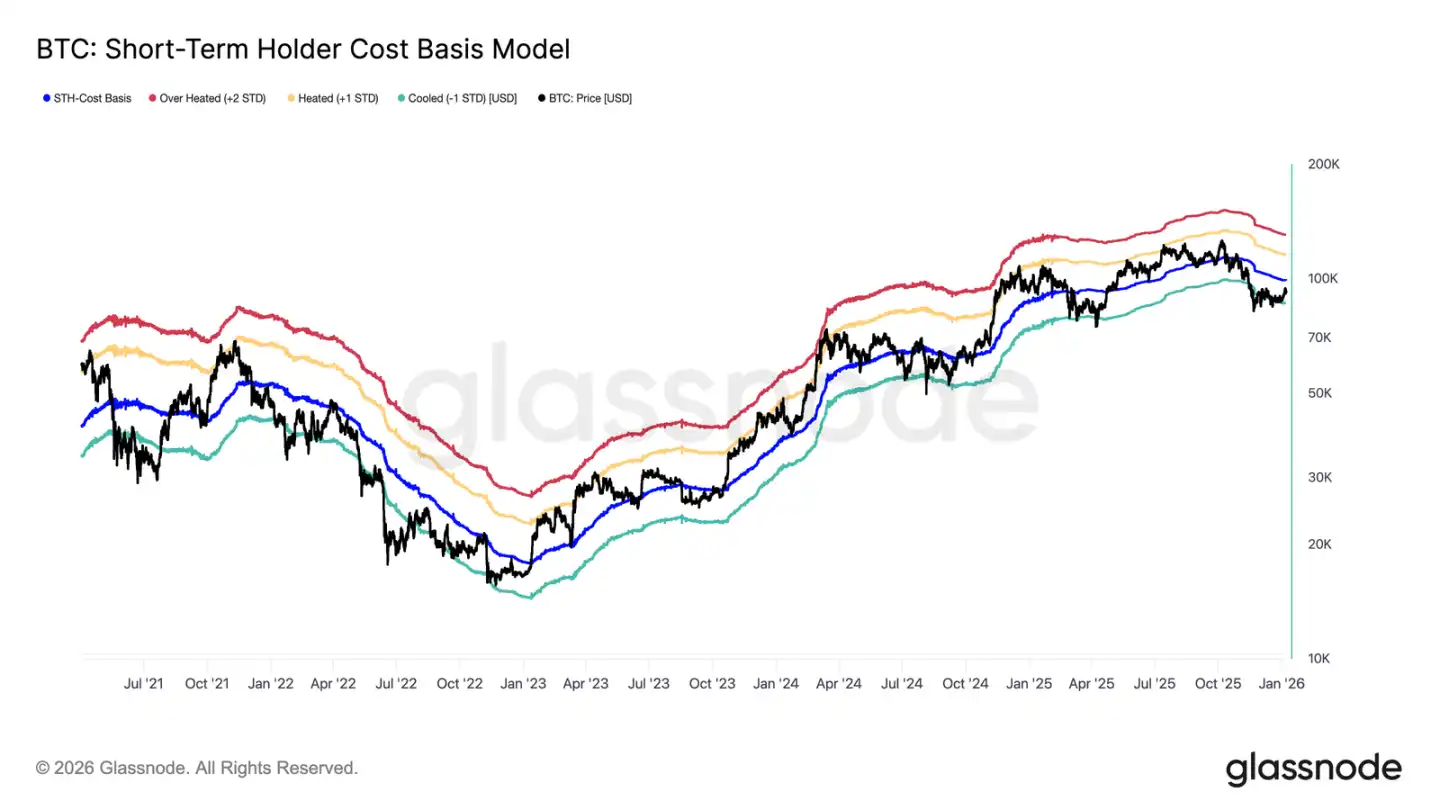
While facing overhead supply pressure, determining whether the recent rebound can truly reverse the prior downtrend and enter a phase of sustained demand requires a reliable price analysis framework. The Short-Term Holder (STH) Cost Basis model is particularly important during this transition period.
Notably, the market's weak equilibrium in December formed near the lower band of this model, reflecting fragile sentiment and weak buyer confidence at the time. The subsequent rebound has pushed the price back towards the model's mean, around the STH Cost Basis level of $99,100.
Therefore, the first key confirmation signal for market recovery will be the price sustaining a break above the STH Cost Basis, representing renewed investor confidence and a potential shift towards a positive trend.
At the Crossroads of Profit and Loss
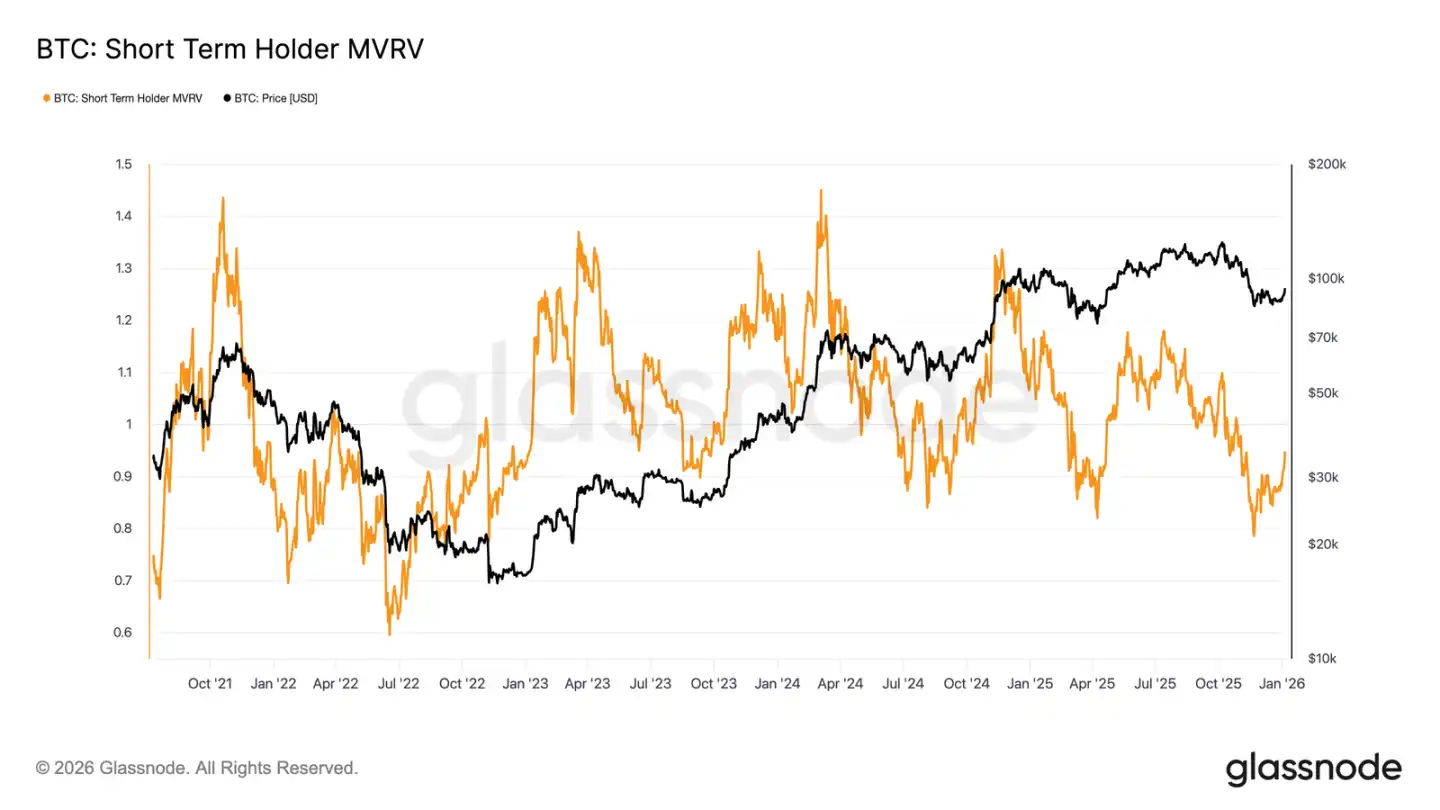
As the market focus shifts to whether it can effectively reclaim the STH Cost Basis, the current structure shows some similarity to the failed rebound in Q1 2022. A sustained failure to climb back above this level could risk a deeper decline. If confidence continues to wane, demand will further shrink.
This dynamic is also clearly reflected in the Short-Term Holder MVRV ratio. This metric, comparing the spot price to the average cost basis of recent buyers, reflects their profit/loss status. Historically, when this ratio remains below 1 (price below average cost), the market is often bear-dominated. Currently, the ratio has rebounded from a low of 0.79 to 0.95, meaning recent buyers are still at an average unrealized loss of about 5%. Failure to return to profitability (MVRV > 1) soon will keep downward pressure on the market, making this a key watchpoint in the coming weeks.
Off-Chain Insights
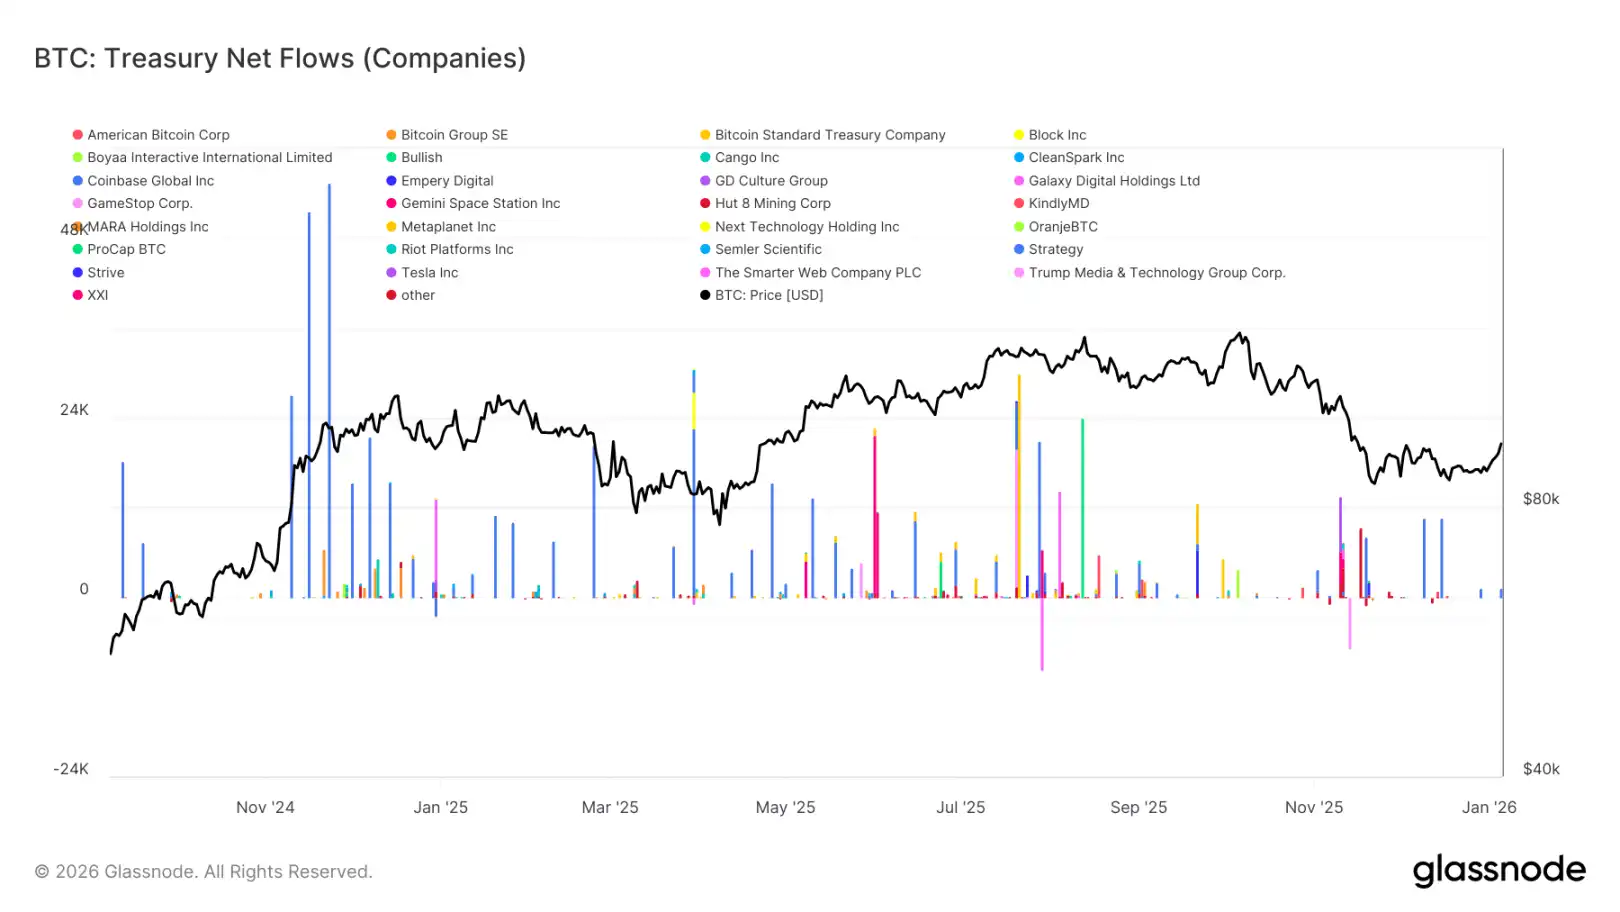
Digital Asset Treasury Demand Cools
Corporate treasuries continue to provide important marginal demand support for Bitcoin, but their buying behavior remains intermittent and event-driven. Treasury entities have seen multiple instances of net inflows of thousands of BTC in a single week, but these purchases have not formed a consistent, stable accumulation pattern.
Large inflows often occur during local price pullbacks or consolidation phases, indicating corporate buying remains price-sensitive, representing opportunistic allocation rather than long-term structural accumulation. Although the range of participating institutions has expanded, overall inflows show a "pulse-like" characteristic, interspersed with long quiet periods.
In the absence of sustained treasury buying support, corporate demand acts more as a price "stabilizer" than a driver of trend-based appreciation. Market direction will rely more on changes in derivatives positioning and short-term liquidity conditions.
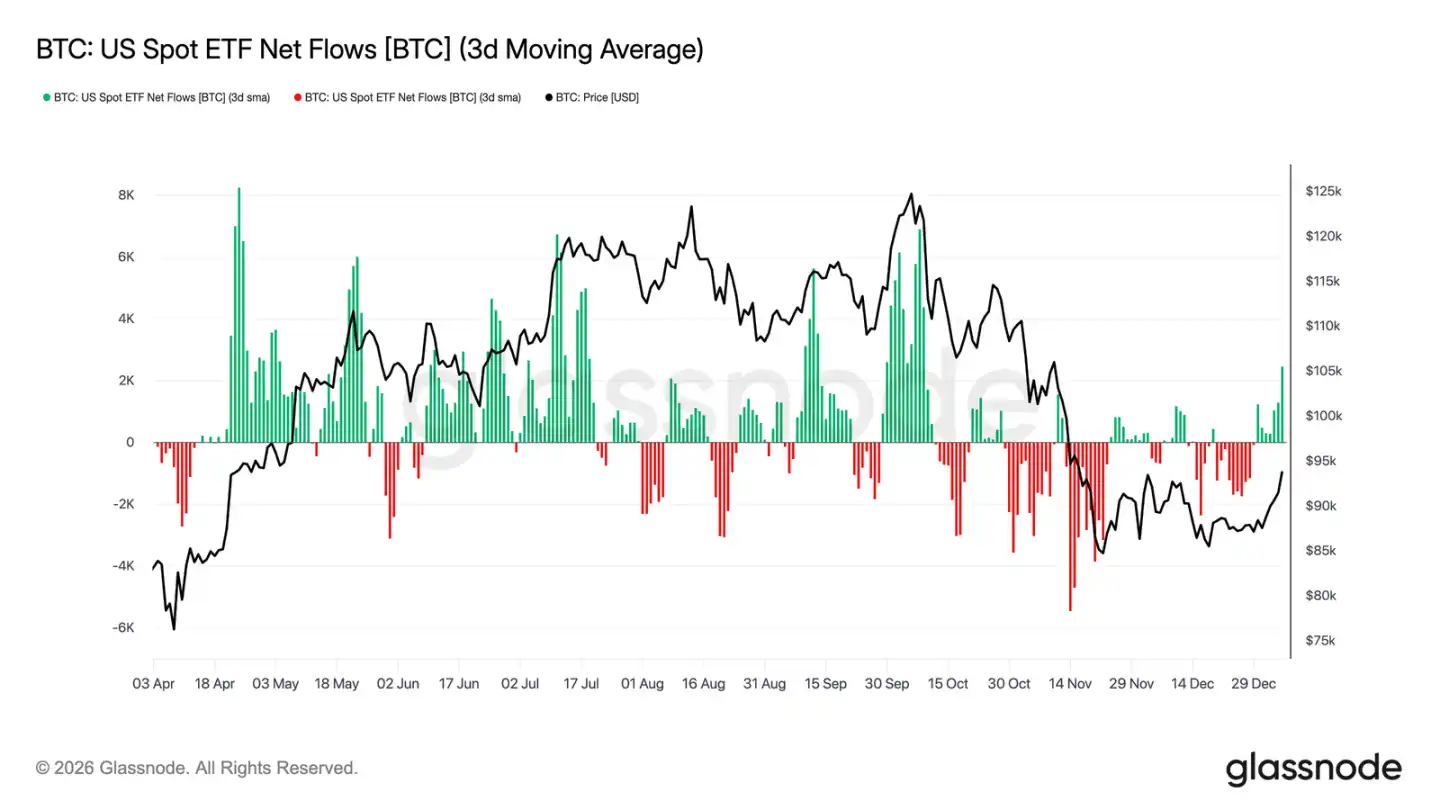
ETF Flows Return to Net Inflows
U.S. spot Bitcoin ETF flows recently showed early signals of institutional capital returning. After sustained net outflows and low activity in late 2025, flows have clearly turned net positive in recent weeks, coinciding with the price stabilizing and rebounding from the low-$80,000 range.
Although the current net inflow size hasn't recovered to the peak levels of mid-cycle, the flow direction has decisively turned. The increase in net inflow days indicates ETF investors are transitioning back from being sellers to marginal buyers.
This shift means institutional spot demand is once again becoming a positive supporting force for the market, rather than a source of liquidity pressure, providing structural buying support for the market stabilizing at the beginning of the year.
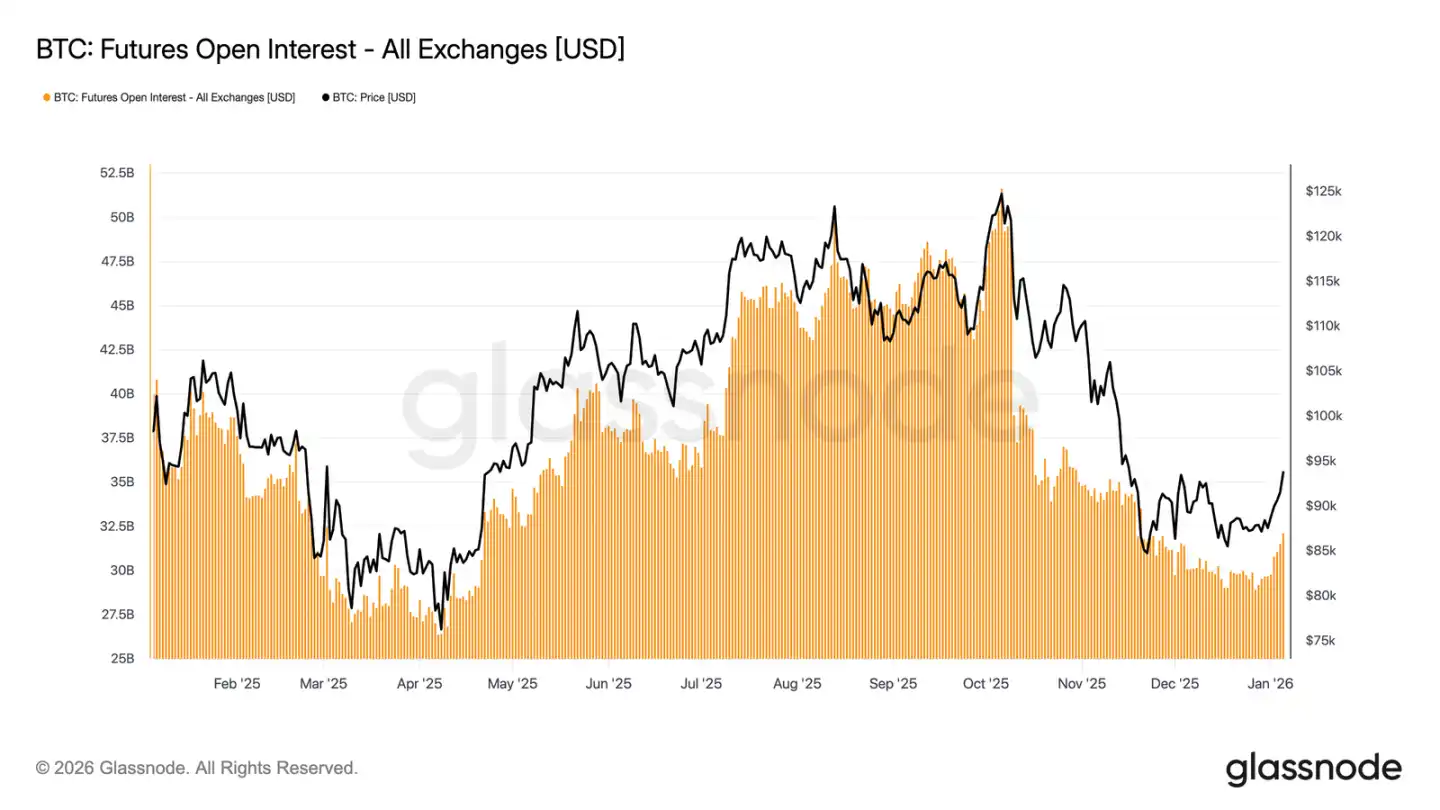
Futures Market Participation Recovers
After the sharp deleveraging triggered by the price decline in late 2025, total futures open interest has recently begun to recover. After falling from cycle highs above $50 billion, open interest has now stabilized and is growing modestly, indicating derivatives traders are re-establishing risk positions.
This rebuilding of positions coincides with the price stabilization process above $80,000-$90,000, showing traders are gradually increasing risk exposure rather than chasing prices higher aggressively. The current pace of re-accumulation is relatively moderate, and open interest remains well below previous cycle highs, reducing the risk of large-scale liquidations in the near term.
The modest recovery in open interest marks an improvement in local risk appetite, with derivatives buying gradually returning, helping prices conduct a new round of pricing as liquidity normalizes in the early year.
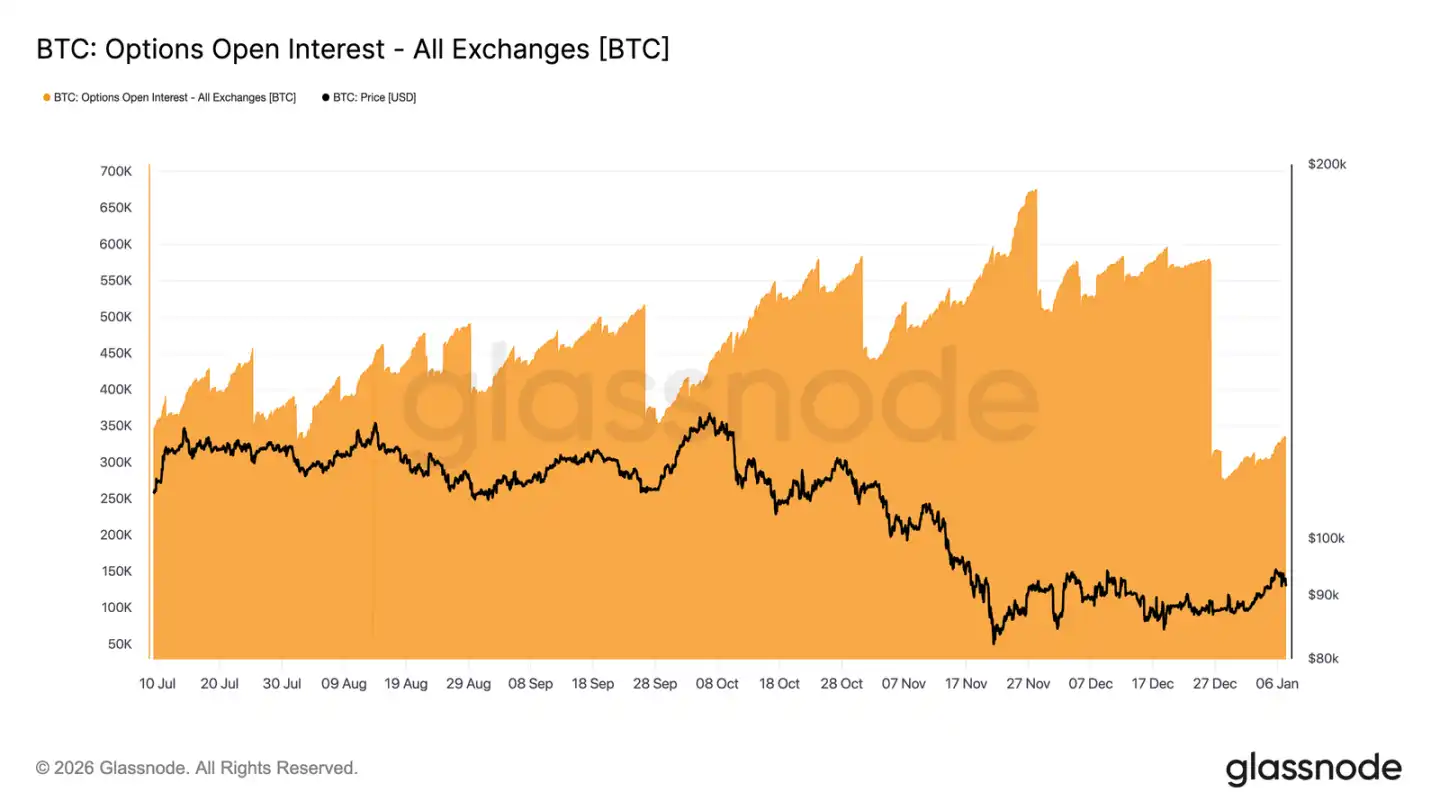
Options Market Position "Great Reset"
In late 2025, the Bitcoin options market experienced its largest-ever position reset. The number of open contracts plummeted from 579,258 on December 25th to 316,472 after the December 26th expiry, a drop of over 45%.
Heavy concentration of open interest at certain key prices can indirectly influence short-term price action through market makers' hedging operations. By year-end, this concentration reached high levels, creating "price stickiness" and limiting volatility.
Now, this structure has been broken. The concentrated clearing of year-end expiring positions freed the market from previous structural hedging constraints.
The post-expiry environment provides a clearer window into genuine sentiment, as new positions reflect current investor risk appetite rather than the influence of legacy holdings, making options trading in the first few weeks of the year more directly reflective of market expectations for future trends.
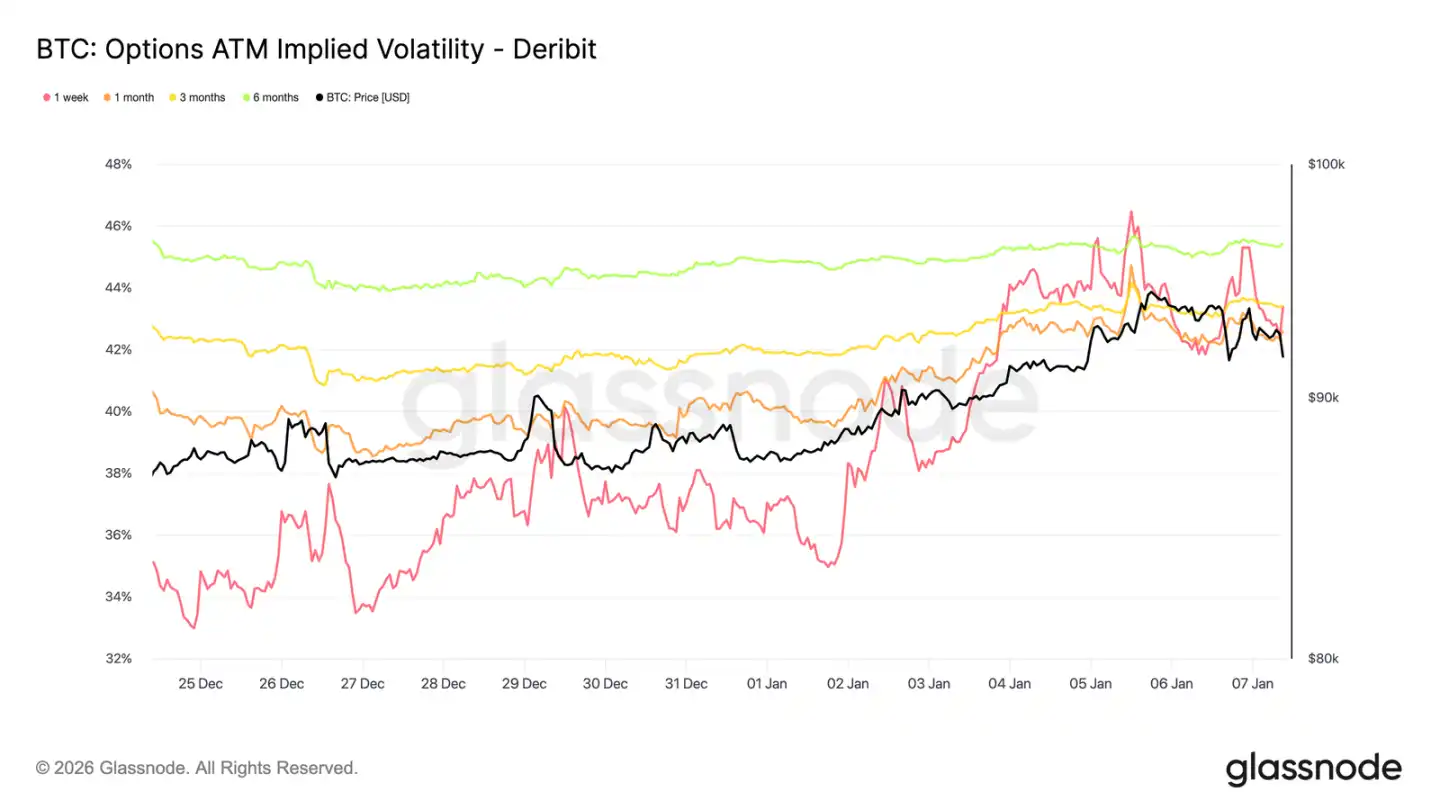
Implied Volatility May Have Bottomed
Following the massive options position reset, implied volatility touched a short-term low around the Christmas period. Thin holiday trading pushed 1-week implied volatility to its lowest level since late September last year.
Subsequently, buyer interest began to return, with investors gradually establishing long volatility positions (especially on the call side) around the new year, gently pushing volatility curves across tenors higher.
Despite the increase, implied volatility remains compressed. Volatility from one week to six months is concentrated between 42.6% and 45.4%, with a relatively flat curve shape.
Volatility remains at the lower end of its three-month range, and the recent increase reflects more a recovery in market participation than a comprehensive repricing of risk.
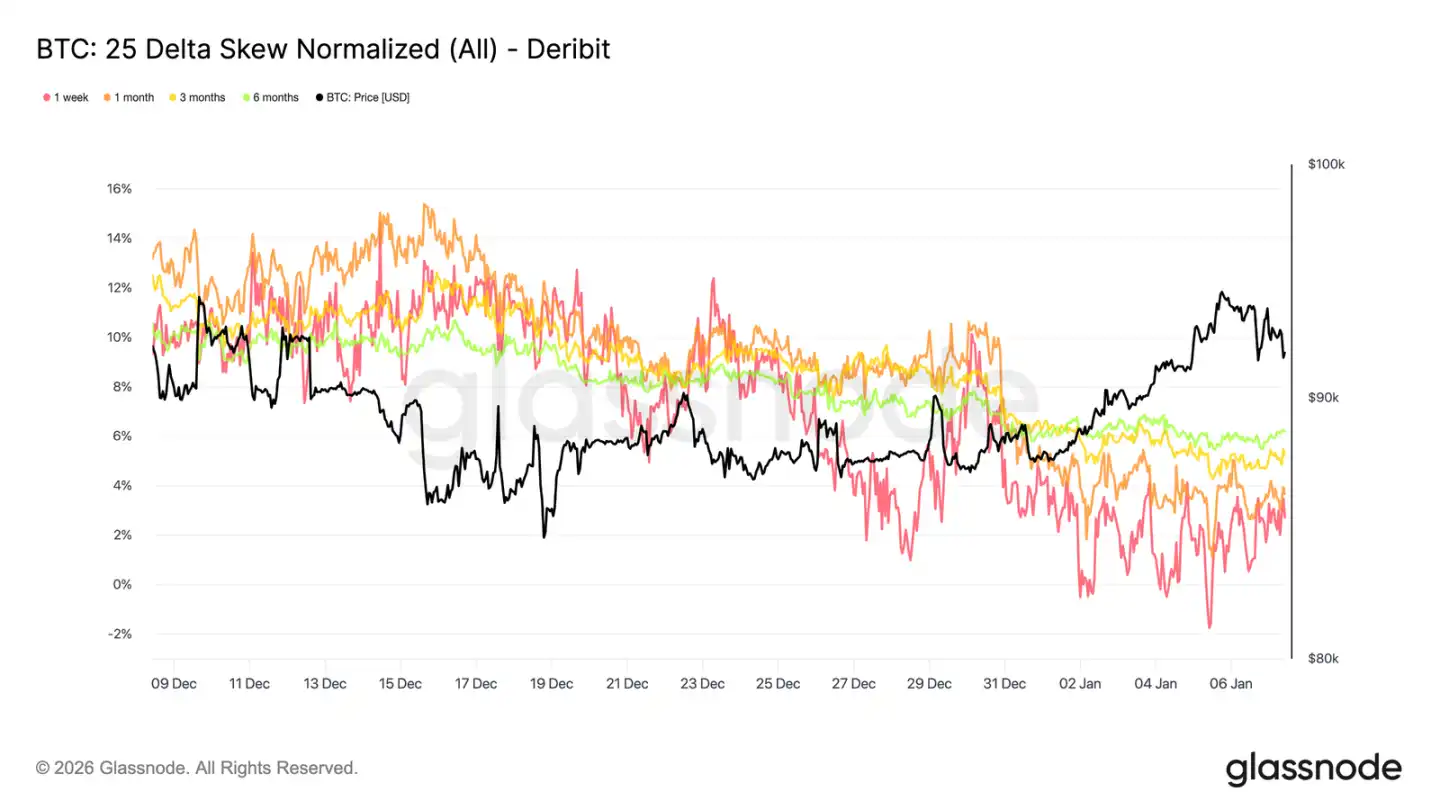
Market Moving Towards Balance
As implied volatility stabilizes, skew provides a clearer perspective on traders' directional preferences. Over the past month, the premium of put options relative to call options has continued to narrow across tenors, with the 25-Delta skew curve gradually normalizing towards zero.
This reflects a gradual shift towards bullish positioning. Investor demand is moving from单纯防范下跌 to increasing exposure to upside opportunities, consistent with their behavior of repositioning after the year-end position cleanup.
Concurrently, defensive positioning has reduced. Some downside protection has been unwound, lowering the premium paid for "black swan" insurance.
Overall, skew indicates that market risk expression is becoming more balanced, with increased investor expectation for price appreciation or volatility expansion.
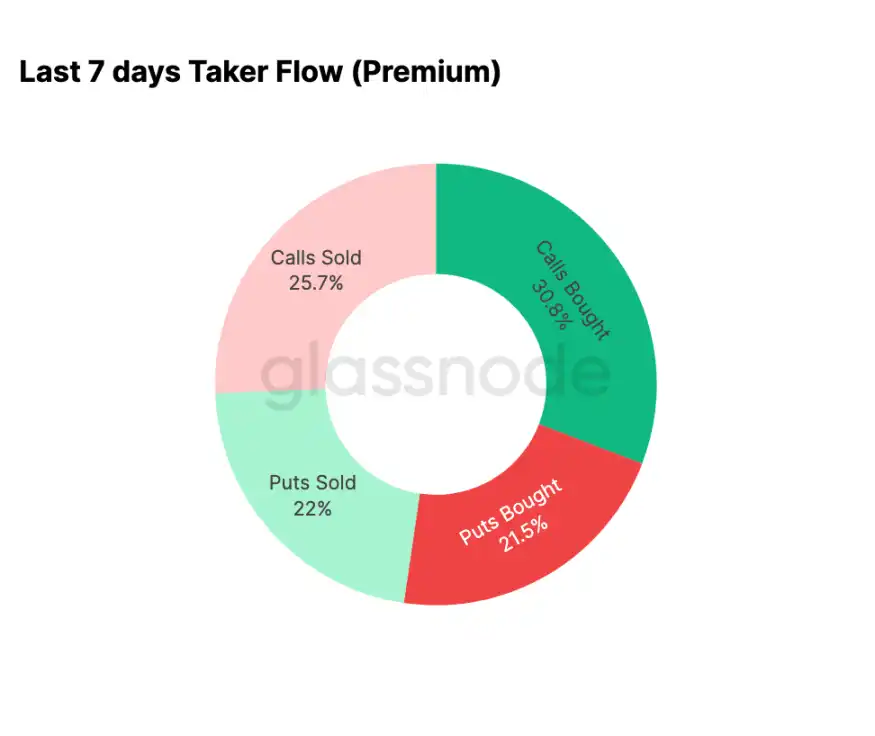
New Year Options Trading Leans Bullish
Flow data confirms the trend reflected by skew. Since the beginning of the year, options market activity has shifted from systematically selling calls (betting on lower volatility) to actively buying calls (betting on rallies or increased volatility).
Over the past seven days, call buying accounted for 30.8% of total options activity. The rise in call demand has also attracted participation from volatility sellers, who sell calls (25.7% of activity) to capture higher premiums.
Put-side trading accounted for 43.5% of volume, a relatively moderate proportion against the backdrop of recent price gains. This aligns with the balanced skew, reflecting reduced demand for immediate downside protection.
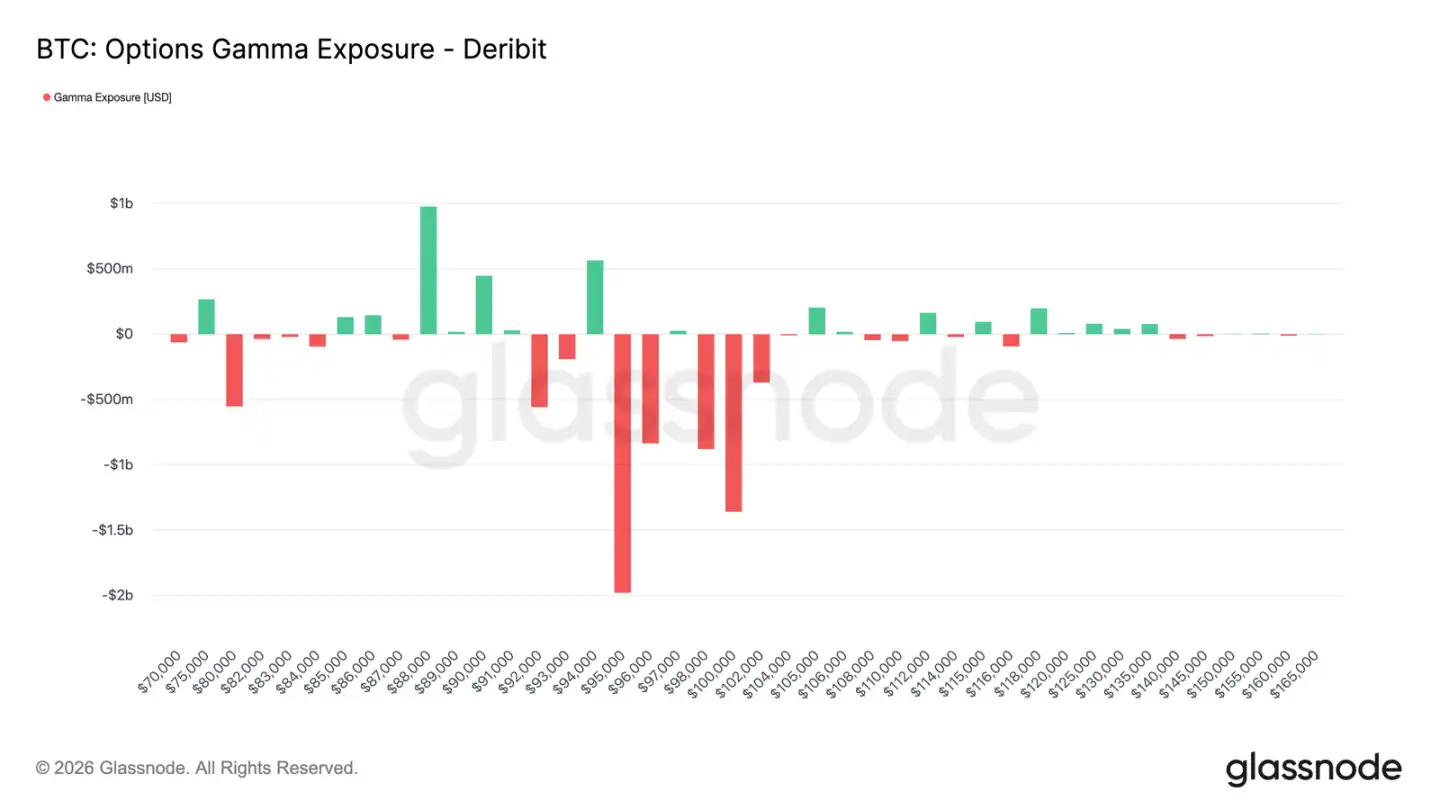
Market Makers Turn Net Short in Key Zone
With increased call option activity since the new year, market maker positioning has adjusted accordingly. Currently, market makers hold a net short position overall in the $95,000 to $104,000 range.
Within this range, if prices rise, market makers need to buy spot or perpetual contracts to hedge their risk. This passive operation can create a boosting effect when the market strengthens, contrasting sharply with the positive gamma environment that suppressed volatility late last year.
The concentration of call buying by traders in the $95,000 to $100,000 range for Q1 expiry contracts further confirms the shift in market risk expression. The current market maker positioning structure means their hedging activity no longer suppresses price volatility in this zone and may even amplify upward moves.
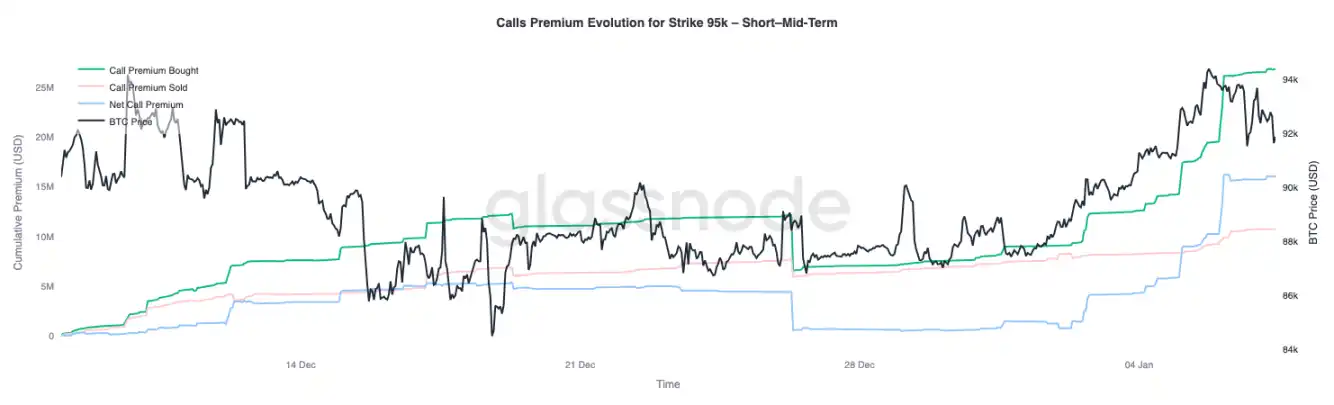
$95k Call Premiums Show Patience
The premium behavior of the $95,000 strike call options serves as an effective indicator for observing sentiment shifts. Call premium buying for this strike accelerated around January 1st when the spot price was still near $87,000, and continued to increase as the price climbed towards the recent high of $94,400.
Subsequently, premium buying has flattened but not significantly retreated. More importantly, this process was not accompanied by a substantial increase in call premium selling.
This indicates limited profit-taking. Since the recent high, call selling volume has only risen modestly, suggesting most call holders are choosing to hold onto their positions rather than rush to lock in profits.
Overall, the options premium activity around the $95,000 strike reflects the patience and holding confidence of bullish participants.
Conclusion
Entering the new year, Bitcoin has undergone significant cleaning of historical positions across spot, futures, and options markets. The deleveraging in late 2025 and the year-end options expiry event effectively removed the structural constraints previously facing the market, leaving a cleaner environment with clearer signals.
Early signs of renewed participation are now emerging: ETF flows are stabilizing and turning positive, futures market activity is rebuilding, and the options market is clearly shifting towards bullish positioning—skew normalizing, volatility bottoming, market makers turning net short in key upper ranges.
These dynamics collectively suggest the market is gradually transitioning from a mode dominated by defensive selling to a phase of selectively increasing risk exposure and rebuilding participation. Although structural buying power仍需加强, the release of historical position pressure and the renewed accumulation of bullish sentiment mean Bitcoin has started 2026 with lighter footing, improved internal market structure, and greater potential for subsequent行情拓展.


